

Key Insights
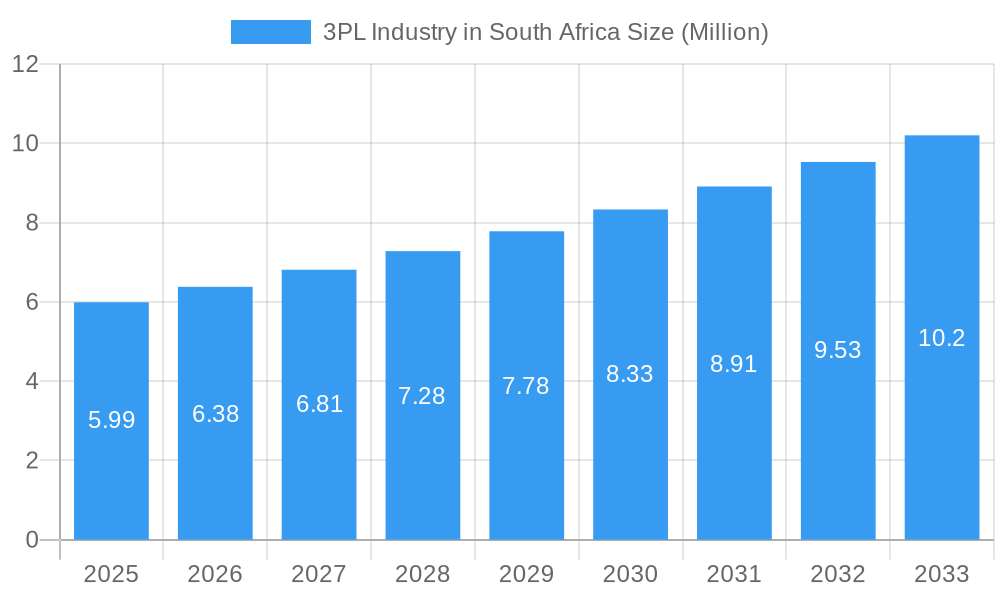
The South African 3PL (Third-Party Logistics) industry, valued at $5.99 million in 2025, is poised for robust growth, driven by the expansion of e-commerce, increasing manufacturing activity, and a rising need for efficient supply chain management. The sector's 6.64% CAGR (Compound Annual Growth Rate) from 2019-2033 indicates a substantial market expansion over the forecast period (2025-2033). Key growth drivers include the increasing adoption of advanced technologies like warehouse management systems (WMS) and transportation management systems (TMS), the rise of omnichannel retail strategies demanding flexible and agile logistics solutions, and a growing focus on optimizing supply chain visibility and reducing lead times. The dominance of key players like DHL, DB Schenker, and Kuehne + Nagel underscores the competitive landscape; however, opportunities exist for smaller, specialized 3PL providers to cater to niche markets within the manufacturing, automotive, oil & gas, and healthcare sectors. The significant growth in e-commerce particularly within the distributive trade segment will further fuel demand for warehousing and distribution services, presenting a lucrative opportunity for companies offering value-added services such as last-mile delivery and specialized inventory management. The burgeoning infrastructure development across South Africa and its surrounding regions in Africa further supports the positive outlook for the 3PL market. Challenges remain, including infrastructure limitations in certain areas and the need for skilled workforce development to meet the growing industry demands.
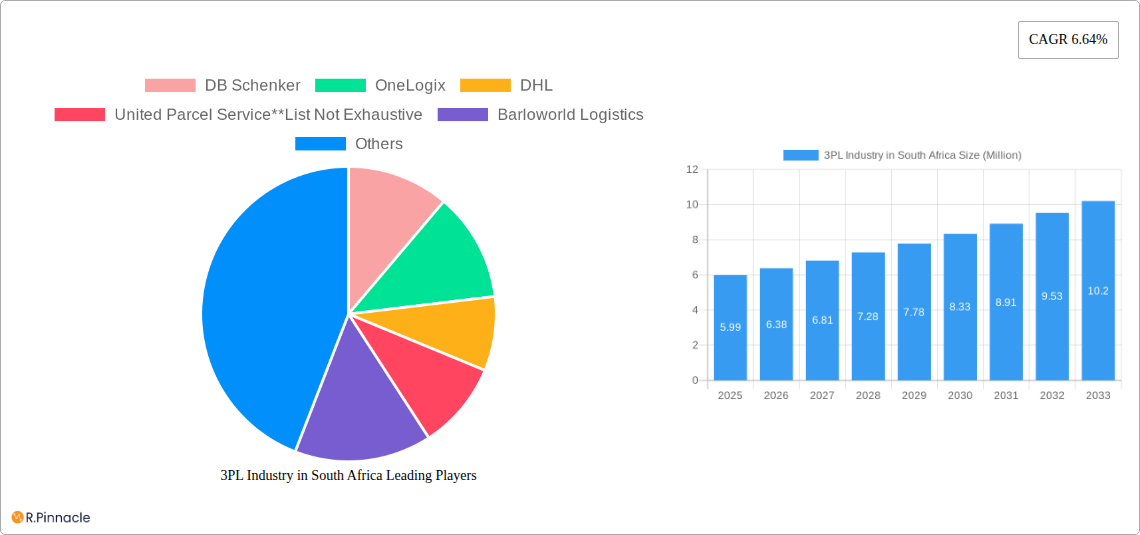
3PL Industry in South Africa Market Size (In Million)
Growth within the South African 3PL market will be particularly strong in the domestic transportation management segment, fuelled by increased intra-regional trade and the expansion of businesses relying on efficient delivery networks. International transportation management will also see growth, driven by increasing imports and exports, particularly in sectors such as pharmaceuticals and manufacturing. The value-added warehousing and distribution sector, experiencing heightened demand due to e-commerce, represents another considerable segment for future growth. Competition is expected to intensify, pushing companies to innovate their service offerings and leverage technology to improve efficiency and gain a competitive edge. A focus on sustainability and ethical sourcing will also influence future market trends, with companies increasingly prioritizing environmentally friendly logistics practices and responsible supply chain management. The continued economic growth of South Africa will be a significant factor in the future trajectory of this market.
3PL Industry in South Africa Company Market Share
South Africa's 3PL Industry: A Comprehensive Market Report (2019-2033)
This in-depth report provides a comprehensive analysis of the 3PL (Third-Party Logistics) industry in South Africa, offering invaluable insights for industry professionals, investors, and strategic decision-makers. Covering the period from 2019 to 2033, with a focus on 2025, this report unveils market dynamics, growth drivers, challenges, and future opportunities within this crucial sector. The report leverages extensive data analysis and expert insights to deliver actionable intelligence, enabling informed strategies and enhanced competitiveness. The market size is projected to reach xx Million by 2033.
3PL Industry in South Africa Market Structure & Innovation Trends
This section delves into the competitive dynamics of South Africa's 3PL sector, examining market concentration, the pivotal role of innovation, the influence of regulatory landscapes, and the impact of mergers and acquisitions (M&A).
The South African 3PL market is characterized by a moderately concentrated structure. Prominent global players like DHL, DB Schenker, and Kuehne + Nagel command a substantial portion of market share. However, the ecosystem is enriched by a diverse array of smaller, highly specialized providers who collectively contribute significantly to the industry's vibrancy. As of 2025, the estimated combined market share of the top 5 players hovers around 45%, indicating a balanced interplay between large-scale operators and niche specialists.
- Market Concentration: While major metropolitan centers exhibit higher market concentration due to robust economic activity and infrastructure, competition tends to be more fragmented across rural and peri-urban regions.
- Innovation Drivers: A significant thrust towards enhanced efficiency and cost optimization is being propelled by technological advancements. Key areas of innovation include the integration of automation in warehousing, the strategic application of Artificial Intelligence (AI) for route optimization and demand forecasting, and the deployment of the Internet of Things (IoT) for real-time asset tracking and inventory management. The burgeoning e-commerce sector is a particularly strong catalyst, escalating the demand for sophisticated value-added services such as agile last-mile delivery solutions and advanced, multi-functional warehousing facilities.
- Regulatory Framework: The operational landscape of the 3PL industry is continually shaped by a comprehensive array of government regulations. These encompass stringent rules pertaining to transportation safety and standards, environmental compliance in warehousing operations, and evolving data privacy laws that govern the handling of sensitive logistics information.
- Product Substitutes: Direct substitutes for comprehensive 3PL services are relatively limited. However, large corporations may leverage internal logistics capabilities, presenting an indirect competitive challenge to external providers.
- End-User Demographics: The primary demand for 3PL services originates from the manufacturing & automotive sectors, followed closely by distributive trade (wholesale, retail, and e-commerce), and the highly specialized pharma & healthcare industries.
- M&A Activity: Over the past five years, the South African 3PL market has experienced significant M&A activity, with an estimated value of approximately **[Insert specific M&A Deal Value Here, e.g., R 2,500 Million]** in reported deals. These transactions have been predominantly driven by strategic consolidation initiatives aimed at expanding market reach, enhancing service portfolios, and achieving economies of scale among established players.
3PL Industry in South Africa Market Dynamics & Trends
This section delves into the dynamic forces shaping the South African 3PL market, encompassing growth drivers, technological disruptions, consumer preferences, and competitive dynamics. The market is projected to experience a Compound Annual Growth Rate (CAGR) of xx% during the forecast period (2025-2033). Market penetration is expected to increase by xx% in the same period, driven largely by growth in e-commerce and increased outsourcing of logistics functions.
The South African 3PL market is experiencing robust growth fueled by several factors. The expansion of e-commerce is a significant driver, demanding efficient and reliable last-mile delivery solutions. Furthermore, increasing focus on supply chain optimization and cost reduction is prompting businesses to outsource their logistics operations to 3PL providers. Technological advancements are also transforming the industry, introducing automation, real-time tracking, and data analytics capabilities, which are enhancing efficiency and transparency. Competitive dynamics are intense, with established players competing on price, service quality, and technological capabilities while new entrants seek to disrupt the market with innovative solutions.
Dominant Regions & Segments in 3PL Industry in South Africa
This section identifies the leading geographical regions and market segments that are at the forefront of the South African 3PL industry's growth and development.
By Service:
- Domestic Transportation Management: Gauteng province stands as the undisputed leader, benefiting from its central position, high concentration of industrial activity, and an extensive, well-developed road network. Proximity to major economic hubs and efficient connectivity to key national infrastructure are critical drivers for this segment's dominance.
- International Transportation Management: The strategic importance of South Africa's major ports – Durban, Cape Town, and Port Elizabeth – cannot be overstated. These gateways are pivotal for international trade, significantly fueling growth in international transportation management. A surge in global trade volumes and the impact of favorable trade agreements are key contributing factors to this segment's expansion.
- Value-added Warehousing and Distribution: Gauteng and the Western Cape provinces are experiencing robust growth in this segment. This is primarily attributed to the escalating demands from the manufacturing, retail, and particularly the rapidly expanding e-commerce sectors. The availability of modern warehousing infrastructure and proximity to large consumer bases are crucial advantages.
By End-User:
- Manufacturing & Automotive: This sector remains the largest consumer of 3PL services, driven by the critical need for sophisticated supply chain management, just-in-time (JIT) delivery capabilities, and efficient inventory control to support complex production processes.
- Distributive Trade (Wholesale and Retail trade including e-commerce): The explosive growth of e-commerce has fundamentally reshaped this segment, creating an insatiable demand for agile last-mile delivery solutions, specialized fulfillment centers, and efficient returns management processes.
- Pharma & Healthcare: Characterized by extremely stringent regulatory compliance requirements, this segment demands highly specialized logistics, particularly in temperature-controlled warehousing and transportation. 3PL providers with expertise in cold chain logistics and adherence to Good Distribution Practices (GDP) are well-positioned to capture this market.
While the above segments represent the primary drivers, other end-user categories such as Oil & Gas and Chemicals, Construction, and various Other End Users also contribute to the overall market expansion, albeit with varying degrees of volume and complexity.
3PL Industry in South Africa Product Innovations
The South African 3PL sector is witnessing rapid product innovation, driven primarily by technological advancements. The adoption of warehouse management systems (WMS), transportation management systems (TMS), and route optimization software is enhancing efficiency and transparency across the supply chain. Real-time tracking and monitoring systems are improving visibility and enabling proactive issue resolution. The integration of artificial intelligence (AI) and machine learning (ML) is further optimizing logistics processes and enhancing predictive capabilities. These innovations are creating significant competitive advantages for 3PL providers that embrace them.
Report Scope & Segmentation Analysis
This report provides a detailed segmentation of the South African 3PL market by service type (Domestic Transportation Management, International Transportation Management, Value-added Warehousing and Distribution) and end-user industry (Manufacturing & Automotive, Oil & Gas and Chemicals, Distributive Trade, Pharma & Healthcare, Construction, Other End Users). Each segment's growth projections, market size, and competitive dynamics are meticulously analyzed, providing a granular view of the market's composition and future trajectory. The report includes detailed forecasts for each segment, outlining market size and growth rates for the forecast period (2025-2033). Competitive dynamics within each segment are also assessed, highlighting key players, competitive strategies, and market share distributions.
Key Drivers of 3PL Industry in South Africa Growth
The South African 3PL industry is experiencing robust growth, propelled by a confluence of potent drivers. The exponential expansion of e-commerce stands as a paramount catalyst, significantly amplifying the need for sophisticated and efficient last-mile delivery networks and specialized warehousing solutions tailored for online fulfillment. Concurrently, a pervasive trend among businesses to enhance supply chain visibility, optimize operational efficiency, and achieve substantial cost reductions is compelling them to increasingly outsource their logistics functions to expert 3PL providers. Government initiatives focused on infrastructure development, including the upgrading of road networks and port facilities, are instrumental in facilitating smoother and more cost-effective movement of goods across the nation. Furthermore, the relentless pace of technological innovation, encompassing the adoption of advanced automation in warehousing, the strategic deployment of AI for predictive analytics and route optimization, and the widespread implementation of real-time tracking systems, is continuously enhancing operational efficiency, transparency, and responsiveness throughout the supply chain.
Challenges in the 3PL Industry in South Africa Sector
The South African 3PL industry faces several challenges. High infrastructure costs and limited capacity in certain areas can hinder operations. Fluctuating fuel prices and currency exchange rates impact transportation costs. Competition from established players and new entrants puts pressure on pricing and profitability. Regulatory compliance and security concerns require substantial investment. These factors can lead to increased operational costs and reduce profit margins for 3PL providers.
Emerging Opportunities in 3PL Industry in South Africa
The South African 3PL landscape is ripe with emerging opportunities for forward-thinking providers. The relentless growth of the e-commerce sector continues to unlock significant potential in specialized service offerings, including highly efficient last-mile delivery solutions and streamlined reverse logistics (returns management). The accelerated adoption of cutting-edge technologies like AI and advanced automation presents a pathway for 3PLs to unlock new levels of efficiency, reduce operational costs, and offer more intelligent, data-driven services. Strategic expansion into previously underserved regional markets and diversification into burgeoning industry segments offer substantial avenues for growth. Moreover, the increasing global and local emphasis on environmental sustainability is creating a distinct opportunity for 3PL providers who champion and invest in green logistics initiatives, such as optimizing fuel efficiency, utilizing electric vehicles, and implementing eco-friendly warehousing practices.
Leading Players in the 3PL Industry in South Africa Market
- DB Schenker
- OneLogix
- DHL
- United Parcel Service
- Barloworld Logistics
- Vital Distribution
- CEVA Logistics
- Kuehne + Nagel
- Transnova
- Bidvest International Logistics
- Bollore Logistics
- DPD Laser Express Logistics
- Value Logistics
- DSV
- City Logistics
Key Developments in 3PL Industry in South Africa Industry
- 2022 Q3: DHL expands its warehousing capacity in Gauteng.
- 2023 Q1: DB Schenker invests in automated sorting technology.
- 2024 Q2: A major merger between two mid-sized 3PL providers.
- 2025 Q1: Introduction of new last-mile delivery solutions driven by e-commerce growth.
Future Outlook for 3PL Industry in South Africa Market
The future of the South African 3PL industry looks bright. Continued growth in e-commerce, investments in infrastructure, and technological advancements will drive market expansion. Opportunities lie in specializing in niche sectors, adopting advanced technologies, and providing value-added services. Strategic partnerships and acquisitions will reshape the competitive landscape, leading to increased efficiency and better customer service. The industry is poised for sustainable growth, creating significant opportunities for established players and new entrants alike.
3PL Industry in South Africa Segmentation
-
1. Service
- 1.1. Domestic Transportation Management
- 1.2. International Transportation Management
- 1.3. Value-added Warehousing and Distribution
-
2. End-User
- 2.1. Manufacturing & Automotive
- 2.2. Oil & Gas and Chemicals
- 2.3. Distribu
- 2.4. Pharma & Healthcare
- 2.5. Construction
- 2.6. Other End Users
3PL Industry in South Africa Segmentation By Geography
-
1. North America
- 1.1. United States
- 1.2. Canada
- 1.3. Mexico
-
2. South America
- 2.1. Brazil
- 2.2. Argentina
- 2.3. Rest of South America
-
3. Europe
- 3.1. United Kingdom
- 3.2. Germany
- 3.3. France
- 3.4. Italy
- 3.5. Spain
- 3.6. Russia
- 3.7. Benelux
- 3.8. Nordics
- 3.9. Rest of Europe
-
4. Middle East & Africa
- 4.1. Turkey
- 4.2. Israel
- 4.3. GCC
- 4.4. North Africa
- 4.5. South Africa
- 4.6. Rest of Middle East & Africa
-
5. Asia Pacific
- 5.1. China
- 5.2. India
- 5.3. Japan
- 5.4. South Korea
- 5.5. ASEAN
- 5.6. Oceania
- 5.7. Rest of Asia Pacific
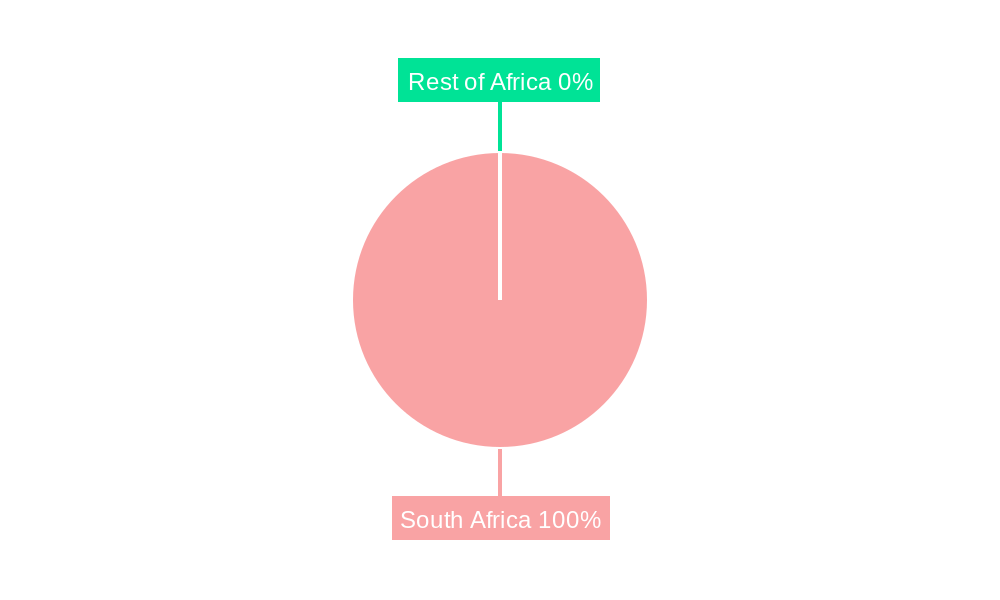
3PL Industry in South Africa Regional Market Share
Geographic Coverage of 3PL Industry in South Africa
3PL Industry in South Africa REPORT HIGHLIGHTS
| Aspects | Details |
|---|---|
| Study Period | 2020-2034 |
| Base Year | 2025 |
| Estimated Year | 2026 |
| Forecast Period | 2026-2034 |
| Historical Period | 2020-2025 |
| Growth Rate | CAGR of 6.64% from 2020-2034 |
| Segmentation |
|
Table of Contents
- 1. Introduction
- 1.1. Research Scope
- 1.2. Market Segmentation
- 1.3. Research Objective
- 1.4. Definitions and Assumptions
- 2. Executive Summary
- 2.1. Market Snapshot
- 3. Market Dynamics
- 3.1. Market Drivers
- 3.2. Market Restrains
- 3.3. Market Trends
- 3.4. Market Opportunities
- 4. Market Factor Analysis
- 4.1. Porters Five Forces
- 4.1.1. Bargaining Power of Suppliers
- 4.1.2. Bargaining Power of Buyers
- 4.1.3. Threat of New Entrants
- 4.1.4. Threat of Substitutes
- 4.1.5. Competitive Rivalry
- 4.2. PESTEL analysis
- 4.3. BCG Analysis
- 4.3.1. Stars (High Growth, High Market Share)
- 4.3.2. Cash Cows (Low Growth, High Market Share)
- 4.3.3. Question Mark (High Growth, Low Market Share)
- 4.3.4. Dogs (Low Growth, Low Market Share)
- 4.4. Ansoff Matrix Analysis
- 4.5. Supply Chain Analysis
- 4.6. Regulatory Landscape
- 4.7. Current Market Potential and Opportunity Assessment (TAM–SAM–SOM Framework)
- 4.8. PRI Analyst Note
- 4.1. Porters Five Forces
- 5. Market Analysis, Insights and Forecast 2021-2033
- 5.1. Market Analysis, Insights and Forecast - by Service
- 5.1.1. Domestic Transportation Management
- 5.1.2. International Transportation Management
- 5.1.3. Value-added Warehousing and Distribution
- 5.2. Market Analysis, Insights and Forecast - by End-User
- 5.2.1. Manufacturing & Automotive
- 5.2.2. Oil & Gas and Chemicals
- 5.2.3. Distribu
- 5.2.4. Pharma & Healthcare
- 5.2.5. Construction
- 5.2.6. Other End Users
- 5.3. Market Analysis, Insights and Forecast - by Region
- 5.3.1. North America
- 5.3.2. South America
- 5.3.3. Europe
- 5.3.4. Middle East & Africa
- 5.3.5. Asia Pacific
- 5.1. Market Analysis, Insights and Forecast - by Service
- 6. Global 3PL Industry in South Africa Analysis, Insights and Forecast, 2021-2033
- 6.1. Market Analysis, Insights and Forecast - by Service
- 6.1.1. Domestic Transportation Management
- 6.1.2. International Transportation Management
- 6.1.3. Value-added Warehousing and Distribution
- 6.2. Market Analysis, Insights and Forecast - by End-User
- 6.2.1. Manufacturing & Automotive
- 6.2.2. Oil & Gas and Chemicals
- 6.2.3. Distribu
- 6.2.4. Pharma & Healthcare
- 6.2.5. Construction
- 6.2.6. Other End Users
- 6.1. Market Analysis, Insights and Forecast - by Service
- 7. North America 3PL Industry in South Africa Analysis, Insights and Forecast, 2020-2032
- 7.1. Market Analysis, Insights and Forecast - by Service
- 7.1.1. Domestic Transportation Management
- 7.1.2. International Transportation Management
- 7.1.3. Value-added Warehousing and Distribution
- 7.2. Market Analysis, Insights and Forecast - by End-User
- 7.2.1. Manufacturing & Automotive
- 7.2.2. Oil & Gas and Chemicals
- 7.2.3. Distribu
- 7.2.4. Pharma & Healthcare
- 7.2.5. Construction
- 7.2.6. Other End Users
- 7.1. Market Analysis, Insights and Forecast - by Service
- 8. South America 3PL Industry in South Africa Analysis, Insights and Forecast, 2020-2032
- 8.1. Market Analysis, Insights and Forecast - by Service
- 8.1.1. Domestic Transportation Management
- 8.1.2. International Transportation Management
- 8.1.3. Value-added Warehousing and Distribution
- 8.2. Market Analysis, Insights and Forecast - by End-User
- 8.2.1. Manufacturing & Automotive
- 8.2.2. Oil & Gas and Chemicals
- 8.2.3. Distribu
- 8.2.4. Pharma & Healthcare
- 8.2.5. Construction
- 8.2.6. Other End Users
- 8.1. Market Analysis, Insights and Forecast - by Service
- 9. Europe 3PL Industry in South Africa Analysis, Insights and Forecast, 2020-2032
- 9.1. Market Analysis, Insights and Forecast - by Service
- 9.1.1. Domestic Transportation Management
- 9.1.2. International Transportation Management
- 9.1.3. Value-added Warehousing and Distribution
- 9.2. Market Analysis, Insights and Forecast - by End-User
- 9.2.1. Manufacturing & Automotive
- 9.2.2. Oil & Gas and Chemicals
- 9.2.3. Distribu
- 9.2.4. Pharma & Healthcare
- 9.2.5. Construction
- 9.2.6. Other End Users
- 9.1. Market Analysis, Insights and Forecast - by Service
- 10. Middle East & Africa 3PL Industry in South Africa Analysis, Insights and Forecast, 2020-2032
- 10.1. Market Analysis, Insights and Forecast - by Service
- 10.1.1. Domestic Transportation Management
- 10.1.2. International Transportation Management
- 10.1.3. Value-added Warehousing and Distribution
- 10.2. Market Analysis, Insights and Forecast - by End-User
- 10.2.1. Manufacturing & Automotive
- 10.2.2. Oil & Gas and Chemicals
- 10.2.3. Distribu
- 10.2.4. Pharma & Healthcare
- 10.2.5. Construction
- 10.2.6. Other End Users
- 10.1. Market Analysis, Insights and Forecast - by Service
- 11. Asia Pacific 3PL Industry in South Africa Analysis, Insights and Forecast, 2020-2032
- 11.1. Market Analysis, Insights and Forecast - by Service
- 11.1.1. Domestic Transportation Management
- 11.1.2. International Transportation Management
- 11.1.3. Value-added Warehousing and Distribution
- 11.2. Market Analysis, Insights and Forecast - by End-User
- 11.2.1. Manufacturing & Automotive
- 11.2.2. Oil & Gas and Chemicals
- 11.2.3. Distribu
- 11.2.4. Pharma & Healthcare
- 11.2.5. Construction
- 11.2.6. Other End Users
- 11.1. Market Analysis, Insights and Forecast - by Service
- 12. Competitive Analysis
- 12.1. Company Profiles
- 12.1.1 DB Schenker
- 12.1.1.1. Company Overview
- 12.1.1.2. Products
- 12.1.1.3. Company Financials
- 12.1.1.4. SWOT Analysis
- 12.1.2 OneLogix
- 12.1.2.1. Company Overview
- 12.1.2.2. Products
- 12.1.2.3. Company Financials
- 12.1.2.4. SWOT Analysis
- 12.1.3 DHL
- 12.1.3.1. Company Overview
- 12.1.3.2. Products
- 12.1.3.3. Company Financials
- 12.1.3.4. SWOT Analysis
- 12.1.4 United Parcel Service**List Not Exhaustive
- 12.1.4.1. Company Overview
- 12.1.4.2. Products
- 12.1.4.3. Company Financials
- 12.1.4.4. SWOT Analysis
- 12.1.5 Barloworld Logistics
- 12.1.5.1. Company Overview
- 12.1.5.2. Products
- 12.1.5.3. Company Financials
- 12.1.5.4. SWOT Analysis
- 12.1.6 Vital Distribution
- 12.1.6.1. Company Overview
- 12.1.6.2. Products
- 12.1.6.3. Company Financials
- 12.1.6.4. SWOT Analysis
- 12.1.7 CEVA Logistics
- 12.1.7.1. Company Overview
- 12.1.7.2. Products
- 12.1.7.3. Company Financials
- 12.1.7.4. SWOT Analysis
- 12.1.8 Kuehne + Nagel
- 12.1.8.1. Company Overview
- 12.1.8.2. Products
- 12.1.8.3. Company Financials
- 12.1.8.4. SWOT Analysis
- 12.1.9 Transnova
- 12.1.9.1. Company Overview
- 12.1.9.2. Products
- 12.1.9.3. Company Financials
- 12.1.9.4. SWOT Analysis
- 12.1.10 Bidvest International Logistics
- 12.1.10.1. Company Overview
- 12.1.10.2. Products
- 12.1.10.3. Company Financials
- 12.1.10.4. SWOT Analysis
- 12.1.11 Bollore Logistics
- 12.1.11.1. Company Overview
- 12.1.11.2. Products
- 12.1.11.3. Company Financials
- 12.1.11.4. SWOT Analysis
- 12.1.12 DPD Laser Express Logistics
- 12.1.12.1. Company Overview
- 12.1.12.2. Products
- 12.1.12.3. Company Financials
- 12.1.12.4. SWOT Analysis
- 12.1.13 Value Logistics
- 12.1.13.1. Company Overview
- 12.1.13.2. Products
- 12.1.13.3. Company Financials
- 12.1.13.4. SWOT Analysis
- 12.1.14 DSV
- 12.1.14.1. Company Overview
- 12.1.14.2. Products
- 12.1.14.3. Company Financials
- 12.1.14.4. SWOT Analysis
- 12.1.15 City Logistics
- 12.1.15.1. Company Overview
- 12.1.15.2. Products
- 12.1.15.3. Company Financials
- 12.1.15.4. SWOT Analysis
- 12.1.1 DB Schenker
- 12.2. Market Entropy
- 12.2.1 Company's Key Areas Served
- 12.2.2 Recent Developments
- 12.3. Company Market Share Analysis 2025
- 12.3.1 Top 5 Companies Market Share Analysis
- 12.3.2 Top 3 Companies Market Share Analysis
- 12.4. List of Potential Customers
- 13. Research Methodology
List of Figures
- Figure 1: Global 3PL Industry in South Africa Revenue Breakdown (Million, %) by Region 2025 & 2033
- Figure 2: North America 3PL Industry in South Africa Revenue (Million), by Service 2025 & 2033
- Figure 3: North America 3PL Industry in South Africa Revenue Share (%), by Service 2025 & 2033
- Figure 4: North America 3PL Industry in South Africa Revenue (Million), by End-User 2025 & 2033
- Figure 5: North America 3PL Industry in South Africa Revenue Share (%), by End-User 2025 & 2033
- Figure 6: North America 3PL Industry in South Africa Revenue (Million), by Country 2025 & 2033
- Figure 7: North America 3PL Industry in South Africa Revenue Share (%), by Country 2025 & 2033
- Figure 8: South America 3PL Industry in South Africa Revenue (Million), by Service 2025 & 2033
- Figure 9: South America 3PL Industry in South Africa Revenue Share (%), by Service 2025 & 2033
- Figure 10: South America 3PL Industry in South Africa Revenue (Million), by End-User 2025 & 2033
- Figure 11: South America 3PL Industry in South Africa Revenue Share (%), by End-User 2025 & 2033
- Figure 12: South America 3PL Industry in South Africa Revenue (Million), by Country 2025 & 2033
- Figure 13: South America 3PL Industry in South Africa Revenue Share (%), by Country 2025 & 2033
- Figure 14: Europe 3PL Industry in South Africa Revenue (Million), by Service 2025 & 2033
- Figure 15: Europe 3PL Industry in South Africa Revenue Share (%), by Service 2025 & 2033
- Figure 16: Europe 3PL Industry in South Africa Revenue (Million), by End-User 2025 & 2033
- Figure 17: Europe 3PL Industry in South Africa Revenue Share (%), by End-User 2025 & 2033
- Figure 18: Europe 3PL Industry in South Africa Revenue (Million), by Country 2025 & 2033
- Figure 19: Europe 3PL Industry in South Africa Revenue Share (%), by Country 2025 & 2033
- Figure 20: Middle East & Africa 3PL Industry in South Africa Revenue (Million), by Service 2025 & 2033
- Figure 21: Middle East & Africa 3PL Industry in South Africa Revenue Share (%), by Service 2025 & 2033
- Figure 22: Middle East & Africa 3PL Industry in South Africa Revenue (Million), by End-User 2025 & 2033
- Figure 23: Middle East & Africa 3PL Industry in South Africa Revenue Share (%), by End-User 2025 & 2033
- Figure 24: Middle East & Africa 3PL Industry in South Africa Revenue (Million), by Country 2025 & 2033
- Figure 25: Middle East & Africa 3PL Industry in South Africa Revenue Share (%), by Country 2025 & 2033
- Figure 26: Asia Pacific 3PL Industry in South Africa Revenue (Million), by Service 2025 & 2033
- Figure 27: Asia Pacific 3PL Industry in South Africa Revenue Share (%), by Service 2025 & 2033
- Figure 28: Asia Pacific 3PL Industry in South Africa Revenue (Million), by End-User 2025 & 2033
- Figure 29: Asia Pacific 3PL Industry in South Africa Revenue Share (%), by End-User 2025 & 2033
- Figure 30: Asia Pacific 3PL Industry in South Africa Revenue (Million), by Country 2025 & 2033
- Figure 31: Asia Pacific 3PL Industry in South Africa Revenue Share (%), by Country 2025 & 2033
List of Tables
- Table 1: Global 3PL Industry in South Africa Revenue Million Forecast, by Service 2020 & 2033
- Table 2: Global 3PL Industry in South Africa Revenue Million Forecast, by End-User 2020 & 2033
- Table 3: Global 3PL Industry in South Africa Revenue Million Forecast, by Region 2020 & 2033
- Table 4: Global 3PL Industry in South Africa Revenue Million Forecast, by Service 2020 & 2033
- Table 5: Global 3PL Industry in South Africa Revenue Million Forecast, by End-User 2020 & 2033
- Table 6: Global 3PL Industry in South Africa Revenue Million Forecast, by Country 2020 & 2033
- Table 7: United States 3PL Industry in South Africa Revenue (Million) Forecast, by Application 2020 & 2033
- Table 8: Canada 3PL Industry in South Africa Revenue (Million) Forecast, by Application 2020 & 2033
- Table 9: Mexico 3PL Industry in South Africa Revenue (Million) Forecast, by Application 2020 & 2033
- Table 10: Global 3PL Industry in South Africa Revenue Million Forecast, by Service 2020 & 2033
- Table 11: Global 3PL Industry in South Africa Revenue Million Forecast, by End-User 2020 & 2033
- Table 12: Global 3PL Industry in South Africa Revenue Million Forecast, by Country 2020 & 2033
- Table 13: Brazil 3PL Industry in South Africa Revenue (Million) Forecast, by Application 2020 & 2033
- Table 14: Argentina 3PL Industry in South Africa Revenue (Million) Forecast, by Application 2020 & 2033
- Table 15: Rest of South America 3PL Industry in South Africa Revenue (Million) Forecast, by Application 2020 & 2033
- Table 16: Global 3PL Industry in South Africa Revenue Million Forecast, by Service 2020 & 2033
- Table 17: Global 3PL Industry in South Africa Revenue Million Forecast, by End-User 2020 & 2033
- Table 18: Global 3PL Industry in South Africa Revenue Million Forecast, by Country 2020 & 2033
- Table 19: United Kingdom 3PL Industry in South Africa Revenue (Million) Forecast, by Application 2020 & 2033
- Table 20: Germany 3PL Industry in South Africa Revenue (Million) Forecast, by Application 2020 & 2033
- Table 21: France 3PL Industry in South Africa Revenue (Million) Forecast, by Application 2020 & 2033
- Table 22: Italy 3PL Industry in South Africa Revenue (Million) Forecast, by Application 2020 & 2033
- Table 23: Spain 3PL Industry in South Africa Revenue (Million) Forecast, by Application 2020 & 2033
- Table 24: Russia 3PL Industry in South Africa Revenue (Million) Forecast, by Application 2020 & 2033
- Table 25: Benelux 3PL Industry in South Africa Revenue (Million) Forecast, by Application 2020 & 2033
- Table 26: Nordics 3PL Industry in South Africa Revenue (Million) Forecast, by Application 2020 & 2033
- Table 27: Rest of Europe 3PL Industry in South Africa Revenue (Million) Forecast, by Application 2020 & 2033
- Table 28: Global 3PL Industry in South Africa Revenue Million Forecast, by Service 2020 & 2033
- Table 29: Global 3PL Industry in South Africa Revenue Million Forecast, by End-User 2020 & 2033
- Table 30: Global 3PL Industry in South Africa Revenue Million Forecast, by Country 2020 & 2033
- Table 31: Turkey 3PL Industry in South Africa Revenue (Million) Forecast, by Application 2020 & 2033
- Table 32: Israel 3PL Industry in South Africa Revenue (Million) Forecast, by Application 2020 & 2033
- Table 33: GCC 3PL Industry in South Africa Revenue (Million) Forecast, by Application 2020 & 2033
- Table 34: North Africa 3PL Industry in South Africa Revenue (Million) Forecast, by Application 2020 & 2033
- Table 35: South Africa 3PL Industry in South Africa Revenue (Million) Forecast, by Application 2020 & 2033
- Table 36: Rest of Middle East & Africa 3PL Industry in South Africa Revenue (Million) Forecast, by Application 2020 & 2033
- Table 37: Global 3PL Industry in South Africa Revenue Million Forecast, by Service 2020 & 2033
- Table 38: Global 3PL Industry in South Africa Revenue Million Forecast, by End-User 2020 & 2033
- Table 39: Global 3PL Industry in South Africa Revenue Million Forecast, by Country 2020 & 2033
- Table 40: China 3PL Industry in South Africa Revenue (Million) Forecast, by Application 2020 & 2033
- Table 41: India 3PL Industry in South Africa Revenue (Million) Forecast, by Application 2020 & 2033
- Table 42: Japan 3PL Industry in South Africa Revenue (Million) Forecast, by Application 2020 & 2033
- Table 43: South Korea 3PL Industry in South Africa Revenue (Million) Forecast, by Application 2020 & 2033
- Table 44: ASEAN 3PL Industry in South Africa Revenue (Million) Forecast, by Application 2020 & 2033
- Table 45: Oceania 3PL Industry in South Africa Revenue (Million) Forecast, by Application 2020 & 2033
- Table 46: Rest of Asia Pacific 3PL Industry in South Africa Revenue (Million) Forecast, by Application 2020 & 2033
Frequently Asked Questions
1. What is the projected Compound Annual Growth Rate (CAGR) of the 3PL Industry in South Africa?
The projected CAGR is approximately 6.64%.
2. Which companies are prominent players in the 3PL Industry in South Africa?
Key companies in the market include DB Schenker, OneLogix, DHL, United Parcel Service**List Not Exhaustive, Barloworld Logistics, Vital Distribution, CEVA Logistics, Kuehne + Nagel, Transnova, Bidvest International Logistics, Bollore Logistics, DPD Laser Express Logistics, Value Logistics, DSV, City Logistics.
3. What are the main segments of the 3PL Industry in South Africa?
The market segments include Service, End-User.
4. Can you provide details about the market size?
The market size is estimated to be USD 5.99 Million as of 2022.
5. What are some drivers contributing to market growth?
E-commerce Fueling the Growth of 3PL Market.
6. What are the notable trends driving market growth?
AfCFTA to Increase Intra Regional Trade.
7. Are there any restraints impacting market growth?
Slow Infrastructure Development.
8. Can you provide examples of recent developments in the market?
N/A
9. What pricing options are available for accessing the report?
Pricing options include single-user, multi-user, and enterprise licenses priced at USD 3800, USD 4500, and USD 5800 respectively.
10. Is the market size provided in terms of value or volume?
The market size is provided in terms of value, measured in Million.
11. Are there any specific market keywords associated with the report?
Yes, the market keyword associated with the report is "3PL Industry in South Africa," which aids in identifying and referencing the specific market segment covered.
12. How do I determine which pricing option suits my needs best?
The pricing options vary based on user requirements and access needs. Individual users may opt for single-user licenses, while businesses requiring broader access may choose multi-user or enterprise licenses for cost-effective access to the report.
13. Are there any additional resources or data provided in the 3PL Industry in South Africa report?
While the report offers comprehensive insights, it's advisable to review the specific contents or supplementary materials provided to ascertain if additional resources or data are available.
14. How can I stay updated on further developments or reports in the 3PL Industry in South Africa?
To stay informed about further developments, trends, and reports in the 3PL Industry in South Africa, consider subscribing to industry newsletters, following relevant companies and organizations, or regularly checking reputable industry news sources and publications.
Methodology
Step 1 - Identification of Relevant Samples Size from Population Database


Step 2 - Approaches for Defining Global Market Size (Value, Volume* & Price*)

Note*: In applicable scenarios
Step 3 - Data Sources
Primary Research
- Web Analytics
- Survey Reports
- Research Institute
- Latest Research Reports
- Opinion Leaders
Secondary Research
- Annual Reports
- White Paper
- Latest Press Release
- Industry Association
- Paid Database
- Investor Presentations

Step 4 - Data Triangulation
Involves using different sources of information in order to increase the validity of a study
These sources are likely to be stakeholders in a program - participants, other researchers, program staff, other community members, and so on.
Then we put all data in single framework & apply various statistical tools to find out the dynamic on the market.
During the analysis stage, feedback from the stakeholder groups would be compared to determine areas of agreement as well as areas of divergence