

Key Insights
Chile's Third-Party Logistics (3PL) market is projected to reach $6.03 billion by 2033, expanding at a Compound Annual Growth Rate (CAGR) of 5.89% from the base year 2025. This significant growth is driven by Chile's expanding e-commerce landscape, fueling demand for sophisticated warehousing, distribution, and last-mile delivery. The robust performance of the Fast-Moving Consumer Goods (FMCG) sector, particularly in beauty and personal care, alongside a growing retail presence across hypermarkets and online platforms, are further augmenting 3PL market volume. Escalating global supply chain complexity and the imperative for optimized logistics operations also contribute to this upward trend. While infrastructure constraints and fuel price volatility present potential challenges, the market outlook remains decidedly positive. Service segmentation highlights strong demand for domestic and international transportation management, alongside value-added warehousing and distribution. Leading providers, including Sitrans, DB Schenker, and DHL, are strategically positioned to leverage these opportunities, despite intense competition from a diverse array of local and international 3PL entities.
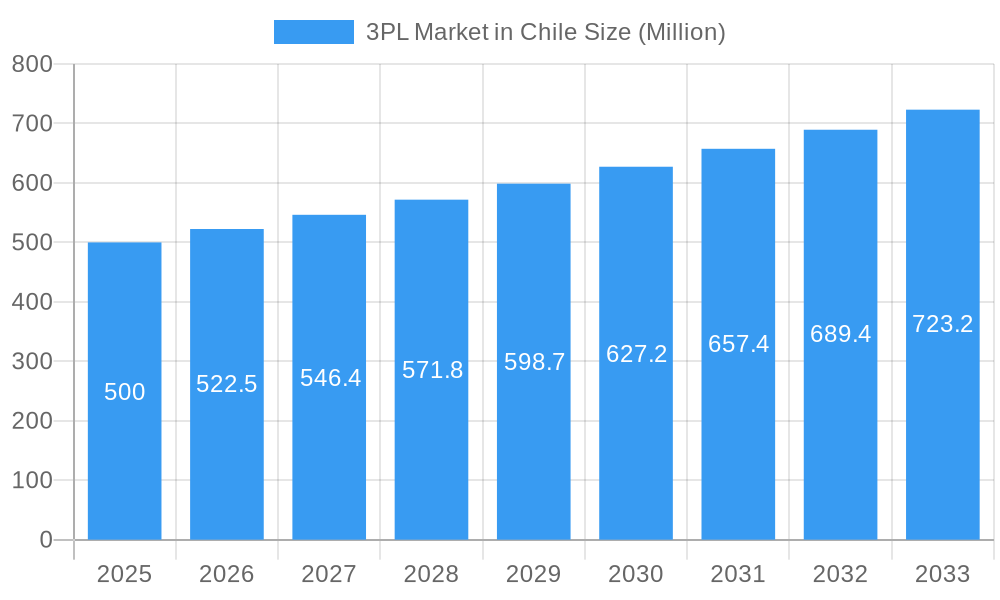
3PL Market in Chile Market Size (In Billion)
The dominance of FMCG, retail, and technology as key end-user segments emphasizes the necessity for tailored logistics solutions. Reefer transportation, essential for the effective handling of perishable goods such as fruits, vegetables, and pharmaceuticals, constitutes a critical niche within the Chilean 3PL market. Industry players are prioritizing technology integration, adopting advanced Warehouse Management Systems (WMS) and Transportation Management Systems (TMS) to boost operational efficiency and supply chain visibility. Sustainable logistics practices are increasingly being adopted, with companies integrating eco-friendly transportation and warehousing methods to meet evolving customer expectations and regulatory requirements. Continued Chilean economic expansion and increased foreign investment are anticipated to further stimulate 3PL market growth, presenting substantial opportunities for both established and new market participants.
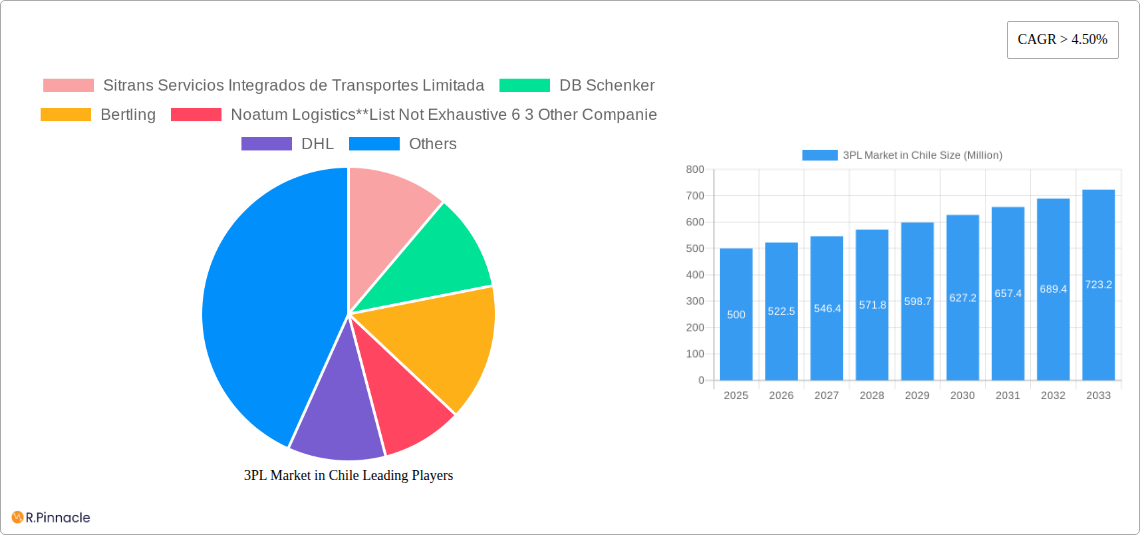
3PL Market in Chile Company Market Share
3PL Market in Chile: A Comprehensive Report (2019-2033)
This in-depth report provides a comprehensive analysis of the 3PL market in Chile, offering invaluable insights for industry professionals, investors, and strategic decision-makers. Covering the period from 2019 to 2033, with a focus on 2025, this report unveils the market's structure, dynamics, key players, and future outlook. The analysis leverages robust data and expert insights to provide actionable intelligence for navigating this dynamic market. The Chilean 3PL market, valued at xx Million in 2025, is projected to experience a CAGR of xx% from 2025 to 2033, reaching xx Million by 2033.
3PL Market in Chile Market Structure & Innovation Trends
The Chilean 3PL market exhibits a moderately concentrated structure, with several large multinational players and a number of smaller, regional companies. Key players include Sitrans Servicios Integrados de Transportes Limitada, DB Schenker, Bertling, Noatum Logistics, DHL, DSV SA, Ceva Logistics, SAAM, Agility Logistics, Agunsa, Andes Logistics, and Megalogistica SA. While precise market share data for each player is unavailable publicly, DHL, DSV, and SAAM are estimated to hold significant market share. Innovation is driven by increasing e-commerce penetration, the need for enhanced supply chain visibility, and the adoption of technological solutions. The regulatory framework, while generally supportive of foreign investment, presents some challenges regarding customs procedures and transportation regulations. The primary product substitutes include in-house logistics operations, but the growing complexity and cost of managing these internally favor the growth of 3PL services. The M&A landscape has seen moderate activity in recent years, with deal values ranging from xx Million to xx Million. Further consolidation is anticipated as larger players seek to expand their market presence and service offerings.
- Market Concentration: Moderately concentrated, with several major players.
- Innovation Drivers: E-commerce growth, need for supply chain visibility, technological advancements.
- Regulatory Framework: Generally supportive but with challenges in customs and transportation.
- Product Substitutes: In-house logistics, but 3PL remains favored due to cost and complexity.
- M&A Activity: Moderate activity observed, with deal values varying.
3PL Market in Chile Market Dynamics & Trends
The Chilean 3PL market is experiencing robust growth fueled by several key factors. The expansion of e-commerce has created a significant demand for efficient warehousing, distribution, and last-mile delivery solutions. Technological advancements, such as the adoption of Warehouse Management Systems (WMS) and Transportation Management Systems (TMS), are enhancing operational efficiency and supply chain visibility. Consumer preferences are shifting towards faster delivery times and greater product choice, further driving the demand for sophisticated 3PL services. The competitive dynamics are marked by intense rivalry among established players and the emergence of new entrants, particularly in niche segments like specialized transportation. Companies are investing heavily in technology and expanding their service portfolios to stay competitive. Market penetration of 3PL services is estimated at xx% in 2025, and is expected to increase significantly over the forecast period.
Dominant Regions & Segments in 3PL Market in Chile
The Santiago Metropolitan Region dominates the Chilean 3PL market, accounting for the largest share of revenue, due to its high population density, significant economic activity, and well-developed infrastructure. Within the service segments, Value-added Warehousing and Distribution are experiencing the fastest growth, driven by the increasing demand for specialized warehousing solutions and customized logistics services. The FMCG sector remains the largest end-user segment, followed by the Retail and Reefer sectors.
Key Drivers of Regional Dominance (Santiago Metropolitan Region):
- High population density.
- Major economic hub.
- Advanced infrastructure.
Key Drivers of Segment Dominance (Value-added Warehousing & Distribution):
- Increasing demand for specialized warehousing.
- Customized logistics solutions.
Key Drivers of Segment Dominance (FMCG):
- High volume of goods movement.
- Stringent supply chain requirements.
Key Drivers of Segment Dominance (Retail):
- Growth of e-commerce and omnichannel strategies.
Key Drivers of Segment Dominance (Reefer):
- Importance of perishable goods exports.
3PL Market in Chile Product Innovations
Recent product innovations focus on improving supply chain visibility through real-time tracking and data analytics, optimizing warehouse operations with advanced automation technologies, and enhancing last-mile delivery efficiency through innovative solutions like drone delivery and micro-fulfillment centers. These innovations cater to the growing demand for greater transparency, speed, and efficiency in the logistics sector.
Report Scope & Segmentation Analysis
This report segments the Chilean 3PL market by service type (Domestic Transportation Management, International Transportation Management, Value-added Warehousing and Distribution) and end-user (FMCG, Retail, Fashion and Lifestyle, Technology, Reefer, Other End Users). Each segment is analyzed based on market size, growth projections, and competitive dynamics. The report provides detailed insights into market trends, opportunities, and challenges within each segment. Growth projections for each segment vary, with Value-added Warehousing and Distribution and the FMCG sector expected to experience the strongest growth.
Key Drivers of 3PL Market in Chile Growth
Several key factors are driving growth in Chile's 3PL market. E-commerce expansion necessitates robust logistics solutions, while technological advancements such as AI and automation enhance efficiency. Government initiatives to improve infrastructure and streamline regulations create a favorable business environment. The growing focus on sustainability in supply chains also fuels demand for eco-friendly logistics solutions.
Challenges in the 3PL Market in Chile Sector
The Chilean 3PL market faces challenges such as infrastructure limitations in certain regions, fluctuating fuel prices impacting transportation costs, and potential labor shortages. Furthermore, navigating complex regulatory environments and managing geopolitical uncertainties add layers of complexity.
Emerging Opportunities in 3PL Market in Chile
Emerging opportunities lie in the expansion of e-commerce, the increasing demand for specialized logistics services for niche sectors, and the adoption of new technologies such as blockchain for enhanced transparency and security. The growing emphasis on sustainable practices presents further opportunities for eco-friendly logistics solutions.
Leading Players in the 3PL Market in Chile Market
- Sitrans Servicios Integrados de Transportes Limitada
- DB Schenker
- Bertling
- Noatum Logistics
- DHL
- DSV SA
- Ceva Logistics
- SAAM
- Agility Logistics
- Agunsa
- Andes Logistics
- Megalogistica SA
Key Developments in 3PL Market in Chile Industry
- July 2023: DHL Supply Chain opens a new distribution center in Pujajuelo, Chile, and expands its presence in Mexico with new warehouses and an EV center.
- September 2022: AGUNSA receives a USD 70 Million sustainability-linked loan from the IFC.
- August 2022: Logistics bottlenecks severely impact Chile's perishable goods exports, highlighting the need for improved efficiency and infrastructure.
Future Outlook for 3PL Market in Chile Market
The Chilean 3PL market is poised for continued growth, driven by e-commerce expansion, technological innovation, and increased demand for sophisticated logistics services. Strategic partnerships, investments in technology, and a focus on sustainability will be crucial for success in this dynamic market.
3PL Market in Chile Segmentation
-
1. Service
- 1.1. Domestic Transportation Management
- 1.2. International Transportation Management
- 1.3. Value-added Warehousing and Distribution
-
2. End User
- 2.1. Automotive and Manufacturing
- 2.2. Oil and Gas
- 2.3. Chemicals
- 2.4. Distribu
- 2.5. Pharmaceutical and Healthcare
- 2.6. Construction
- 2.7. Other End Users
3PL Market in Chile Segmentation By Geography
-
1. North America
- 1.1. United States
- 1.2. Canada
- 1.3. Mexico
-
2. South America
- 2.1. Brazil
- 2.2. Argentina
- 2.3. Rest of South America
-
3. Europe
- 3.1. United Kingdom
- 3.2. Germany
- 3.3. France
- 3.4. Italy
- 3.5. Spain
- 3.6. Russia
- 3.7. Benelux
- 3.8. Nordics
- 3.9. Rest of Europe
-
4. Middle East & Africa
- 4.1. Turkey
- 4.2. Israel
- 4.3. GCC
- 4.4. North Africa
- 4.5. South Africa
- 4.6. Rest of Middle East & Africa
-
5. Asia Pacific
- 5.1. China
- 5.2. India
- 5.3. Japan
- 5.4. South Korea
- 5.5. ASEAN
- 5.6. Oceania
- 5.7. Rest of Asia Pacific
3PL Market in Chile Regional Market Share
Geographic Coverage of 3PL Market in Chile
3PL Market in Chile REPORT HIGHLIGHTS
| Aspects | Details |
|---|---|
| Study Period | 2020-2034 |
| Base Year | 2025 |
| Estimated Year | 2026 |
| Forecast Period | 2026-2034 |
| Historical Period | 2020-2025 |
| Growth Rate | CAGR of 5.89% from 2020-2034 |
| Segmentation |
|
Table of Contents
- 1. Introduction
- 1.1. Research Scope
- 1.2. Market Segmentation
- 1.3. Research Objective
- 1.4. Definitions and Assumptions
- 2. Executive Summary
- 2.1. Market Snapshot
- 3. Market Dynamics
- 3.1. Market Drivers
- 3.2. Market Restrains
- 3.3. Market Trends
- 3.4. Market Opportunities
- 4. Market Factor Analysis
- 4.1. Porters Five Forces
- 4.1.1. Bargaining Power of Suppliers
- 4.1.2. Bargaining Power of Buyers
- 4.1.3. Threat of New Entrants
- 4.1.4. Threat of Substitutes
- 4.1.5. Competitive Rivalry
- 4.2. PESTEL analysis
- 4.3. BCG Analysis
- 4.3.1. Stars (High Growth, High Market Share)
- 4.3.2. Cash Cows (Low Growth, High Market Share)
- 4.3.3. Question Mark (High Growth, Low Market Share)
- 4.3.4. Dogs (Low Growth, Low Market Share)
- 4.4. Ansoff Matrix Analysis
- 4.5. Supply Chain Analysis
- 4.6. Regulatory Landscape
- 4.7. Current Market Potential and Opportunity Assessment (TAM–SAM–SOM Framework)
- 4.8. PRI Analyst Note
- 4.1. Porters Five Forces
- 5. Market Analysis, Insights and Forecast 2021-2033
- 5.1. Market Analysis, Insights and Forecast - by Service
- 5.1.1. Domestic Transportation Management
- 5.1.2. International Transportation Management
- 5.1.3. Value-added Warehousing and Distribution
- 5.2. Market Analysis, Insights and Forecast - by End User
- 5.2.1. Automotive and Manufacturing
- 5.2.2. Oil and Gas
- 5.2.3. Chemicals
- 5.2.4. Distribu
- 5.2.5. Pharmaceutical and Healthcare
- 5.2.6. Construction
- 5.2.7. Other End Users
- 5.3. Market Analysis, Insights and Forecast - by Region
- 5.3.1. North America
- 5.3.2. South America
- 5.3.3. Europe
- 5.3.4. Middle East & Africa
- 5.3.5. Asia Pacific
- 5.1. Market Analysis, Insights and Forecast - by Service
- 6. Global 3PL Market in Chile Analysis, Insights and Forecast, 2021-2033
- 6.1. Market Analysis, Insights and Forecast - by Service
- 6.1.1. Domestic Transportation Management
- 6.1.2. International Transportation Management
- 6.1.3. Value-added Warehousing and Distribution
- 6.2. Market Analysis, Insights and Forecast - by End User
- 6.2.1. Automotive and Manufacturing
- 6.2.2. Oil and Gas
- 6.2.3. Chemicals
- 6.2.4. Distribu
- 6.2.5. Pharmaceutical and Healthcare
- 6.2.6. Construction
- 6.2.7. Other End Users
- 6.1. Market Analysis, Insights and Forecast - by Service
- 7. North America 3PL Market in Chile Analysis, Insights and Forecast, 2020-2032
- 7.1. Market Analysis, Insights and Forecast - by Service
- 7.1.1. Domestic Transportation Management
- 7.1.2. International Transportation Management
- 7.1.3. Value-added Warehousing and Distribution
- 7.2. Market Analysis, Insights and Forecast - by End User
- 7.2.1. Automotive and Manufacturing
- 7.2.2. Oil and Gas
- 7.2.3. Chemicals
- 7.2.4. Distribu
- 7.2.5. Pharmaceutical and Healthcare
- 7.2.6. Construction
- 7.2.7. Other End Users
- 7.1. Market Analysis, Insights and Forecast - by Service
- 8. South America 3PL Market in Chile Analysis, Insights and Forecast, 2020-2032
- 8.1. Market Analysis, Insights and Forecast - by Service
- 8.1.1. Domestic Transportation Management
- 8.1.2. International Transportation Management
- 8.1.3. Value-added Warehousing and Distribution
- 8.2. Market Analysis, Insights and Forecast - by End User
- 8.2.1. Automotive and Manufacturing
- 8.2.2. Oil and Gas
- 8.2.3. Chemicals
- 8.2.4. Distribu
- 8.2.5. Pharmaceutical and Healthcare
- 8.2.6. Construction
- 8.2.7. Other End Users
- 8.1. Market Analysis, Insights and Forecast - by Service
- 9. Europe 3PL Market in Chile Analysis, Insights and Forecast, 2020-2032
- 9.1. Market Analysis, Insights and Forecast - by Service
- 9.1.1. Domestic Transportation Management
- 9.1.2. International Transportation Management
- 9.1.3. Value-added Warehousing and Distribution
- 9.2. Market Analysis, Insights and Forecast - by End User
- 9.2.1. Automotive and Manufacturing
- 9.2.2. Oil and Gas
- 9.2.3. Chemicals
- 9.2.4. Distribu
- 9.2.5. Pharmaceutical and Healthcare
- 9.2.6. Construction
- 9.2.7. Other End Users
- 9.1. Market Analysis, Insights and Forecast - by Service
- 10. Middle East & Africa 3PL Market in Chile Analysis, Insights and Forecast, 2020-2032
- 10.1. Market Analysis, Insights and Forecast - by Service
- 10.1.1. Domestic Transportation Management
- 10.1.2. International Transportation Management
- 10.1.3. Value-added Warehousing and Distribution
- 10.2. Market Analysis, Insights and Forecast - by End User
- 10.2.1. Automotive and Manufacturing
- 10.2.2. Oil and Gas
- 10.2.3. Chemicals
- 10.2.4. Distribu
- 10.2.5. Pharmaceutical and Healthcare
- 10.2.6. Construction
- 10.2.7. Other End Users
- 10.1. Market Analysis, Insights and Forecast - by Service
- 11. Asia Pacific 3PL Market in Chile Analysis, Insights and Forecast, 2020-2032
- 11.1. Market Analysis, Insights and Forecast - by Service
- 11.1.1. Domestic Transportation Management
- 11.1.2. International Transportation Management
- 11.1.3. Value-added Warehousing and Distribution
- 11.2. Market Analysis, Insights and Forecast - by End User
- 11.2.1. Automotive and Manufacturing
- 11.2.2. Oil and Gas
- 11.2.3. Chemicals
- 11.2.4. Distribu
- 11.2.5. Pharmaceutical and Healthcare
- 11.2.6. Construction
- 11.2.7. Other End Users
- 11.1. Market Analysis, Insights and Forecast - by Service
- 12. Competitive Analysis
- 12.1. Company Profiles
- 12.1.1 Sitrans Servicios Integrados de Transportes Limitada
- 12.1.1.1. Company Overview
- 12.1.1.2. Products
- 12.1.1.3. Company Financials
- 12.1.1.4. SWOT Analysis
- 12.1.2 DB Schenker
- 12.1.2.1. Company Overview
- 12.1.2.2. Products
- 12.1.2.3. Company Financials
- 12.1.2.4. SWOT Analysis
- 12.1.3 Bertling
- 12.1.3.1. Company Overview
- 12.1.3.2. Products
- 12.1.3.3. Company Financials
- 12.1.3.4. SWOT Analysis
- 12.1.4 Noatum Logistics**List Not Exhaustive 6 3 Other Companie
- 12.1.4.1. Company Overview
- 12.1.4.2. Products
- 12.1.4.3. Company Financials
- 12.1.4.4. SWOT Analysis
- 12.1.5 DHL
- 12.1.5.1. Company Overview
- 12.1.5.2. Products
- 12.1.5.3. Company Financials
- 12.1.5.4. SWOT Analysis
- 12.1.6 DSV SA
- 12.1.6.1. Company Overview
- 12.1.6.2. Products
- 12.1.6.3. Company Financials
- 12.1.6.4. SWOT Analysis
- 12.1.7 Ceva Logistics
- 12.1.7.1. Company Overview
- 12.1.7.2. Products
- 12.1.7.3. Company Financials
- 12.1.7.4. SWOT Analysis
- 12.1.8 SAAM
- 12.1.8.1. Company Overview
- 12.1.8.2. Products
- 12.1.8.3. Company Financials
- 12.1.8.4. SWOT Analysis
- 12.1.9 Agility Logistics
- 12.1.9.1. Company Overview
- 12.1.9.2. Products
- 12.1.9.3. Company Financials
- 12.1.9.4. SWOT Analysis
- 12.1.10 Agunsa
- 12.1.10.1. Company Overview
- 12.1.10.2. Products
- 12.1.10.3. Company Financials
- 12.1.10.4. SWOT Analysis
- 12.1.11 Andes Logistics
- 12.1.11.1. Company Overview
- 12.1.11.2. Products
- 12.1.11.3. Company Financials
- 12.1.11.4. SWOT Analysis
- 12.1.12 Megalogistica SA
- 12.1.12.1. Company Overview
- 12.1.12.2. Products
- 12.1.12.3. Company Financials
- 12.1.12.4. SWOT Analysis
- 12.1.1 Sitrans Servicios Integrados de Transportes Limitada
- 12.2. Market Entropy
- 12.2.1 Company's Key Areas Served
- 12.2.2 Recent Developments
- 12.3. Company Market Share Analysis 2025
- 12.3.1 Top 5 Companies Market Share Analysis
- 12.3.2 Top 3 Companies Market Share Analysis
- 12.4. List of Potential Customers
- 13. Research Methodology
List of Figures
- Figure 1: Global 3PL Market in Chile Revenue Breakdown (billion, %) by Region 2025 & 2033
- Figure 2: North America 3PL Market in Chile Revenue (billion), by Service 2025 & 2033
- Figure 3: North America 3PL Market in Chile Revenue Share (%), by Service 2025 & 2033
- Figure 4: North America 3PL Market in Chile Revenue (billion), by End User 2025 & 2033
- Figure 5: North America 3PL Market in Chile Revenue Share (%), by End User 2025 & 2033
- Figure 6: North America 3PL Market in Chile Revenue (billion), by Country 2025 & 2033
- Figure 7: North America 3PL Market in Chile Revenue Share (%), by Country 2025 & 2033
- Figure 8: South America 3PL Market in Chile Revenue (billion), by Service 2025 & 2033
- Figure 9: South America 3PL Market in Chile Revenue Share (%), by Service 2025 & 2033
- Figure 10: South America 3PL Market in Chile Revenue (billion), by End User 2025 & 2033
- Figure 11: South America 3PL Market in Chile Revenue Share (%), by End User 2025 & 2033
- Figure 12: South America 3PL Market in Chile Revenue (billion), by Country 2025 & 2033
- Figure 13: South America 3PL Market in Chile Revenue Share (%), by Country 2025 & 2033
- Figure 14: Europe 3PL Market in Chile Revenue (billion), by Service 2025 & 2033
- Figure 15: Europe 3PL Market in Chile Revenue Share (%), by Service 2025 & 2033
- Figure 16: Europe 3PL Market in Chile Revenue (billion), by End User 2025 & 2033
- Figure 17: Europe 3PL Market in Chile Revenue Share (%), by End User 2025 & 2033
- Figure 18: Europe 3PL Market in Chile Revenue (billion), by Country 2025 & 2033
- Figure 19: Europe 3PL Market in Chile Revenue Share (%), by Country 2025 & 2033
- Figure 20: Middle East & Africa 3PL Market in Chile Revenue (billion), by Service 2025 & 2033
- Figure 21: Middle East & Africa 3PL Market in Chile Revenue Share (%), by Service 2025 & 2033
- Figure 22: Middle East & Africa 3PL Market in Chile Revenue (billion), by End User 2025 & 2033
- Figure 23: Middle East & Africa 3PL Market in Chile Revenue Share (%), by End User 2025 & 2033
- Figure 24: Middle East & Africa 3PL Market in Chile Revenue (billion), by Country 2025 & 2033
- Figure 25: Middle East & Africa 3PL Market in Chile Revenue Share (%), by Country 2025 & 2033
- Figure 26: Asia Pacific 3PL Market in Chile Revenue (billion), by Service 2025 & 2033
- Figure 27: Asia Pacific 3PL Market in Chile Revenue Share (%), by Service 2025 & 2033
- Figure 28: Asia Pacific 3PL Market in Chile Revenue (billion), by End User 2025 & 2033
- Figure 29: Asia Pacific 3PL Market in Chile Revenue Share (%), by End User 2025 & 2033
- Figure 30: Asia Pacific 3PL Market in Chile Revenue (billion), by Country 2025 & 2033
- Figure 31: Asia Pacific 3PL Market in Chile Revenue Share (%), by Country 2025 & 2033
List of Tables
- Table 1: Global 3PL Market in Chile Revenue billion Forecast, by Service 2020 & 2033
- Table 2: Global 3PL Market in Chile Revenue billion Forecast, by End User 2020 & 2033
- Table 3: Global 3PL Market in Chile Revenue billion Forecast, by Region 2020 & 2033
- Table 4: Global 3PL Market in Chile Revenue billion Forecast, by Service 2020 & 2033
- Table 5: Global 3PL Market in Chile Revenue billion Forecast, by End User 2020 & 2033
- Table 6: Global 3PL Market in Chile Revenue billion Forecast, by Country 2020 & 2033
- Table 7: United States 3PL Market in Chile Revenue (billion) Forecast, by Application 2020 & 2033
- Table 8: Canada 3PL Market in Chile Revenue (billion) Forecast, by Application 2020 & 2033
- Table 9: Mexico 3PL Market in Chile Revenue (billion) Forecast, by Application 2020 & 2033
- Table 10: Global 3PL Market in Chile Revenue billion Forecast, by Service 2020 & 2033
- Table 11: Global 3PL Market in Chile Revenue billion Forecast, by End User 2020 & 2033
- Table 12: Global 3PL Market in Chile Revenue billion Forecast, by Country 2020 & 2033
- Table 13: Brazil 3PL Market in Chile Revenue (billion) Forecast, by Application 2020 & 2033
- Table 14: Argentina 3PL Market in Chile Revenue (billion) Forecast, by Application 2020 & 2033
- Table 15: Rest of South America 3PL Market in Chile Revenue (billion) Forecast, by Application 2020 & 2033
- Table 16: Global 3PL Market in Chile Revenue billion Forecast, by Service 2020 & 2033
- Table 17: Global 3PL Market in Chile Revenue billion Forecast, by End User 2020 & 2033
- Table 18: Global 3PL Market in Chile Revenue billion Forecast, by Country 2020 & 2033
- Table 19: United Kingdom 3PL Market in Chile Revenue (billion) Forecast, by Application 2020 & 2033
- Table 20: Germany 3PL Market in Chile Revenue (billion) Forecast, by Application 2020 & 2033
- Table 21: France 3PL Market in Chile Revenue (billion) Forecast, by Application 2020 & 2033
- Table 22: Italy 3PL Market in Chile Revenue (billion) Forecast, by Application 2020 & 2033
- Table 23: Spain 3PL Market in Chile Revenue (billion) Forecast, by Application 2020 & 2033
- Table 24: Russia 3PL Market in Chile Revenue (billion) Forecast, by Application 2020 & 2033
- Table 25: Benelux 3PL Market in Chile Revenue (billion) Forecast, by Application 2020 & 2033
- Table 26: Nordics 3PL Market in Chile Revenue (billion) Forecast, by Application 2020 & 2033
- Table 27: Rest of Europe 3PL Market in Chile Revenue (billion) Forecast, by Application 2020 & 2033
- Table 28: Global 3PL Market in Chile Revenue billion Forecast, by Service 2020 & 2033
- Table 29: Global 3PL Market in Chile Revenue billion Forecast, by End User 2020 & 2033
- Table 30: Global 3PL Market in Chile Revenue billion Forecast, by Country 2020 & 2033
- Table 31: Turkey 3PL Market in Chile Revenue (billion) Forecast, by Application 2020 & 2033
- Table 32: Israel 3PL Market in Chile Revenue (billion) Forecast, by Application 2020 & 2033
- Table 33: GCC 3PL Market in Chile Revenue (billion) Forecast, by Application 2020 & 2033
- Table 34: North Africa 3PL Market in Chile Revenue (billion) Forecast, by Application 2020 & 2033
- Table 35: South Africa 3PL Market in Chile Revenue (billion) Forecast, by Application 2020 & 2033
- Table 36: Rest of Middle East & Africa 3PL Market in Chile Revenue (billion) Forecast, by Application 2020 & 2033
- Table 37: Global 3PL Market in Chile Revenue billion Forecast, by Service 2020 & 2033
- Table 38: Global 3PL Market in Chile Revenue billion Forecast, by End User 2020 & 2033
- Table 39: Global 3PL Market in Chile Revenue billion Forecast, by Country 2020 & 2033
- Table 40: China 3PL Market in Chile Revenue (billion) Forecast, by Application 2020 & 2033
- Table 41: India 3PL Market in Chile Revenue (billion) Forecast, by Application 2020 & 2033
- Table 42: Japan 3PL Market in Chile Revenue (billion) Forecast, by Application 2020 & 2033
- Table 43: South Korea 3PL Market in Chile Revenue (billion) Forecast, by Application 2020 & 2033
- Table 44: ASEAN 3PL Market in Chile Revenue (billion) Forecast, by Application 2020 & 2033
- Table 45: Oceania 3PL Market in Chile Revenue (billion) Forecast, by Application 2020 & 2033
- Table 46: Rest of Asia Pacific 3PL Market in Chile Revenue (billion) Forecast, by Application 2020 & 2033
Frequently Asked Questions
1. What is the projected Compound Annual Growth Rate (CAGR) of the 3PL Market in Chile?
The projected CAGR is approximately 5.89%.
2. Which companies are prominent players in the 3PL Market in Chile?
Key companies in the market include Sitrans Servicios Integrados de Transportes Limitada, DB Schenker, Bertling, Noatum Logistics**List Not Exhaustive 6 3 Other Companie, DHL, DSV SA, Ceva Logistics, SAAM, Agility Logistics, Agunsa, Andes Logistics, Megalogistica SA.
3. What are the main segments of the 3PL Market in Chile?
The market segments include Service, End User.
4. Can you provide details about the market size?
The market size is estimated to be USD 6.03 billion as of 2022.
5. What are some drivers contributing to market growth?
4.; Rise in E-commerce4.; Sustainable delivery options will be in demand.
6. What are the notable trends driving market growth?
The E-commerce Industry is Driving the Market.
7. Are there any restraints impacting market growth?
4.; Lack of Skilled Labor4.; Supply Chain Disruptions.
8. Can you provide examples of recent developments in the market?
July 2023: DHL Supply Chain in Chile announced the opening of a new distribution center in the town of Pujajuelo. In Mexico, where demand is high because of the trend to bring supply closer to the sales markets in North America, DHL is expanding its presence with the opening of new warehouses in the city of Tijuana and the city of Monterrey. In Mexico, DHL is opening a campus in the state of Oaxaca that will cater to the needs of the following sectors: e-commerce; retail; fashion; consumer; medical devices; aerospace; electronics; and automotive. DHL supply chain Mexico also opened an electric vehicle (EV) center in Oaxaca. The objective of this EV center is synergy with the automotive sector in the region.
9. What pricing options are available for accessing the report?
Pricing options include single-user, multi-user, and enterprise licenses priced at USD 3800, USD 4500, and USD 5800 respectively.
10. Is the market size provided in terms of value or volume?
The market size is provided in terms of value, measured in billion.
11. Are there any specific market keywords associated with the report?
Yes, the market keyword associated with the report is "3PL Market in Chile," which aids in identifying and referencing the specific market segment covered.
12. How do I determine which pricing option suits my needs best?
The pricing options vary based on user requirements and access needs. Individual users may opt for single-user licenses, while businesses requiring broader access may choose multi-user or enterprise licenses for cost-effective access to the report.
13. Are there any additional resources or data provided in the 3PL Market in Chile report?
While the report offers comprehensive insights, it's advisable to review the specific contents or supplementary materials provided to ascertain if additional resources or data are available.
14. How can I stay updated on further developments or reports in the 3PL Market in Chile?
To stay informed about further developments, trends, and reports in the 3PL Market in Chile, consider subscribing to industry newsletters, following relevant companies and organizations, or regularly checking reputable industry news sources and publications.
Methodology
Step 1 - Identification of Relevant Samples Size from Population Database


Step 2 - Approaches for Defining Global Market Size (Value, Volume* & Price*)

Note*: In applicable scenarios
Step 3 - Data Sources
Primary Research
- Web Analytics
- Survey Reports
- Research Institute
- Latest Research Reports
- Opinion Leaders
Secondary Research
- Annual Reports
- White Paper
- Latest Press Release
- Industry Association
- Paid Database
- Investor Presentations

Step 4 - Data Triangulation
Involves using different sources of information in order to increase the validity of a study
These sources are likely to be stakeholders in a program - participants, other researchers, program staff, other community members, and so on.
Then we put all data in single framework & apply various statistical tools to find out the dynamic on the market.
During the analysis stage, feedback from the stakeholder groups would be compared to determine areas of agreement as well as areas of divergence