


Key Insights into the 5G RedCap Chip Market
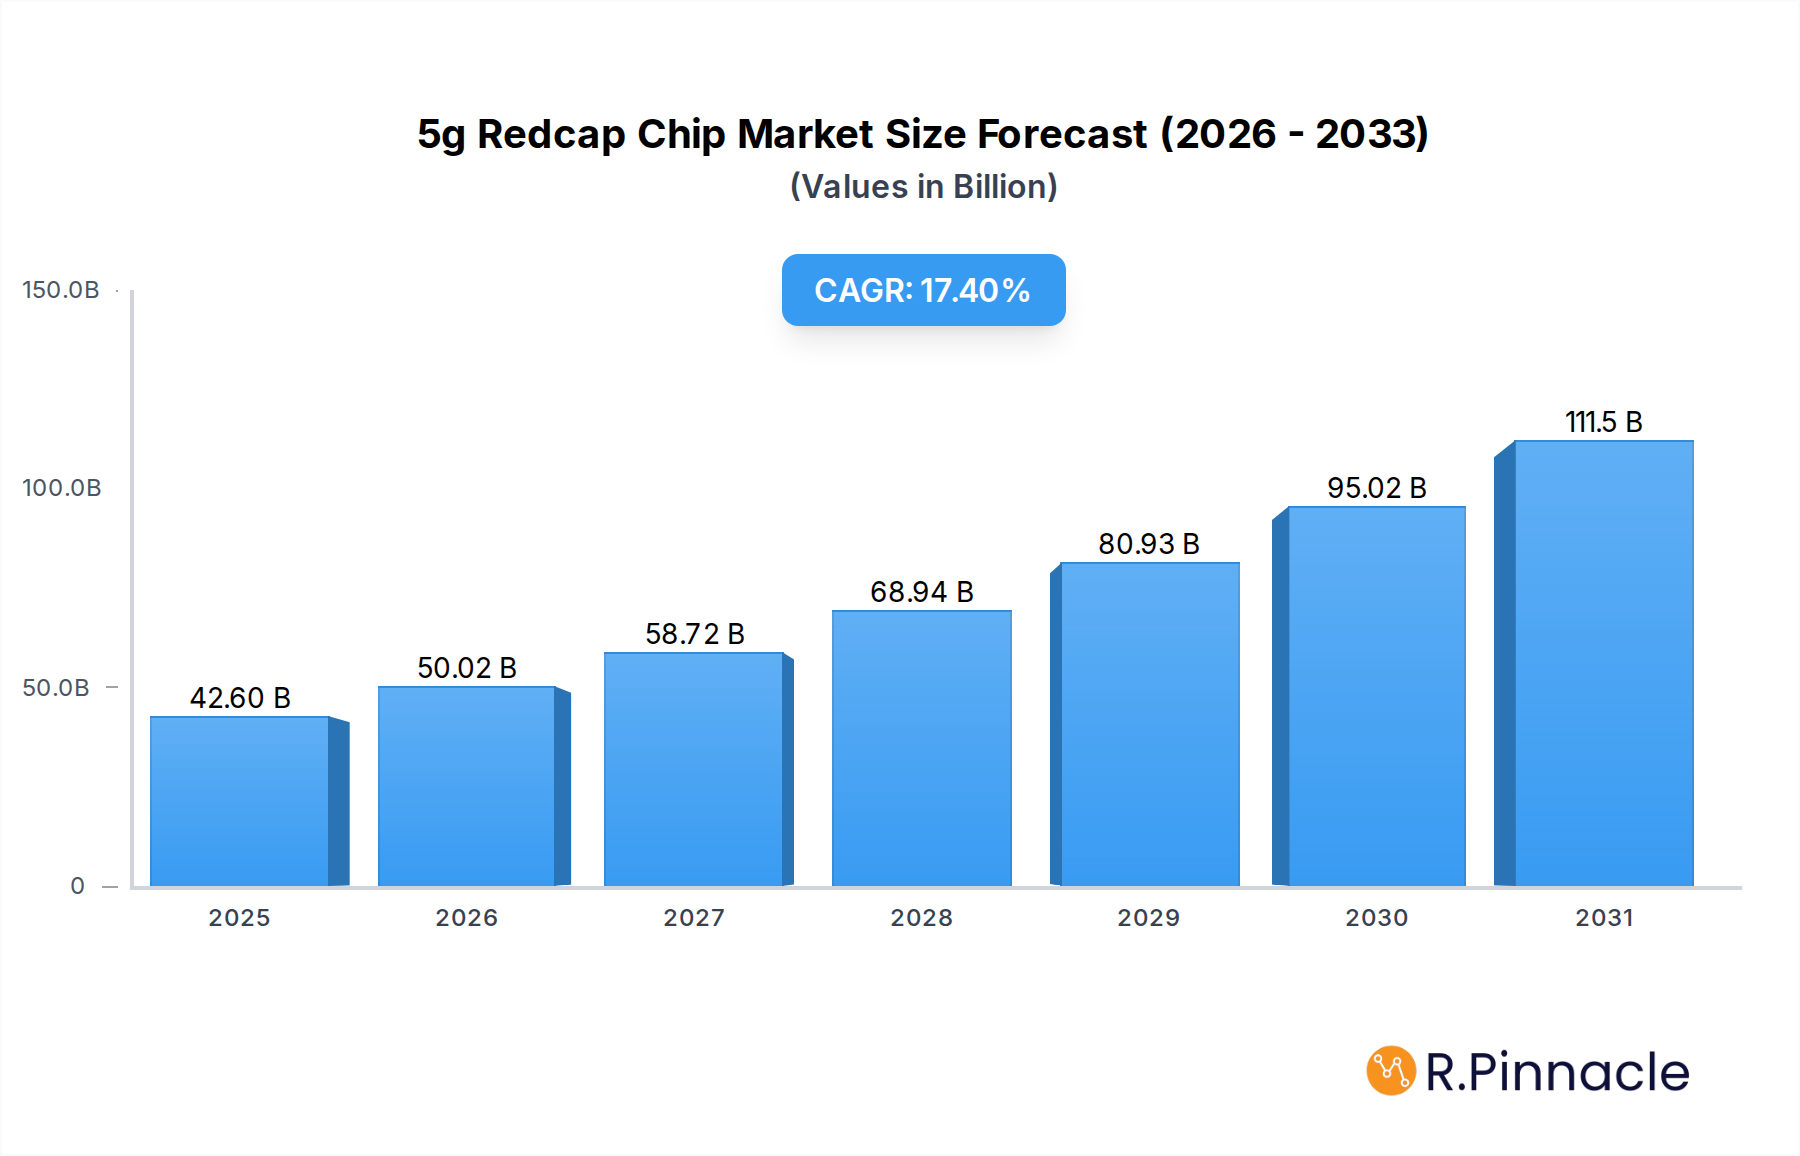
The global 5G RedCap Chip Market is currently valued at an estimated $7.31 billion in 2023, demonstrating its foundational role in the evolving landscape of 5G-enabled Internet of Things (IoT) applications. This market is poised for robust expansion, projected to reach $36.29 billion by 2033, exhibiting an impressive Compound Annual Growth Rate (CAGR) of 17.4% during the forecast period. This significant growth trajectory is primarily fueled by the increasing demand for optimized 5G connectivity solutions that bridge the gap between high-bandwidth 5G eMBB (enhanced Mobile Broadband) and low-power LPWAN (Low-Power Wide-Area Network) technologies. RedCap (Reduced Capability) chips are specifically designed to offer a balance of performance, power efficiency, and cost-effectiveness, making them ideal for a wide array of mid-tier IoT devices.
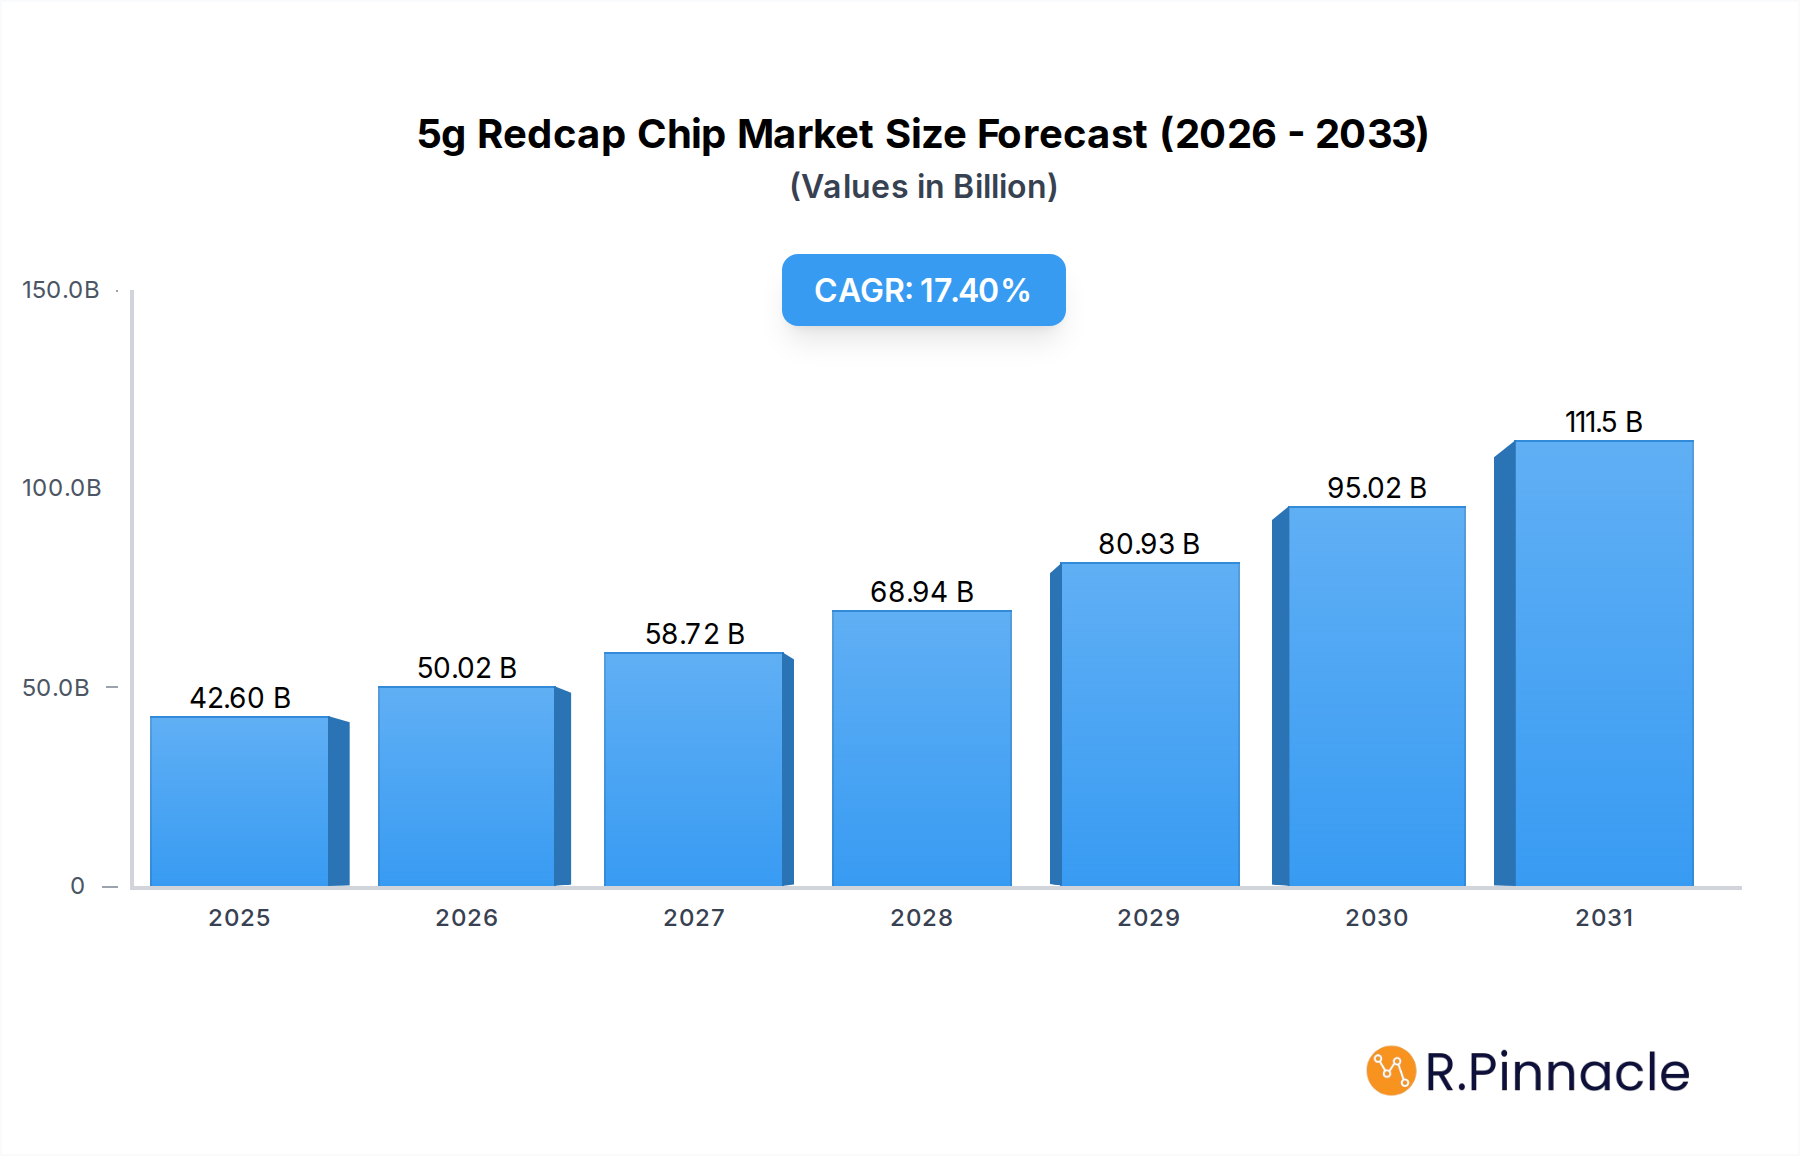
5g Redcap Chip Market Size (In Billion)

Key demand drivers include the escalating deployment of 5G networks worldwide, which provides the necessary infrastructure for RedCap devices to operate. The proliferation of diverse IoT applications across consumer electronics, industrial automation, and smart infrastructure further propels market expansion. Macro tailwinds such as global digital transformation initiatives, the growing adoption of Industry 4.0 paradigms, and the increasing need for reliable and secure wireless connectivity for mission-critical applications are profoundly influencing market dynamics. Furthermore, the inherent advantages of RedCap, such as extended battery life, reduced device complexity, and lower module costs compared to full-fledged 5G, are accelerating its integration into new product categories. The market outlook remains exceptionally positive, driven by continuous innovation in chip design and the broadening ecosystem support from network operators and module manufacturers, all contributing to a vibrant IoT Connectivity Market. As enterprises and consumers seek more efficient and scalable IoT solutions, the 5G RedCap Chip Market is expected to become a cornerstone of the next wave of connected devices, underscoring its pivotal role in enabling a truly ubiquitous 5G IoT landscape.
5g Redcap Chip Company Market Share
Dominant Application Segment Analysis in the 5G RedCap Chip Market
Within the application landscape of the 5G RedCap Chip Market, the combined segment of Routers & Gateways and Customer Premises Equipment (CPE) stands out as the dominant force, commanding a significant revenue share. This segment’s supremacy is rooted in its critical role in enabling the foundational connectivity for both residential and enterprise 5G deployments. RedCap-enabled routers and gateways serve as essential interfaces, providing localized 5G access and facilitating the aggregation of data from numerous IoT devices. They are instrumental in extending 5G coverage indoors and in environments where direct device-to-network connection might be suboptimal or require enhanced signal stability.
The dominance of this segment is driven by several factors. Firstly, the rapid global rollout of 5G infrastructure necessitates robust CPE solutions to translate high-speed 5G cellular signals into usable Wi-Fi or wired connections for homes and businesses. RedCap chips offer a compelling value proposition here, delivering sufficient bandwidth for many fixed wireless access (FWA) scenarios while benefiting from lower power consumption and reduced bill-of-materials costs compared to full-capability 5G modems. This makes RedCap a commercially viable option for broad-scale CPE deployment, particularly in urban and suburban areas where 5G penetration is high.
Secondly, the increasing sophistication of industrial IoT (IIoT) applications further bolsters the demand for RedCap-powered gateways. In smart factories, logistics hubs, and connected agricultural settings, these gateways act as central communication points, collecting data from various sensors, machines, and autonomous vehicles and relaying it to cloud platforms. The inherent reliability and security features of cellular connectivity, now augmented by RedCap's efficiency, make it a preferred choice over traditional Wi-Fi or wired solutions for these critical environments. The ability of RedCap to support a substantial number of connections with optimized data rates and latency profiles aligns perfectly with the requirements of complex industrial ecosystems.
Thirdly, the expansion of the broader Cellular IoT Market is directly contributing to this segment's growth. As more devices become connected, the demand for intermediate network components like routers and gateways that can efficiently manage these connections using reduced capability chips grows in tandem. This segment's share is expected to remain dominant, fueled by continued investment in 5G network expansion, the increasing push for fixed wireless access as an alternative to fiber, and the ongoing digital transformation efforts across industries that rely heavily on robust, localized 5G connectivity. The Single Mode Chip Market and the Dual Mode Chip Market within RedCap are both seeing significant adoption in these gateway and CPE applications, with single mode chips often favored for cost-sensitive, dedicated functions and dual mode offering flexibility for broader deployment scenarios.
Key Market Drivers and Constraints in the 5G RedCap Chip Market
The 5G RedCap Chip Market is influenced by a confluence of drivers and constraints that shape its growth trajectory and adoption patterns. A primary driver is the cost-effectiveness and power efficiency inherent to RedCap technology. By reducing the number of antennas, bandwidth, and processing requirements compared to full-fledged 5G new radio (NR) modems, RedCap chips offer a significantly lower hardware cost and consume less power. This extends battery life for devices, making them ideal for applications like remote sensors in the Smart Metering Market or compact devices within the Wearables Market, where frequent charging is undesirable. For instance, the reduced power profile enables multi-year battery life, a critical factor for utility companies deploying smart grids or consumer device manufacturers aiming for enhanced user experience.
Another significant driver is the expansion of 5G network infrastructure globally. As mobile network operators (MNOs) continue to deploy 5G standalone (SA) networks, the ecosystem for RedCap devices matures. The availability of widespread 5G coverage provides the necessary foundation for RedCap modules to operate efficiently, fostering confidence among device manufacturers and end-users. The projected global 5G subscriber base growth acts as a direct catalyst for increased RedCap chip deployments, as more sectors seek to leverage enhanced cellular connectivity.
However, the market faces notable constraints, including competition from established IoT connectivity technologies. Low-Power Wide-Area Network (LPWAN) solutions like NB-IoT and LTE-M have a head start, with extensive deployments and a mature ecosystem for various low-bandwidth IoT applications. While RedCap offers higher data rates and lower latency, the cost-sensitive nature of many IoT deployments means that existing LPWAN solutions often remain competitive for specific use cases, posing a challenge for RedCap's market penetration. The need to justify the additional cost and complexity, even reduced, compared to these alternatives is a key hurdle. Furthermore, the nascent state of full RedCap ecosystem maturity remains a constraint. While 3GPP Release 17 defines RedCap, broader adoption requires comprehensive support across chipsets, modules, network functions, and regulatory certifications, which is still evolving compared to more established cellular technologies. This ecosystem development requires significant investment within the Telecommunications Equipment Market, which can slow down widespread implementation in the short term.
Competitive Ecosystem of the 5G RedCap Chip Market
The 5G RedCap Chip Market is characterized by intense competition among leading semiconductor and telecommunications firms striving to capture market share in this rapidly expanding segment of the Cellular IoT Market. Key players are investing heavily in R&D to develop power-efficient and cost-effective chip solutions.
- Qualcomm Technologies, Inc.: A dominant player in the broader mobile chipset and Semiconductor Chip Market, Qualcomm is leveraging its extensive expertise in 5G to offer comprehensive RedCap solutions, aiming to extend its leadership into the mid-tier IoT segment.
- MediaTek Inc.: Known for its competitive and integrated system-on-chip (SoC) solutions, MediaTek is focusing on delivering highly integrated and energy-efficient RedCap chipsets to cater to a wide range of IoT devices, particularly those in the consumer electronics and industrial IoT sectors.
- Samsung Electronics Co., Ltd.: As a global technology conglomerate, Samsung contributes to the RedCap market through its semiconductor manufacturing capabilities and its interest in integrating RedCap into its own diverse portfolio of connected devices and network solutions.
- UNISOC Communications Inc.: A key player in the Chinese semiconductor industry, UNISOC is developing cost-effective RedCap chipsets, targeting the burgeoning domestic and emerging market demand for 5G IoT applications.
- Sequans Communications S.A.: Specializing in 4G and 5G cellular IoT chipsets, Sequans is a dedicated innovator in low-power wide-area network (LPWAN) technologies, positioning its RedCap offerings to capture demand for efficient, mid-speed IoT connectivity.
- ASR Microelectronics Co., Ltd.: An emerging force in the semiconductor industry, ASR Microelectronics is focusing on integrating cellular connectivity solutions, including RedCap, into its portfolio to serve the growing demand for cost-optimized IoT modules.
- Huawei Technologies Co., Ltd.: Despite geopolitical challenges, Huawei continues to be a significant contributor to 5G technology, including RedCap, through its extensive research and development in chip design and telecommunications infrastructure.
- Intel Corporation: While pivoting its primary focus in the mobile modem space, Intel maintains a presence in cellular technologies, exploring strategic opportunities for RedCap in industrial and enterprise IoT applications that align with its broader computing and data center strategies.
- Nokia Corporation: As a major Telecommunications Equipment Market vendor, Nokia's involvement in the RedCap ecosystem primarily revolves around ensuring network compatibility and supporting the deployment of RedCap-enabled devices on its 5G infrastructure.
- Telefonaktiebolaget LM Ericsson: Similar to Nokia, Ericsson plays a crucial role in enabling the RedCap ecosystem by providing network infrastructure and software solutions that support RedCap devices, facilitating widespread adoption for its operator customers.
Recent Developments & Milestones in the 5G RedCap Chip Market
Recent developments in the 5G RedCap Chip Market underscore the rapid progression towards commercialization and widespread adoption across various IoT segments. These milestones reflect strategic collaborations, product launches, and continuous advancements in cellular technology standards.
- May 2023: Qualcomm Technologies announced the commercial availability of its first RedCap modem-RF system, designed to accelerate the adoption of 5G in mid-tier IoT devices, supporting both Sub-6 GHz and mmWave frequencies for enhanced flexibility.
- July 2023: MediaTek showcased its initial RedCap chipset samples, emphasizing highly integrated solutions aimed at reducing power consumption and module costs for applications ranging from industrial sensors to smart home devices, highlighting their commitment to the IoT Connectivity Market.
- August 2023: The 3GPP organization finalized Release 17 (Rel-17), formally standardizing 5G RedCap (Reduced Capability) specifications, thereby providing a clear framework for chip developers and network operators to implement and support the technology globally.
- October 2023: Several telecommunications operators in Asia Pacific and Europe announced successful trials of RedCap-enabled devices on their live 5G standalone networks, demonstrating compatibility and performance for applications like video surveillance and industrial automation.
- January 2024: UNISOC Communications launched its new series of RedCap chipsets, specifically targeting the expanding market for cost-effective 5G IoT modules in emerging economies, emphasizing affordability and power efficiency for mass deployment.
- February 2024: Sequans Communications announced a strategic partnership with a leading module manufacturer to co-develop RedCap modules tailored for the Smart Metering Market, leveraging Sequans' expertise in low-power cellular IoT solutions.
- April 2024: Samsung Electronics unveiled plans to integrate RedCap capabilities into future Exynos chipsets, aiming to enhance the connectivity options for its own range of consumer electronics and enterprise IoT solutions, including potential for the Wearables Market.
Regional Market Breakdown for the 5G RedCap Chip Market
The global 5G RedCap Chip Market exhibits varied growth dynamics and adoption rates across different geographical regions, primarily influenced by the pace of 5G network deployment, industrial digitalization initiatives, and consumer IoT adoption.
Asia Pacific is identified as the dominant region in terms of revenue share, and it is also projected to be one of the fastest-growing markets for 5G RedCap chips. This dominance is driven by aggressive 5G infrastructure rollout, particularly in countries like China, South Korea, and Japan, coupled with a massive manufacturing base for IoT devices. The region's robust industrial sector and rapid adoption of smart city initiatives further propel demand for efficient cellular IoT solutions. Significant government investments in digital transformation and the sheer volume of connected devices contribute to the thriving Telecommunications Equipment Market and, consequently, the 5G RedCap Chip Market here.
North America holds a substantial market share, characterized by early adoption of advanced IoT technologies across enterprise and automotive sectors. The region benefits from strong R&D capabilities, significant investments in private 5G networks for industrial applications, and a mature ecosystem for IoT development. The increasing demand for connected vehicles (Telematics & Automotive) and smart infrastructure projects are key drivers in this region, alongside a growing emphasis on optimizing operational costs through RedCap's efficiency.
Europe represents a significant and steadily growing market for 5G RedCap chips. The region's focus on Industry 4.0, smart utilities, and stringent data security regulations encourages the deployment of reliable cellular IoT solutions. Countries like Germany, France, and the UK are at the forefront of industrial automation and smart grid initiatives, driving demand for RedCap chips in applications such as industrial sensors and Smart Metering Market solutions. European telecom operators are actively upgrading their networks to support RedCap, fostering a supportive environment for market expansion.
Middle East & Africa (MEA) and South America are emerging markets demonstrating high growth potential for the 5G RedCap Chip Market. These regions are witnessing nascent but accelerating 5G rollouts, coupled with government-backed digital transformation agendas. The demand for affordable and efficient connectivity solutions for various applications, including smart cities, remote monitoring, and asset tracking, is steadily increasing. As 5G infrastructure matures and RedCap solutions become more accessible, these regions are expected to contribute significantly to global market expansion, leveraging RedCap's ability to provide a cost-effective path to 5G connectivity for a broad range of devices.
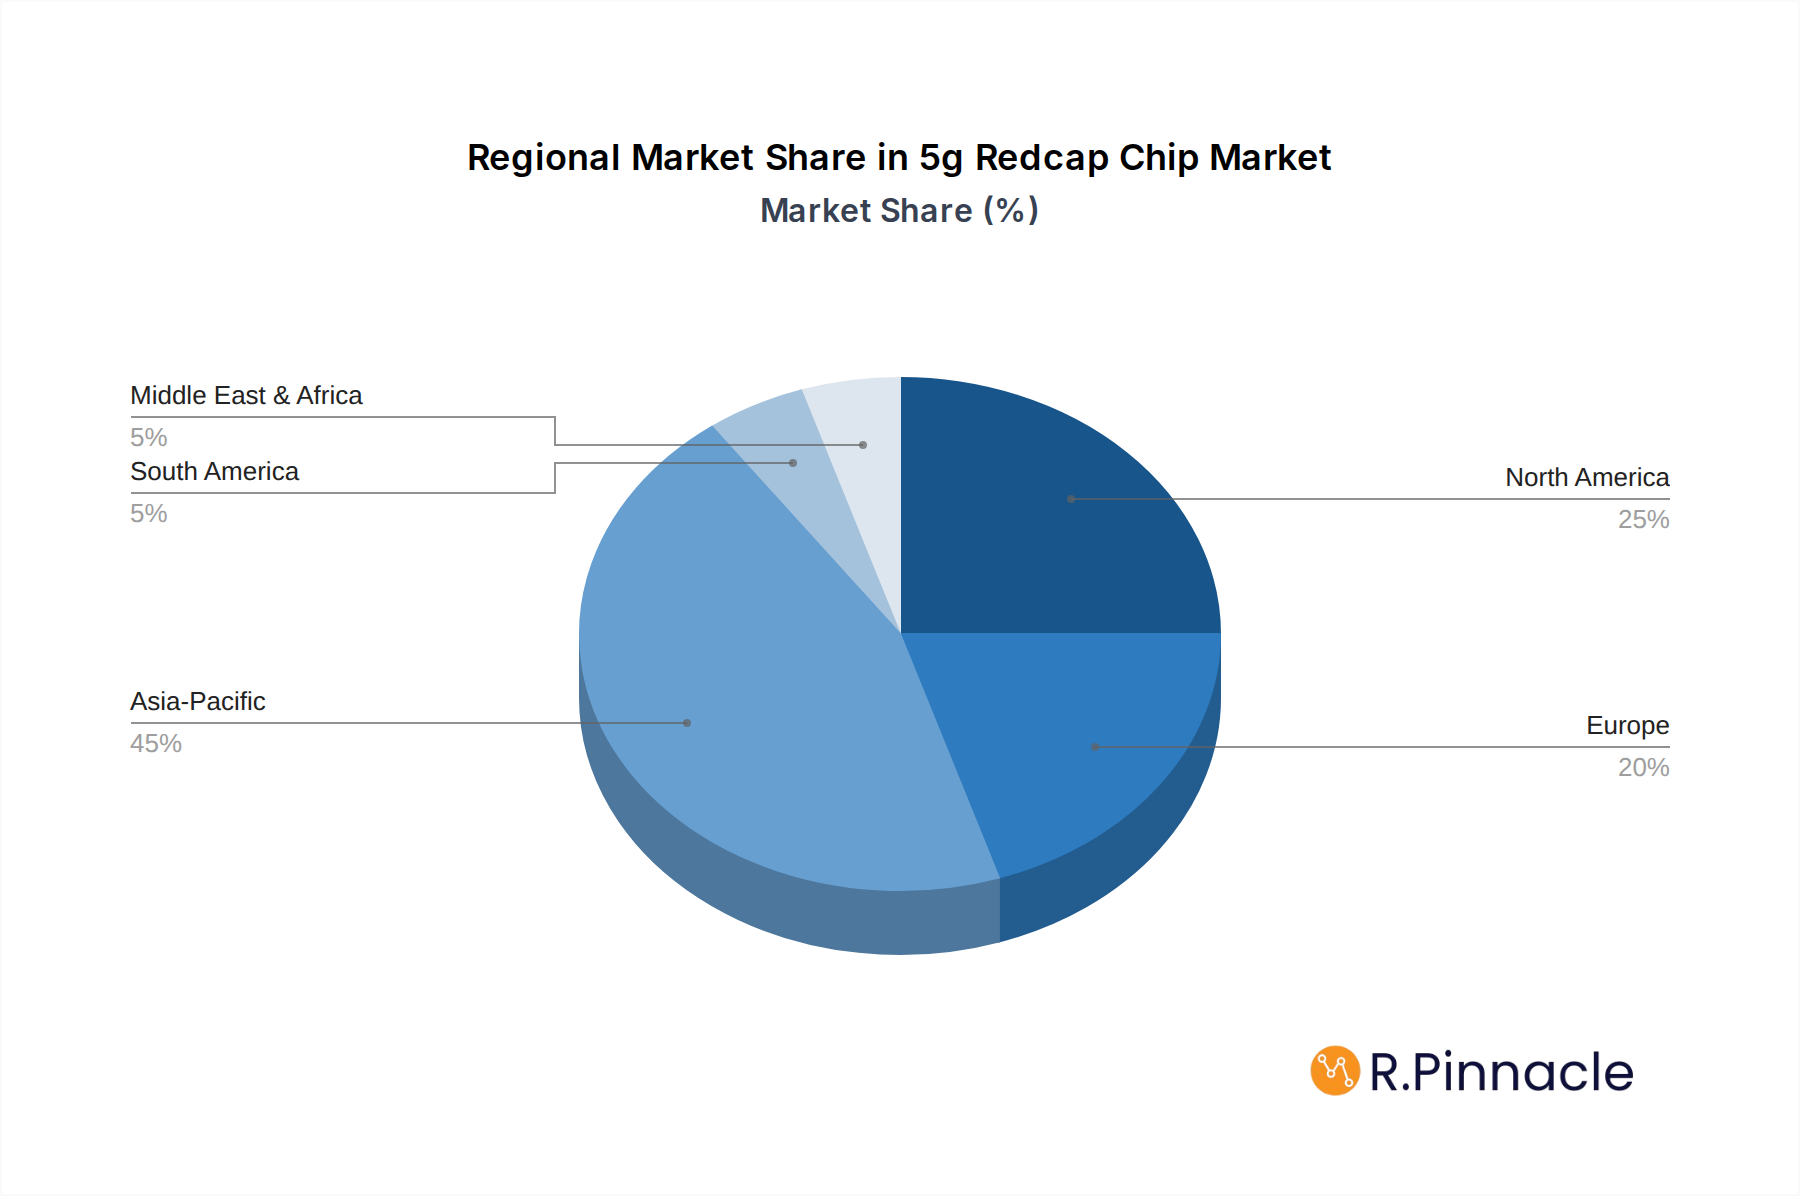
5g Redcap Chip Regional Market Share
Supply Chain & Raw Material Dynamics for the 5G RedCap Chip Market
The supply chain for the 5G RedCap Chip Market is deeply intertwined with the broader Semiconductor Chip Market, characterized by its global complexity and susceptibility to geopolitical and economic shifts. Upstream dependencies are significant, relying on a diverse array of raw materials and highly specialized manufacturing processes. Key raw materials include high-purity silicon wafers, which form the substrate for integrated circuits, along with various rare earth elements, copper, gold, and specialized gases (e.g., argon, nitrogen, oxygen) essential for fabrication. Advanced packaging materials, such as epoxy molding compounds, leadframes, and bonding wires, also play a critical role in the final assembly of the RedCap chips.
Sourcing risks are pronounced due to the concentrated nature of wafer fabrication and advanced packaging within a few regions and companies. Geopolitical tensions, trade disputes, and natural disasters can significantly disrupt the supply of critical components, leading to delays and increased costs. The recent global semiconductor shortage, while primarily affecting automotive and consumer electronics, highlighted the fragility of the entire chip supply chain. For the 5G RedCap Chip Market, this means potential delays in module production, impacting the rollout of RedCap-enabled IoT devices and subsequently slowing adoption rates in the IoT Connectivity Market.
Price volatility of key inputs is a constant challenge. Silicon wafer prices, for instance, are influenced by global demand for all types of chips, manufacturing capacity utilization, and energy costs. Rare earth elements, crucial for certain semiconductor processes, are subject to supply chain concentrations and export policies, leading to unpredictable price fluctuations. Historically, disruptions have manifested as extended lead times for chip delivery, forcing manufacturers to rethink just-in-time inventory strategies in favor of buffer stocks. These dynamics compel RedCap chip manufacturers to implement robust supply chain resilience strategies, including diversification of suppliers, strategic stockpiling of critical materials, and greater vertical integration to mitigate risks and ensure a stable supply for the rapidly growing demand in the Cellular IoT Market.
Investment & Funding Activity in the 5G RedCap Chip Market
Investment and funding activity within the 5G RedCap Chip Market has seen a notable surge over the past 2-3 years, reflecting growing confidence in RedCap's role as a pivotal technology for the next generation of IoT. This activity encompasses strategic partnerships, venture funding rounds, and mergers & acquisitions (M&A) focused on enhancing capabilities and accelerating market penetration.
Strategic partnerships form a significant portion of the investment landscape. Chip manufacturers are actively collaborating with module makers, network equipment providers, and telecom operators. For instance, major chip vendors like Qualcomm and MediaTek have announced collaborations with module suppliers to streamline the development and integration of RedCap modules, ensuring faster time-to-market for device manufacturers. Network operators, recognizing RedCap's potential for efficient network slicing and optimized resource allocation, are investing in upgrading their infrastructure to fully support RedCap devices, often through direct engagements with chip developers or by funding pilot projects. These partnerships are crucial for building a cohesive ecosystem for the Cellular IoT Market.
Venture funding rounds are increasingly targeting startups that specialize in RedCap module development, embedded software for RedCap-enabled devices, or specific vertical applications leveraging RedCap. Investment is particularly concentrated in sub-segments such as industrial IoT (IIoT) applications, where RedCap's balance of performance and efficiency offers a compelling alternative for factory automation, asset tracking, and remote monitoring. Automotive telematics, especially for non-critical in-car connectivity and infotainment systems, is another area attracting capital, as RedCap offers a more cost-effective 5G solution than full-spec modems. Additionally, companies developing solutions for the Smart Metering Market and advanced Wearables Market are seeing increased funding, driven by the need for long-lasting, securely connected devices.
M&A activity, while less frequent than partnerships, is focused on consolidating intellectual property and expanding market reach. Larger semiconductor firms might acquire smaller, specialized RedCap IP developers to enhance their product portfolios or gain a competitive edge. Overall, the investment trend indicates a strong belief in RedCap's ability to unlock new revenue streams by enabling a vast array of mid-tier 5G IoT devices, thereby bridging the gap between high-performance 5G and low-power IoT technologies within the broader IoT Connectivity Market.
5g Redcap Chip Segmentation
-
1. Product Type
- 1.1. Single Mode Chip
- 1.2. Dual Mode Chip
-
2. Frequency Band
- 2.1. Sub-6 GHz (FR1)
- 2.2. mmWave (FR2)
-
3. Application
- 3.1. Routers & Gateways
- 3.2. Cameras
- 3.3. Customer Premises Equipment (CPE)
- 3.4. Telematics & Automotive
- 3.5. Wearables
- 3.6. Smart Metering
- 3.7. Others
-
4. Distribution Channel
- 4.1. Direct Sales
- 4.2. Distributors and Wholesalers
- 4.3. Online
-
5. End User Industry
- 5.1. Consumer Electronics
- 5.2. Telecommunications
- 5.3. Manufacturing
- 5.4. Automotive & Transportation
- 5.5. Healthcare
- 5.6. Energy & Utilities
- 5.7. Retail
- 5.8. Others
5g Redcap Chip Segmentation By Geography
-
1. North America
- 1.1. United States
- 1.2. Canada
- 1.3. Mexico
-
2. South America
- 2.1. Brazil
- 2.2. Argentina
- 2.3. Rest of South America
-
3. Europe
- 3.1. United Kingdom
- 3.2. Germany
- 3.3. France
- 3.4. Italy
- 3.5. Spain
- 3.6. Russia
- 3.7. Benelux
- 3.8. Nordics
- 3.9. Rest of Europe
-
4. Middle East & Africa
- 4.1. Turkey
- 4.2. Israel
- 4.3. GCC
- 4.4. North Africa
- 4.5. South Africa
- 4.6. Rest of Middle East & Africa
-
5. Asia Pacific
- 5.1. China
- 5.2. India
- 5.3. Japan
- 5.4. South Korea
- 5.5. ASEAN
- 5.6. Oceania
- 5.7. Rest of Asia Pacific
5g Redcap Chip Regional Market Share
Geographic Coverage of 5g Redcap Chip
5g Redcap Chip REPORT HIGHLIGHTS
| Aspects | Details |
|---|---|
| Study Period | 2020-2034 |
| Base Year | 2025 |
| Estimated Year | 2026 |
| Forecast Period | 2026-2034 |
| Historical Period | 2020-2025 |
| Growth Rate | CAGR of 17.4% from 2020-2034 |
| Segmentation |
|
Table of Contents
- 1. Introduction
- 1.1. Research Scope
- 1.2. Market Segmentation
- 1.3. Research Objective
- 1.4. Definitions and Assumptions
- 2. Executive Summary
- 2.1. Market Snapshot
- 3. Market Dynamics
- 3.1. Market Drivers
- 3.2. Market Restrains
- 3.3. Market Trends
- 3.4. Market Opportunities
- 4. Market Factor Analysis
- 4.1. Porters Five Forces
- 4.1.1. Bargaining Power of Suppliers
- 4.1.2. Bargaining Power of Buyers
- 4.1.3. Threat of New Entrants
- 4.1.4. Threat of Substitutes
- 4.1.5. Competitive Rivalry
- 4.2. PESTEL analysis
- 4.3. BCG Analysis
- 4.3.1. Stars (High Growth, High Market Share)
- 4.3.2. Cash Cows (Low Growth, High Market Share)
- 4.3.3. Question Mark (High Growth, Low Market Share)
- 4.3.4. Dogs (Low Growth, Low Market Share)
- 4.4. Ansoff Matrix Analysis
- 4.5. Supply Chain Analysis
- 4.6. Regulatory Landscape
- 4.7. Current Market Potential and Opportunity Assessment (TAM–SAM–SOM Framework)
- 4.8. PRI Analyst Note
- 4.1. Porters Five Forces
- 5. Market Analysis, Insights and Forecast 2021-2033
- 5.1. Market Analysis, Insights and Forecast - by Product Type
- 5.1.1. Single Mode Chip
- 5.1.2. Dual Mode Chip
- 5.2. Market Analysis, Insights and Forecast - by Frequency Band
- 5.2.1. Sub-6 GHz (FR1)
- 5.2.2. mmWave (FR2)
- 5.3. Market Analysis, Insights and Forecast - by Application
- 5.3.1. Routers & Gateways
- 5.3.2. Cameras
- 5.3.3. Customer Premises Equipment (CPE)
- 5.3.4. Telematics & Automotive
- 5.3.5. Wearables
- 5.3.6. Smart Metering
- 5.3.7. Others
- 5.4. Market Analysis, Insights and Forecast - by Distribution Channel
- 5.4.1. Direct Sales
- 5.4.2. Distributors and Wholesalers
- 5.4.3. Online
- 5.5. Market Analysis, Insights and Forecast - by End User Industry
- 5.5.1. Consumer Electronics
- 5.5.2. Telecommunications
- 5.5.3. Manufacturing
- 5.5.4. Automotive & Transportation
- 5.5.5. Healthcare
- 5.5.6. Energy & Utilities
- 5.5.7. Retail
- 5.5.8. Others
- 5.6. Market Analysis, Insights and Forecast - by Region
- 5.6.1. North America
- 5.6.2. South America
- 5.6.3. Europe
- 5.6.4. Middle East & Africa
- 5.6.5. Asia Pacific
- 5.1. Market Analysis, Insights and Forecast - by Product Type
- 6. Global 5g Redcap Chip Analysis, Insights and Forecast, 2021-2033
- 6.1. Market Analysis, Insights and Forecast - by Product Type
- 6.1.1. Single Mode Chip
- 6.1.2. Dual Mode Chip
- 6.2. Market Analysis, Insights and Forecast - by Frequency Band
- 6.2.1. Sub-6 GHz (FR1)
- 6.2.2. mmWave (FR2)
- 6.3. Market Analysis, Insights and Forecast - by Application
- 6.3.1. Routers & Gateways
- 6.3.2. Cameras
- 6.3.3. Customer Premises Equipment (CPE)
- 6.3.4. Telematics & Automotive
- 6.3.5. Wearables
- 6.3.6. Smart Metering
- 6.3.7. Others
- 6.4. Market Analysis, Insights and Forecast - by Distribution Channel
- 6.4.1. Direct Sales
- 6.4.2. Distributors and Wholesalers
- 6.4.3. Online
- 6.5. Market Analysis, Insights and Forecast - by End User Industry
- 6.5.1. Consumer Electronics
- 6.5.2. Telecommunications
- 6.5.3. Manufacturing
- 6.5.4. Automotive & Transportation
- 6.5.5. Healthcare
- 6.5.6. Energy & Utilities
- 6.5.7. Retail
- 6.5.8. Others
- 6.1. Market Analysis, Insights and Forecast - by Product Type
- 7. North America 5g Redcap Chip Analysis, Insights and Forecast, 2020-2032
- 7.1. Market Analysis, Insights and Forecast - by Product Type
- 7.1.1. Single Mode Chip
- 7.1.2. Dual Mode Chip
- 7.2. Market Analysis, Insights and Forecast - by Frequency Band
- 7.2.1. Sub-6 GHz (FR1)
- 7.2.2. mmWave (FR2)
- 7.3. Market Analysis, Insights and Forecast - by Application
- 7.3.1. Routers & Gateways
- 7.3.2. Cameras
- 7.3.3. Customer Premises Equipment (CPE)
- 7.3.4. Telematics & Automotive
- 7.3.5. Wearables
- 7.3.6. Smart Metering
- 7.3.7. Others
- 7.4. Market Analysis, Insights and Forecast - by Distribution Channel
- 7.4.1. Direct Sales
- 7.4.2. Distributors and Wholesalers
- 7.4.3. Online
- 7.5. Market Analysis, Insights and Forecast - by End User Industry
- 7.5.1. Consumer Electronics
- 7.5.2. Telecommunications
- 7.5.3. Manufacturing
- 7.5.4. Automotive & Transportation
- 7.5.5. Healthcare
- 7.5.6. Energy & Utilities
- 7.5.7. Retail
- 7.5.8. Others
- 7.1. Market Analysis, Insights and Forecast - by Product Type
- 8. South America 5g Redcap Chip Analysis, Insights and Forecast, 2020-2032
- 8.1. Market Analysis, Insights and Forecast - by Product Type
- 8.1.1. Single Mode Chip
- 8.1.2. Dual Mode Chip
- 8.2. Market Analysis, Insights and Forecast - by Frequency Band
- 8.2.1. Sub-6 GHz (FR1)
- 8.2.2. mmWave (FR2)
- 8.3. Market Analysis, Insights and Forecast - by Application
- 8.3.1. Routers & Gateways
- 8.3.2. Cameras
- 8.3.3. Customer Premises Equipment (CPE)
- 8.3.4. Telematics & Automotive
- 8.3.5. Wearables
- 8.3.6. Smart Metering
- 8.3.7. Others
- 8.4. Market Analysis, Insights and Forecast - by Distribution Channel
- 8.4.1. Direct Sales
- 8.4.2. Distributors and Wholesalers
- 8.4.3. Online
- 8.5. Market Analysis, Insights and Forecast - by End User Industry
- 8.5.1. Consumer Electronics
- 8.5.2. Telecommunications
- 8.5.3. Manufacturing
- 8.5.4. Automotive & Transportation
- 8.5.5. Healthcare
- 8.5.6. Energy & Utilities
- 8.5.7. Retail
- 8.5.8. Others
- 8.1. Market Analysis, Insights and Forecast - by Product Type
- 9. Europe 5g Redcap Chip Analysis, Insights and Forecast, 2020-2032
- 9.1. Market Analysis, Insights and Forecast - by Product Type
- 9.1.1. Single Mode Chip
- 9.1.2. Dual Mode Chip
- 9.2. Market Analysis, Insights and Forecast - by Frequency Band
- 9.2.1. Sub-6 GHz (FR1)
- 9.2.2. mmWave (FR2)
- 9.3. Market Analysis, Insights and Forecast - by Application
- 9.3.1. Routers & Gateways
- 9.3.2. Cameras
- 9.3.3. Customer Premises Equipment (CPE)
- 9.3.4. Telematics & Automotive
- 9.3.5. Wearables
- 9.3.6. Smart Metering
- 9.3.7. Others
- 9.4. Market Analysis, Insights and Forecast - by Distribution Channel
- 9.4.1. Direct Sales
- 9.4.2. Distributors and Wholesalers
- 9.4.3. Online
- 9.5. Market Analysis, Insights and Forecast - by End User Industry
- 9.5.1. Consumer Electronics
- 9.5.2. Telecommunications
- 9.5.3. Manufacturing
- 9.5.4. Automotive & Transportation
- 9.5.5. Healthcare
- 9.5.6. Energy & Utilities
- 9.5.7. Retail
- 9.5.8. Others
- 9.1. Market Analysis, Insights and Forecast - by Product Type
- 10. Middle East & Africa 5g Redcap Chip Analysis, Insights and Forecast, 2020-2032
- 10.1. Market Analysis, Insights and Forecast - by Product Type
- 10.1.1. Single Mode Chip
- 10.1.2. Dual Mode Chip
- 10.2. Market Analysis, Insights and Forecast - by Frequency Band
- 10.2.1. Sub-6 GHz (FR1)
- 10.2.2. mmWave (FR2)
- 10.3. Market Analysis, Insights and Forecast - by Application
- 10.3.1. Routers & Gateways
- 10.3.2. Cameras
- 10.3.3. Customer Premises Equipment (CPE)
- 10.3.4. Telematics & Automotive
- 10.3.5. Wearables
- 10.3.6. Smart Metering
- 10.3.7. Others
- 10.4. Market Analysis, Insights and Forecast - by Distribution Channel
- 10.4.1. Direct Sales
- 10.4.2. Distributors and Wholesalers
- 10.4.3. Online
- 10.5. Market Analysis, Insights and Forecast - by End User Industry
- 10.5.1. Consumer Electronics
- 10.5.2. Telecommunications
- 10.5.3. Manufacturing
- 10.5.4. Automotive & Transportation
- 10.5.5. Healthcare
- 10.5.6. Energy & Utilities
- 10.5.7. Retail
- 10.5.8. Others
- 10.1. Market Analysis, Insights and Forecast - by Product Type
- 11. Asia Pacific 5g Redcap Chip Analysis, Insights and Forecast, 2020-2032
- 11.1. Market Analysis, Insights and Forecast - by Product Type
- 11.1.1. Single Mode Chip
- 11.1.2. Dual Mode Chip
- 11.2. Market Analysis, Insights and Forecast - by Frequency Band
- 11.2.1. Sub-6 GHz (FR1)
- 11.2.2. mmWave (FR2)
- 11.3. Market Analysis, Insights and Forecast - by Application
- 11.3.1. Routers & Gateways
- 11.3.2. Cameras
- 11.3.3. Customer Premises Equipment (CPE)
- 11.3.4. Telematics & Automotive
- 11.3.5. Wearables
- 11.3.6. Smart Metering
- 11.3.7. Others
- 11.4. Market Analysis, Insights and Forecast - by Distribution Channel
- 11.4.1. Direct Sales
- 11.4.2. Distributors and Wholesalers
- 11.4.3. Online
- 11.5. Market Analysis, Insights and Forecast - by End User Industry
- 11.5.1. Consumer Electronics
- 11.5.2. Telecommunications
- 11.5.3. Manufacturing
- 11.5.4. Automotive & Transportation
- 11.5.5. Healthcare
- 11.5.6. Energy & Utilities
- 11.5.7. Retail
- 11.5.8. Others
- 11.1. Market Analysis, Insights and Forecast - by Product Type
- 12. Competitive Analysis
- 12.1. Company Profiles
- 12.1.1 Qualcomm Technologies Inc.
- 12.1.1.1. Company Overview
- 12.1.1.2. Products
- 12.1.1.3. Company Financials
- 12.1.1.4. SWOT Analysis
- 12.1.2 MediaTek Inc.
- 12.1.2.1. Company Overview
- 12.1.2.2. Products
- 12.1.2.3. Company Financials
- 12.1.2.4. SWOT Analysis
- 12.1.3 Samsung Electronics Co. Ltd.
- 12.1.3.1. Company Overview
- 12.1.3.2. Products
- 12.1.3.3. Company Financials
- 12.1.3.4. SWOT Analysis
- 12.1.4 UNISOC Communications Inc.
- 12.1.4.1. Company Overview
- 12.1.4.2. Products
- 12.1.4.3. Company Financials
- 12.1.4.4. SWOT Analysis
- 12.1.5 Sequans Communications S.A.
- 12.1.5.1. Company Overview
- 12.1.5.2. Products
- 12.1.5.3. Company Financials
- 12.1.5.4. SWOT Analysis
- 12.1.6 ASR Microelectronics Co. Ltd.
- 12.1.6.1. Company Overview
- 12.1.6.2. Products
- 12.1.6.3. Company Financials
- 12.1.6.4. SWOT Analysis
- 12.1.7 Huawei Technologies Co. Ltd.
- 12.1.7.1. Company Overview
- 12.1.7.2. Products
- 12.1.7.3. Company Financials
- 12.1.7.4. SWOT Analysis
- 12.1.8 Intel Corporation
- 12.1.8.1. Company Overview
- 12.1.8.2. Products
- 12.1.8.3. Company Financials
- 12.1.8.4. SWOT Analysis
- 12.1.9 Nokia Corporation
- 12.1.9.1. Company Overview
- 12.1.9.2. Products
- 12.1.9.3. Company Financials
- 12.1.9.4. SWOT Analysis
- 12.1.10 Telefonaktiebolaget LM Ericsson
- 12.1.10.1. Company Overview
- 12.1.10.2. Products
- 12.1.10.3. Company Financials
- 12.1.10.4. SWOT Analysis
- 12.1.11 Others
- 12.1.11.1. Company Overview
- 12.1.11.2. Products
- 12.1.11.3. Company Financials
- 12.1.11.4. SWOT Analysis
- 12.1.1 Qualcomm Technologies Inc.
- 12.2. Market Entropy
- 12.2.1 Company's Key Areas Served
- 12.2.2 Recent Developments
- 12.3. Company Market Share Analysis 2025
- 12.3.1 Top 5 Companies Market Share Analysis
- 12.3.2 Top 3 Companies Market Share Analysis
- 12.4. List of Potential Customers
- 13. Research Methodology
List of Figures
- Figure 1: Global 5g Redcap Chip Revenue Breakdown (billion, %) by Region 2025 & 2033
- Figure 2: Global 5g Redcap Chip Volume Breakdown (K, %) by Region 2025 & 2033
- Figure 3: North America 5g Redcap Chip Revenue (billion), by Product Type 2025 & 2033
- Figure 4: North America 5g Redcap Chip Volume (K), by Product Type 2025 & 2033
- Figure 5: North America 5g Redcap Chip Revenue Share (%), by Product Type 2025 & 2033
- Figure 6: North America 5g Redcap Chip Volume Share (%), by Product Type 2025 & 2033
- Figure 7: North America 5g Redcap Chip Revenue (billion), by Frequency Band 2025 & 2033
- Figure 8: North America 5g Redcap Chip Volume (K), by Frequency Band 2025 & 2033
- Figure 9: North America 5g Redcap Chip Revenue Share (%), by Frequency Band 2025 & 2033
- Figure 10: North America 5g Redcap Chip Volume Share (%), by Frequency Band 2025 & 2033
- Figure 11: North America 5g Redcap Chip Revenue (billion), by Application 2025 & 2033
- Figure 12: North America 5g Redcap Chip Volume (K), by Application 2025 & 2033
- Figure 13: North America 5g Redcap Chip Revenue Share (%), by Application 2025 & 2033
- Figure 14: North America 5g Redcap Chip Volume Share (%), by Application 2025 & 2033
- Figure 15: North America 5g Redcap Chip Revenue (billion), by Distribution Channel 2025 & 2033
- Figure 16: North America 5g Redcap Chip Volume (K), by Distribution Channel 2025 & 2033
- Figure 17: North America 5g Redcap Chip Revenue Share (%), by Distribution Channel 2025 & 2033
- Figure 18: North America 5g Redcap Chip Volume Share (%), by Distribution Channel 2025 & 2033
- Figure 19: North America 5g Redcap Chip Revenue (billion), by End User Industry 2025 & 2033
- Figure 20: North America 5g Redcap Chip Volume (K), by End User Industry 2025 & 2033
- Figure 21: North America 5g Redcap Chip Revenue Share (%), by End User Industry 2025 & 2033
- Figure 22: North America 5g Redcap Chip Volume Share (%), by End User Industry 2025 & 2033
- Figure 23: North America 5g Redcap Chip Revenue (billion), by Country 2025 & 2033
- Figure 24: North America 5g Redcap Chip Volume (K), by Country 2025 & 2033
- Figure 25: North America 5g Redcap Chip Revenue Share (%), by Country 2025 & 2033
- Figure 26: North America 5g Redcap Chip Volume Share (%), by Country 2025 & 2033
- Figure 27: South America 5g Redcap Chip Revenue (billion), by Product Type 2025 & 2033
- Figure 28: South America 5g Redcap Chip Volume (K), by Product Type 2025 & 2033
- Figure 29: South America 5g Redcap Chip Revenue Share (%), by Product Type 2025 & 2033
- Figure 30: South America 5g Redcap Chip Volume Share (%), by Product Type 2025 & 2033
- Figure 31: South America 5g Redcap Chip Revenue (billion), by Frequency Band 2025 & 2033
- Figure 32: South America 5g Redcap Chip Volume (K), by Frequency Band 2025 & 2033
- Figure 33: South America 5g Redcap Chip Revenue Share (%), by Frequency Band 2025 & 2033
- Figure 34: South America 5g Redcap Chip Volume Share (%), by Frequency Band 2025 & 2033
- Figure 35: South America 5g Redcap Chip Revenue (billion), by Application 2025 & 2033
- Figure 36: South America 5g Redcap Chip Volume (K), by Application 2025 & 2033
- Figure 37: South America 5g Redcap Chip Revenue Share (%), by Application 2025 & 2033
- Figure 38: South America 5g Redcap Chip Volume Share (%), by Application 2025 & 2033
- Figure 39: South America 5g Redcap Chip Revenue (billion), by Distribution Channel 2025 & 2033
- Figure 40: South America 5g Redcap Chip Volume (K), by Distribution Channel 2025 & 2033
- Figure 41: South America 5g Redcap Chip Revenue Share (%), by Distribution Channel 2025 & 2033
- Figure 42: South America 5g Redcap Chip Volume Share (%), by Distribution Channel 2025 & 2033
- Figure 43: South America 5g Redcap Chip Revenue (billion), by End User Industry 2025 & 2033
- Figure 44: South America 5g Redcap Chip Volume (K), by End User Industry 2025 & 2033
- Figure 45: South America 5g Redcap Chip Revenue Share (%), by End User Industry 2025 & 2033
- Figure 46: South America 5g Redcap Chip Volume Share (%), by End User Industry 2025 & 2033
- Figure 47: South America 5g Redcap Chip Revenue (billion), by Country 2025 & 2033
- Figure 48: South America 5g Redcap Chip Volume (K), by Country 2025 & 2033
- Figure 49: South America 5g Redcap Chip Revenue Share (%), by Country 2025 & 2033
- Figure 50: South America 5g Redcap Chip Volume Share (%), by Country 2025 & 2033
- Figure 51: Europe 5g Redcap Chip Revenue (billion), by Product Type 2025 & 2033
- Figure 52: Europe 5g Redcap Chip Volume (K), by Product Type 2025 & 2033
- Figure 53: Europe 5g Redcap Chip Revenue Share (%), by Product Type 2025 & 2033
- Figure 54: Europe 5g Redcap Chip Volume Share (%), by Product Type 2025 & 2033
- Figure 55: Europe 5g Redcap Chip Revenue (billion), by Frequency Band 2025 & 2033
- Figure 56: Europe 5g Redcap Chip Volume (K), by Frequency Band 2025 & 2033
- Figure 57: Europe 5g Redcap Chip Revenue Share (%), by Frequency Band 2025 & 2033
- Figure 58: Europe 5g Redcap Chip Volume Share (%), by Frequency Band 2025 & 2033
- Figure 59: Europe 5g Redcap Chip Revenue (billion), by Application 2025 & 2033
- Figure 60: Europe 5g Redcap Chip Volume (K), by Application 2025 & 2033
- Figure 61: Europe 5g Redcap Chip Revenue Share (%), by Application 2025 & 2033
- Figure 62: Europe 5g Redcap Chip Volume Share (%), by Application 2025 & 2033
- Figure 63: Europe 5g Redcap Chip Revenue (billion), by Distribution Channel 2025 & 2033
- Figure 64: Europe 5g Redcap Chip Volume (K), by Distribution Channel 2025 & 2033
- Figure 65: Europe 5g Redcap Chip Revenue Share (%), by Distribution Channel 2025 & 2033
- Figure 66: Europe 5g Redcap Chip Volume Share (%), by Distribution Channel 2025 & 2033
- Figure 67: Europe 5g Redcap Chip Revenue (billion), by End User Industry 2025 & 2033
- Figure 68: Europe 5g Redcap Chip Volume (K), by End User Industry 2025 & 2033
- Figure 69: Europe 5g Redcap Chip Revenue Share (%), by End User Industry 2025 & 2033
- Figure 70: Europe 5g Redcap Chip Volume Share (%), by End User Industry 2025 & 2033
- Figure 71: Europe 5g Redcap Chip Revenue (billion), by Country 2025 & 2033
- Figure 72: Europe 5g Redcap Chip Volume (K), by Country 2025 & 2033
- Figure 73: Europe 5g Redcap Chip Revenue Share (%), by Country 2025 & 2033
- Figure 74: Europe 5g Redcap Chip Volume Share (%), by Country 2025 & 2033
- Figure 75: Middle East & Africa 5g Redcap Chip Revenue (billion), by Product Type 2025 & 2033
- Figure 76: Middle East & Africa 5g Redcap Chip Volume (K), by Product Type 2025 & 2033
- Figure 77: Middle East & Africa 5g Redcap Chip Revenue Share (%), by Product Type 2025 & 2033
- Figure 78: Middle East & Africa 5g Redcap Chip Volume Share (%), by Product Type 2025 & 2033
- Figure 79: Middle East & Africa 5g Redcap Chip Revenue (billion), by Frequency Band 2025 & 2033
- Figure 80: Middle East & Africa 5g Redcap Chip Volume (K), by Frequency Band 2025 & 2033
- Figure 81: Middle East & Africa 5g Redcap Chip Revenue Share (%), by Frequency Band 2025 & 2033
- Figure 82: Middle East & Africa 5g Redcap Chip Volume Share (%), by Frequency Band 2025 & 2033
- Figure 83: Middle East & Africa 5g Redcap Chip Revenue (billion), by Application 2025 & 2033
- Figure 84: Middle East & Africa 5g Redcap Chip Volume (K), by Application 2025 & 2033
- Figure 85: Middle East & Africa 5g Redcap Chip Revenue Share (%), by Application 2025 & 2033
- Figure 86: Middle East & Africa 5g Redcap Chip Volume Share (%), by Application 2025 & 2033
- Figure 87: Middle East & Africa 5g Redcap Chip Revenue (billion), by Distribution Channel 2025 & 2033
- Figure 88: Middle East & Africa 5g Redcap Chip Volume (K), by Distribution Channel 2025 & 2033
- Figure 89: Middle East & Africa 5g Redcap Chip Revenue Share (%), by Distribution Channel 2025 & 2033
- Figure 90: Middle East & Africa 5g Redcap Chip Volume Share (%), by Distribution Channel 2025 & 2033
- Figure 91: Middle East & Africa 5g Redcap Chip Revenue (billion), by End User Industry 2025 & 2033
- Figure 92: Middle East & Africa 5g Redcap Chip Volume (K), by End User Industry 2025 & 2033
- Figure 93: Middle East & Africa 5g Redcap Chip Revenue Share (%), by End User Industry 2025 & 2033
- Figure 94: Middle East & Africa 5g Redcap Chip Volume Share (%), by End User Industry 2025 & 2033
- Figure 95: Middle East & Africa 5g Redcap Chip Revenue (billion), by Country 2025 & 2033
- Figure 96: Middle East & Africa 5g Redcap Chip Volume (K), by Country 2025 & 2033
- Figure 97: Middle East & Africa 5g Redcap Chip Revenue Share (%), by Country 2025 & 2033
- Figure 98: Middle East & Africa 5g Redcap Chip Volume Share (%), by Country 2025 & 2033
- Figure 99: Asia Pacific 5g Redcap Chip Revenue (billion), by Product Type 2025 & 2033
- Figure 100: Asia Pacific 5g Redcap Chip Volume (K), by Product Type 2025 & 2033
- Figure 101: Asia Pacific 5g Redcap Chip Revenue Share (%), by Product Type 2025 & 2033
- Figure 102: Asia Pacific 5g Redcap Chip Volume Share (%), by Product Type 2025 & 2033
- Figure 103: Asia Pacific 5g Redcap Chip Revenue (billion), by Frequency Band 2025 & 2033
- Figure 104: Asia Pacific 5g Redcap Chip Volume (K), by Frequency Band 2025 & 2033
- Figure 105: Asia Pacific 5g Redcap Chip Revenue Share (%), by Frequency Band 2025 & 2033
- Figure 106: Asia Pacific 5g Redcap Chip Volume Share (%), by Frequency Band 2025 & 2033
- Figure 107: Asia Pacific 5g Redcap Chip Revenue (billion), by Application 2025 & 2033
- Figure 108: Asia Pacific 5g Redcap Chip Volume (K), by Application 2025 & 2033
- Figure 109: Asia Pacific 5g Redcap Chip Revenue Share (%), by Application 2025 & 2033
- Figure 110: Asia Pacific 5g Redcap Chip Volume Share (%), by Application 2025 & 2033
- Figure 111: Asia Pacific 5g Redcap Chip Revenue (billion), by Distribution Channel 2025 & 2033
- Figure 112: Asia Pacific 5g Redcap Chip Volume (K), by Distribution Channel 2025 & 2033
- Figure 113: Asia Pacific 5g Redcap Chip Revenue Share (%), by Distribution Channel 2025 & 2033
- Figure 114: Asia Pacific 5g Redcap Chip Volume Share (%), by Distribution Channel 2025 & 2033
- Figure 115: Asia Pacific 5g Redcap Chip Revenue (billion), by End User Industry 2025 & 2033
- Figure 116: Asia Pacific 5g Redcap Chip Volume (K), by End User Industry 2025 & 2033
- Figure 117: Asia Pacific 5g Redcap Chip Revenue Share (%), by End User Industry 2025 & 2033
- Figure 118: Asia Pacific 5g Redcap Chip Volume Share (%), by End User Industry 2025 & 2033
- Figure 119: Asia Pacific 5g Redcap Chip Revenue (billion), by Country 2025 & 2033
- Figure 120: Asia Pacific 5g Redcap Chip Volume (K), by Country 2025 & 2033
- Figure 121: Asia Pacific 5g Redcap Chip Revenue Share (%), by Country 2025 & 2033
- Figure 122: Asia Pacific 5g Redcap Chip Volume Share (%), by Country 2025 & 2033
List of Tables
- Table 1: Global 5g Redcap Chip Revenue billion Forecast, by Product Type 2020 & 2033
- Table 2: Global 5g Redcap Chip Volume K Forecast, by Product Type 2020 & 2033
- Table 3: Global 5g Redcap Chip Revenue billion Forecast, by Frequency Band 2020 & 2033
- Table 4: Global 5g Redcap Chip Volume K Forecast, by Frequency Band 2020 & 2033
- Table 5: Global 5g Redcap Chip Revenue billion Forecast, by Application 2020 & 2033
- Table 6: Global 5g Redcap Chip Volume K Forecast, by Application 2020 & 2033
- Table 7: Global 5g Redcap Chip Revenue billion Forecast, by Distribution Channel 2020 & 2033
- Table 8: Global 5g Redcap Chip Volume K Forecast, by Distribution Channel 2020 & 2033
- Table 9: Global 5g Redcap Chip Revenue billion Forecast, by End User Industry 2020 & 2033
- Table 10: Global 5g Redcap Chip Volume K Forecast, by End User Industry 2020 & 2033
- Table 11: Global 5g Redcap Chip Revenue billion Forecast, by Region 2020 & 2033
- Table 12: Global 5g Redcap Chip Volume K Forecast, by Region 2020 & 2033
- Table 13: Global 5g Redcap Chip Revenue billion Forecast, by Product Type 2020 & 2033
- Table 14: Global 5g Redcap Chip Volume K Forecast, by Product Type 2020 & 2033
- Table 15: Global 5g Redcap Chip Revenue billion Forecast, by Frequency Band 2020 & 2033
- Table 16: Global 5g Redcap Chip Volume K Forecast, by Frequency Band 2020 & 2033
- Table 17: Global 5g Redcap Chip Revenue billion Forecast, by Application 2020 & 2033
- Table 18: Global 5g Redcap Chip Volume K Forecast, by Application 2020 & 2033
- Table 19: Global 5g Redcap Chip Revenue billion Forecast, by Distribution Channel 2020 & 2033
- Table 20: Global 5g Redcap Chip Volume K Forecast, by Distribution Channel 2020 & 2033
- Table 21: Global 5g Redcap Chip Revenue billion Forecast, by End User Industry 2020 & 2033
- Table 22: Global 5g Redcap Chip Volume K Forecast, by End User Industry 2020 & 2033
- Table 23: Global 5g Redcap Chip Revenue billion Forecast, by Country 2020 & 2033
- Table 24: Global 5g Redcap Chip Volume K Forecast, by Country 2020 & 2033
- Table 25: United States 5g Redcap Chip Revenue (billion) Forecast, by Application 2020 & 2033
- Table 26: United States 5g Redcap Chip Volume (K) Forecast, by Application 2020 & 2033
- Table 27: Canada 5g Redcap Chip Revenue (billion) Forecast, by Application 2020 & 2033
- Table 28: Canada 5g Redcap Chip Volume (K) Forecast, by Application 2020 & 2033
- Table 29: Mexico 5g Redcap Chip Revenue (billion) Forecast, by Application 2020 & 2033
- Table 30: Mexico 5g Redcap Chip Volume (K) Forecast, by Application 2020 & 2033
- Table 31: Global 5g Redcap Chip Revenue billion Forecast, by Product Type 2020 & 2033
- Table 32: Global 5g Redcap Chip Volume K Forecast, by Product Type 2020 & 2033
- Table 33: Global 5g Redcap Chip Revenue billion Forecast, by Frequency Band 2020 & 2033
- Table 34: Global 5g Redcap Chip Volume K Forecast, by Frequency Band 2020 & 2033
- Table 35: Global 5g Redcap Chip Revenue billion Forecast, by Application 2020 & 2033
- Table 36: Global 5g Redcap Chip Volume K Forecast, by Application 2020 & 2033
- Table 37: Global 5g Redcap Chip Revenue billion Forecast, by Distribution Channel 2020 & 2033
- Table 38: Global 5g Redcap Chip Volume K Forecast, by Distribution Channel 2020 & 2033
- Table 39: Global 5g Redcap Chip Revenue billion Forecast, by End User Industry 2020 & 2033
- Table 40: Global 5g Redcap Chip Volume K Forecast, by End User Industry 2020 & 2033
- Table 41: Global 5g Redcap Chip Revenue billion Forecast, by Country 2020 & 2033
- Table 42: Global 5g Redcap Chip Volume K Forecast, by Country 2020 & 2033
- Table 43: Brazil 5g Redcap Chip Revenue (billion) Forecast, by Application 2020 & 2033
- Table 44: Brazil 5g Redcap Chip Volume (K) Forecast, by Application 2020 & 2033
- Table 45: Argentina 5g Redcap Chip Revenue (billion) Forecast, by Application 2020 & 2033
- Table 46: Argentina 5g Redcap Chip Volume (K) Forecast, by Application 2020 & 2033
- Table 47: Rest of South America 5g Redcap Chip Revenue (billion) Forecast, by Application 2020 & 2033
- Table 48: Rest of South America 5g Redcap Chip Volume (K) Forecast, by Application 2020 & 2033
- Table 49: Global 5g Redcap Chip Revenue billion Forecast, by Product Type 2020 & 2033
- Table 50: Global 5g Redcap Chip Volume K Forecast, by Product Type 2020 & 2033
- Table 51: Global 5g Redcap Chip Revenue billion Forecast, by Frequency Band 2020 & 2033
- Table 52: Global 5g Redcap Chip Volume K Forecast, by Frequency Band 2020 & 2033
- Table 53: Global 5g Redcap Chip Revenue billion Forecast, by Application 2020 & 2033
- Table 54: Global 5g Redcap Chip Volume K Forecast, by Application 2020 & 2033
- Table 55: Global 5g Redcap Chip Revenue billion Forecast, by Distribution Channel 2020 & 2033
- Table 56: Global 5g Redcap Chip Volume K Forecast, by Distribution Channel 2020 & 2033
- Table 57: Global 5g Redcap Chip Revenue billion Forecast, by End User Industry 2020 & 2033
- Table 58: Global 5g Redcap Chip Volume K Forecast, by End User Industry 2020 & 2033
- Table 59: Global 5g Redcap Chip Revenue billion Forecast, by Country 2020 & 2033
- Table 60: Global 5g Redcap Chip Volume K Forecast, by Country 2020 & 2033
- Table 61: United Kingdom 5g Redcap Chip Revenue (billion) Forecast, by Application 2020 & 2033
- Table 62: United Kingdom 5g Redcap Chip Volume (K) Forecast, by Application 2020 & 2033
- Table 63: Germany 5g Redcap Chip Revenue (billion) Forecast, by Application 2020 & 2033
- Table 64: Germany 5g Redcap Chip Volume (K) Forecast, by Application 2020 & 2033
- Table 65: France 5g Redcap Chip Revenue (billion) Forecast, by Application 2020 & 2033
- Table 66: France 5g Redcap Chip Volume (K) Forecast, by Application 2020 & 2033
- Table 67: Italy 5g Redcap Chip Revenue (billion) Forecast, by Application 2020 & 2033
- Table 68: Italy 5g Redcap Chip Volume (K) Forecast, by Application 2020 & 2033
- Table 69: Spain 5g Redcap Chip Revenue (billion) Forecast, by Application 2020 & 2033
- Table 70: Spain 5g Redcap Chip Volume (K) Forecast, by Application 2020 & 2033
- Table 71: Russia 5g Redcap Chip Revenue (billion) Forecast, by Application 2020 & 2033
- Table 72: Russia 5g Redcap Chip Volume (K) Forecast, by Application 2020 & 2033
- Table 73: Benelux 5g Redcap Chip Revenue (billion) Forecast, by Application 2020 & 2033
- Table 74: Benelux 5g Redcap Chip Volume (K) Forecast, by Application 2020 & 2033
- Table 75: Nordics 5g Redcap Chip Revenue (billion) Forecast, by Application 2020 & 2033
- Table 76: Nordics 5g Redcap Chip Volume (K) Forecast, by Application 2020 & 2033
- Table 77: Rest of Europe 5g Redcap Chip Revenue (billion) Forecast, by Application 2020 & 2033
- Table 78: Rest of Europe 5g Redcap Chip Volume (K) Forecast, by Application 2020 & 2033
- Table 79: Global 5g Redcap Chip Revenue billion Forecast, by Product Type 2020 & 2033
- Table 80: Global 5g Redcap Chip Volume K Forecast, by Product Type 2020 & 2033
- Table 81: Global 5g Redcap Chip Revenue billion Forecast, by Frequency Band 2020 & 2033
- Table 82: Global 5g Redcap Chip Volume K Forecast, by Frequency Band 2020 & 2033
- Table 83: Global 5g Redcap Chip Revenue billion Forecast, by Application 2020 & 2033
- Table 84: Global 5g Redcap Chip Volume K Forecast, by Application 2020 & 2033
- Table 85: Global 5g Redcap Chip Revenue billion Forecast, by Distribution Channel 2020 & 2033
- Table 86: Global 5g Redcap Chip Volume K Forecast, by Distribution Channel 2020 & 2033
- Table 87: Global 5g Redcap Chip Revenue billion Forecast, by End User Industry 2020 & 2033
- Table 88: Global 5g Redcap Chip Volume K Forecast, by End User Industry 2020 & 2033
- Table 89: Global 5g Redcap Chip Revenue billion Forecast, by Country 2020 & 2033
- Table 90: Global 5g Redcap Chip Volume K Forecast, by Country 2020 & 2033
- Table 91: Turkey 5g Redcap Chip Revenue (billion) Forecast, by Application 2020 & 2033
- Table 92: Turkey 5g Redcap Chip Volume (K) Forecast, by Application 2020 & 2033
- Table 93: Israel 5g Redcap Chip Revenue (billion) Forecast, by Application 2020 & 2033
- Table 94: Israel 5g Redcap Chip Volume (K) Forecast, by Application 2020 & 2033
- Table 95: GCC 5g Redcap Chip Revenue (billion) Forecast, by Application 2020 & 2033
- Table 96: GCC 5g Redcap Chip Volume (K) Forecast, by Application 2020 & 2033
- Table 97: North Africa 5g Redcap Chip Revenue (billion) Forecast, by Application 2020 & 2033
- Table 98: North Africa 5g Redcap Chip Volume (K) Forecast, by Application 2020 & 2033
- Table 99: South Africa 5g Redcap Chip Revenue (billion) Forecast, by Application 2020 & 2033
- Table 100: South Africa 5g Redcap Chip Volume (K) Forecast, by Application 2020 & 2033
- Table 101: Rest of Middle East & Africa 5g Redcap Chip Revenue (billion) Forecast, by Application 2020 & 2033
- Table 102: Rest of Middle East & Africa 5g Redcap Chip Volume (K) Forecast, by Application 2020 & 2033
- Table 103: Global 5g Redcap Chip Revenue billion Forecast, by Product Type 2020 & 2033
- Table 104: Global 5g Redcap Chip Volume K Forecast, by Product Type 2020 & 2033
- Table 105: Global 5g Redcap Chip Revenue billion Forecast, by Frequency Band 2020 & 2033
- Table 106: Global 5g Redcap Chip Volume K Forecast, by Frequency Band 2020 & 2033
- Table 107: Global 5g Redcap Chip Revenue billion Forecast, by Application 2020 & 2033
- Table 108: Global 5g Redcap Chip Volume K Forecast, by Application 2020 & 2033
- Table 109: Global 5g Redcap Chip Revenue billion Forecast, by Distribution Channel 2020 & 2033
- Table 110: Global 5g Redcap Chip Volume K Forecast, by Distribution Channel 2020 & 2033
- Table 111: Global 5g Redcap Chip Revenue billion Forecast, by End User Industry 2020 & 2033
- Table 112: Global 5g Redcap Chip Volume K Forecast, by End User Industry 2020 & 2033
- Table 113: Global 5g Redcap Chip Revenue billion Forecast, by Country 2020 & 2033
- Table 114: Global 5g Redcap Chip Volume K Forecast, by Country 2020 & 2033
- Table 115: China 5g Redcap Chip Revenue (billion) Forecast, by Application 2020 & 2033
- Table 116: China 5g Redcap Chip Volume (K) Forecast, by Application 2020 & 2033
- Table 117: India 5g Redcap Chip Revenue (billion) Forecast, by Application 2020 & 2033
- Table 118: India 5g Redcap Chip Volume (K) Forecast, by Application 2020 & 2033
- Table 119: Japan 5g Redcap Chip Revenue (billion) Forecast, by Application 2020 & 2033
- Table 120: Japan 5g Redcap Chip Volume (K) Forecast, by Application 2020 & 2033
- Table 121: South Korea 5g Redcap Chip Revenue (billion) Forecast, by Application 2020 & 2033
- Table 122: South Korea 5g Redcap Chip Volume (K) Forecast, by Application 2020 & 2033
- Table 123: ASEAN 5g Redcap Chip Revenue (billion) Forecast, by Application 2020 & 2033
- Table 124: ASEAN 5g Redcap Chip Volume (K) Forecast, by Application 2020 & 2033
- Table 125: Oceania 5g Redcap Chip Revenue (billion) Forecast, by Application 2020 & 2033
- Table 126: Oceania 5g Redcap Chip Volume (K) Forecast, by Application 2020 & 2033
- Table 127: Rest of Asia Pacific 5g Redcap Chip Revenue (billion) Forecast, by Application 2020 & 2033
- Table 128: Rest of Asia Pacific 5g Redcap Chip Volume (K) Forecast, by Application 2020 & 2033
Frequently Asked Questions
1. What is the projected Compound Annual Growth Rate (CAGR) of the 5g Redcap Chip?
The projected CAGR is approximately 17.4%.
2. Which companies are prominent players in the 5g Redcap Chip?
Key companies in the market include Qualcomm Technologies, Inc., MediaTek Inc., Samsung Electronics Co., Ltd., UNISOC Communications Inc., Sequans Communications S.A., ASR Microelectronics Co., Ltd., Huawei Technologies Co., Ltd., Intel Corporation, Nokia Corporation, Telefonaktiebolaget LM Ericsson, Others.
3. What are the main segments of the 5g Redcap Chip?
The market segments include Product Type, Frequency Band, Application, Distribution Channel, End User Industry.
4. Can you provide details about the market size?
The market size is estimated to be USD 36.29 billion as of 2022.
5. What are some drivers contributing to market growth?
N/A
6. What are the notable trends driving market growth?
N/A
7. Are there any restraints impacting market growth?
N/A
8. Can you provide examples of recent developments in the market?
N/A
9. What pricing options are available for accessing the report?
Pricing options include single-user, multi-user, and enterprise licenses priced at USD 3950.00, USD 5925.00, and USD 7900.00 respectively.
10. Is the market size provided in terms of value or volume?
The market size is provided in terms of value, measured in billion and volume, measured in K.
11. Are there any specific market keywords associated with the report?
Yes, the market keyword associated with the report is "5g Redcap Chip," which aids in identifying and referencing the specific market segment covered.
12. How do I determine which pricing option suits my needs best?
The pricing options vary based on user requirements and access needs. Individual users may opt for single-user licenses, while businesses requiring broader access may choose multi-user or enterprise licenses for cost-effective access to the report.
13. Are there any additional resources or data provided in the 5g Redcap Chip report?
While the report offers comprehensive insights, it's advisable to review the specific contents or supplementary materials provided to ascertain if additional resources or data are available.
14. How can I stay updated on further developments or reports in the 5g Redcap Chip?
To stay informed about further developments, trends, and reports in the 5g Redcap Chip, consider subscribing to industry newsletters, following relevant companies and organizations, or regularly checking reputable industry news sources and publications.
Methodology
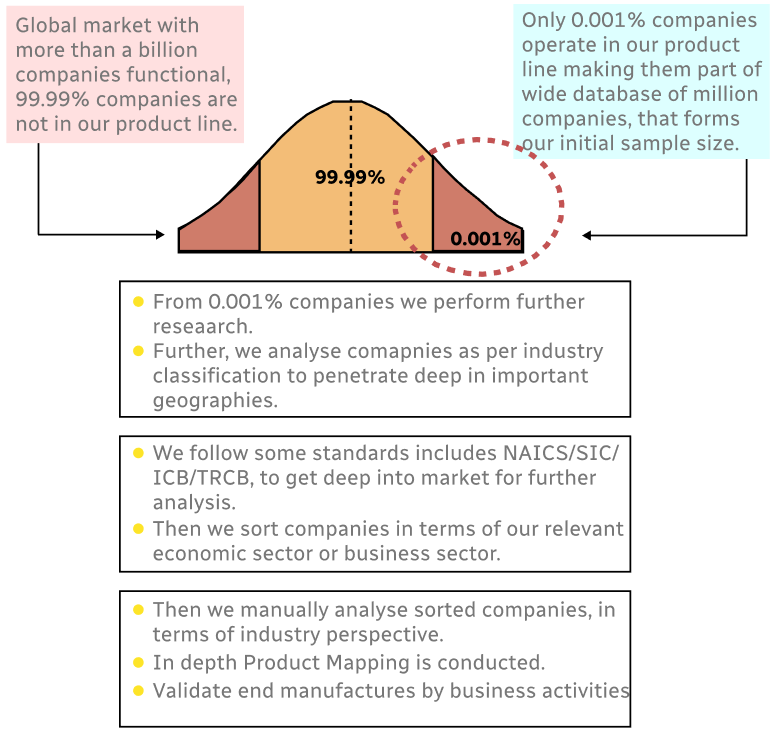
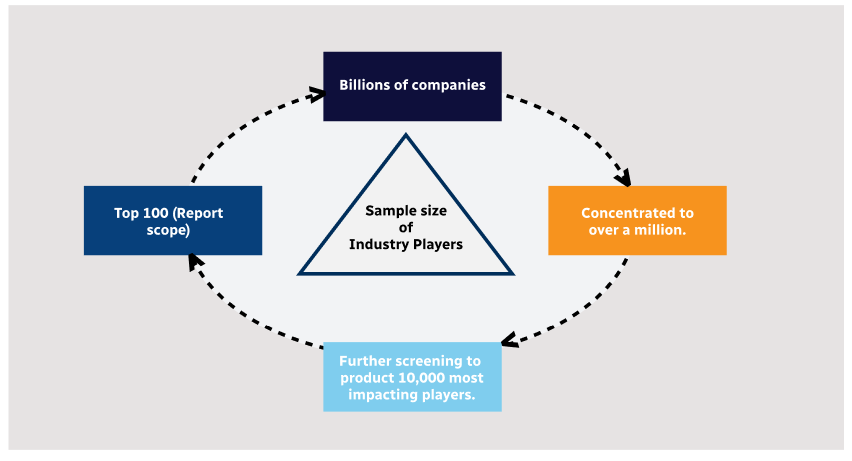
Step 1 - Identification of Relevant Samples Size from Population Database
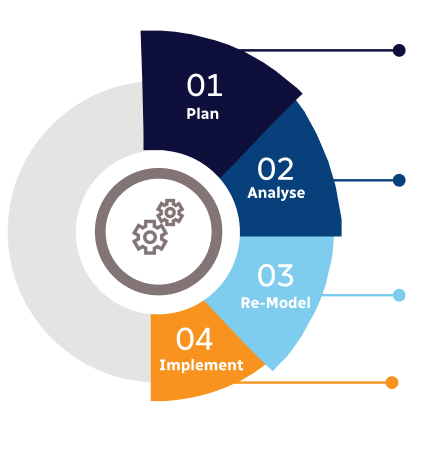
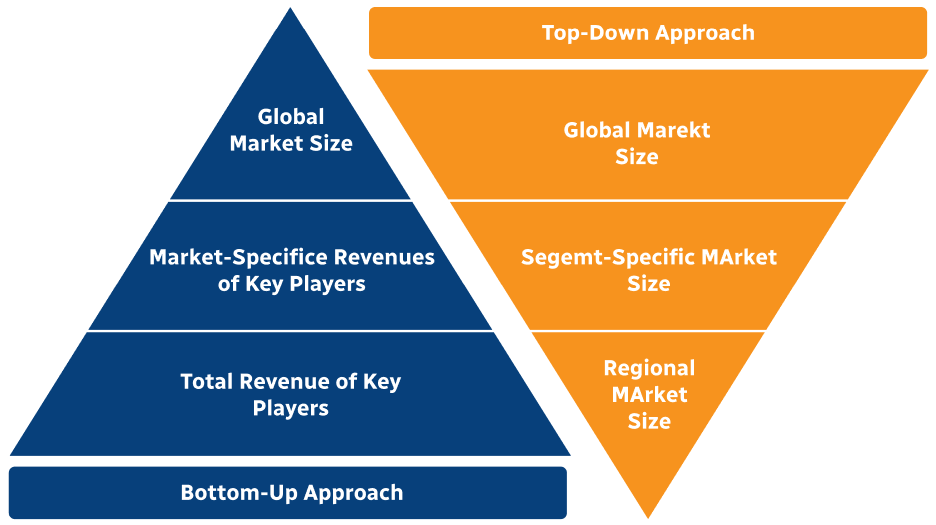
Step 2 - Approaches for Defining Global Market Size (Value, Volume* & Price*)
Note*: In applicable scenarios
Step 3 - Data Sources
Primary Research
- Web Analytics
- Survey Reports
- Research Institute
- Latest Research Reports
- Opinion Leaders
Secondary Research
- Annual Reports
- White Paper
- Latest Press Release
- Industry Association
- Paid Database
- Investor Presentations
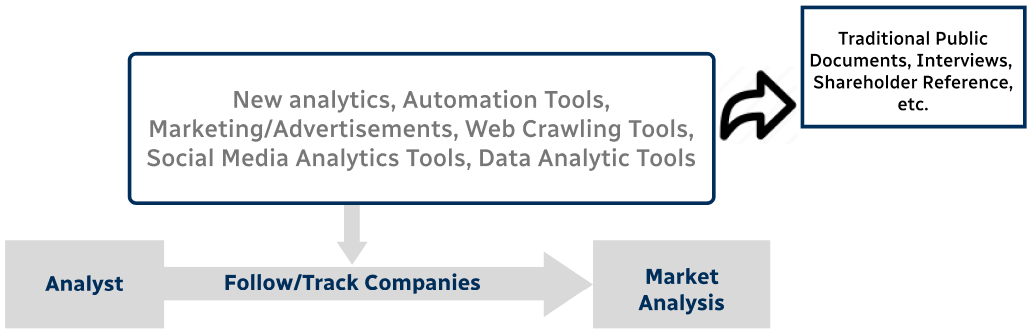
Step 4 - Data Triangulation
Involves using different sources of information in order to increase the validity of a study
These sources are likely to be stakeholders in a program - participants, other researchers, program staff, other community members, and so on.
Then we put all data in single framework & apply various statistical tools to find out the dynamic on the market.
During the analysis stage, feedback from the stakeholder groups would be compared to determine areas of agreement as well as areas of divergence