

Key Insights
The global Acetic Anhydride market is projected to reach $4.04 billion by 2025, exhibiting a robust Compound Annual Growth Rate (CAGR) of 4.9%. This significant growth is driven by escalating demand in key applications, including advanced coatings for automotive, construction, and industrial sectors, and the increasing use of plasticizers for enhanced plastic flexibility and durability. The pharmaceutical industry's continuous need for acetic anhydride in Active Pharmaceutical Ingredient (API) synthesis, alongside its role in cellulose acetate production for textiles and other materials, further underpins sustained market expansion. The Asia Pacific region is anticipated to lead growth due to rapid industrialization and expanding manufacturing capabilities.
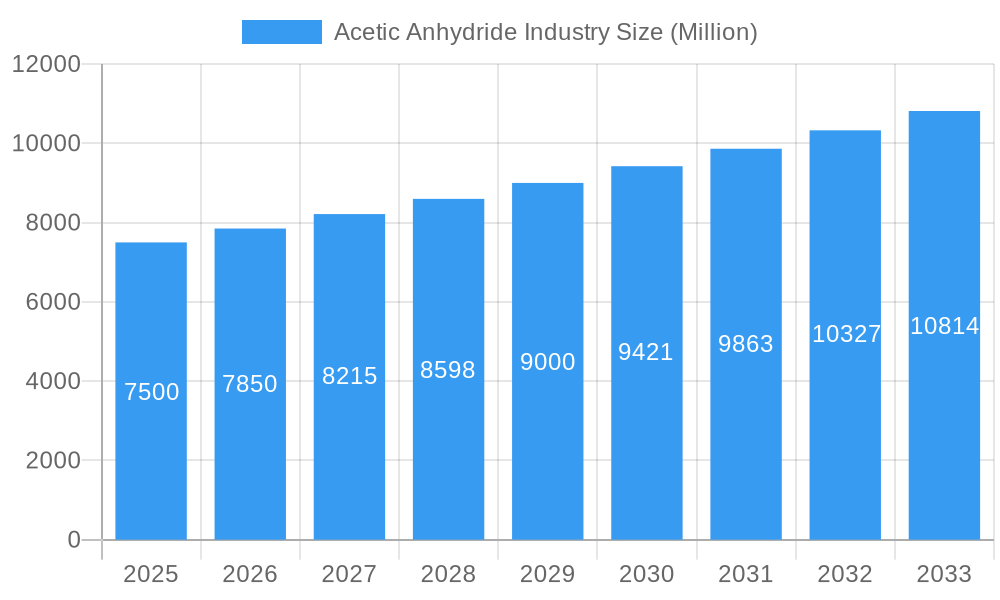
Acetic Anhydride Industry Market Size (In Billion)
While the market presents a positive outlook, it is subject to restraints such as raw material price volatility, particularly for methanol and acetic acid, impacting profit margins. Stringent environmental regulations necessitate investments in sustainable production processes. Nevertheless, ongoing innovation in manufacturing technologies and the discovery of novel applications are expected to counter these challenges. The competitive landscape features key players like BASF SE, DuPont, and Eastman Chemical Company, focusing on strategic expansions and product development. Optimizing production efficiency and exploring sustainable alternatives will be critical for sustained competitive advantage.
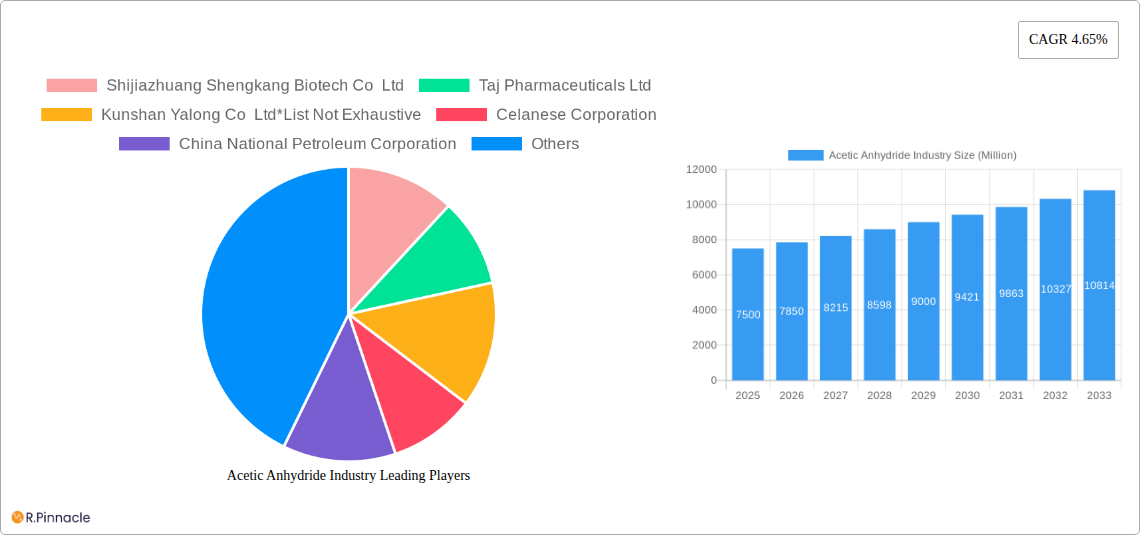
Acetic Anhydride Industry Company Market Share
This comprehensive market research report provides in-depth analysis and actionable insights into the global Acetic Anhydride industry. Covering the period from 2019 to 2033, with a base year of 2025, it offers crucial data and projections for the forecast period 2025–2033, building upon historical data from 2019–2024. Uncover market size, growth drivers, competitive strategies, and emerging trends within this essential chemical sector.
Acetic Anhydride Industry Market Structure & Innovation Trends
The global Acetic Anhydride market exhibits a moderately concentrated structure, with key players like Celanese Corporation and China National Petroleum Corporation holding significant market share. Innovation is primarily driven by advancements in production technologies, leading to higher purity grades and more sustainable manufacturing processes. Regulatory frameworks, particularly concerning environmental impact and chemical safety, play a crucial role in shaping market entry and operational standards. Substitutes for acetic anhydride exist, but their widespread adoption is limited by performance and cost-effectiveness in core applications. End-user demographics are increasingly influenced by growth in the pharmaceutical and agrochemical sectors, demanding higher quality and specialized grades. Merger and acquisition (M&A) activities are strategic, aiming to consolidate market presence, expand product portfolios, and gain access to new technologies or geographical markets. Recent M&A deal values have ranged from tens to hundreds of millions, reflecting the strategic importance of consolidating within this chemical segment.
- Market Concentration: Moderate, with top players dominating production capacity.
- Innovation Drivers: Greener production methods, increased purity, and enhanced application-specific formulations.
- Regulatory Impact: Stringent environmental and safety standards influencing production and product development.
- Product Substitutes: Limited by performance and cost in key applications.
- End-User Influence: Growing demand from pharmaceuticals and agrochemicals for specialized grades.
- M&A Activity: Strategic consolidation for market expansion and technological integration.
Acetic Anhydride Industry Market Dynamics & Trends
The Acetic Anhydride market is experiencing robust growth, propelled by several key dynamics and evolving trends. The primary growth drivers are the burgeoning pharmaceutical industry, where acetic anhydride is a critical intermediate in the synthesis of Active Pharmaceutical Ingredients (APIs) like aspirin and paracetamol, and the expanding agrochemical sector, utilizing it in the production of pesticides and herbicides. Technological disruptions are focused on improving the efficiency and sustainability of acetic anhydride production processes. For instance, advancements in carbonylation technology and the development of more energy-efficient catalysts are reducing operational costs and environmental footprints. Consumer preferences, though indirectly influencing the B2B market, are shifting towards products that utilize more environmentally friendly manufacturing, thereby indirectly encouraging greener acetic anhydride production. Competitive dynamics are characterized by price sensitivity, product quality, and supply chain reliability. Companies are investing heavily in R&D to enhance product purity and develop specialized grades for niche applications. The market penetration of acetic anhydride remains high in its core applications, indicating a mature yet continuously evolving market. The overall CAGR is projected to be around 4.5% over the forecast period, driven by consistent demand from its established applications and the emergence of new uses. The market value in the base year of 2025 is estimated to be in the range of $8.5 Billion.
Dominant Regions & Segments in Acetic Anhydride Industry
Asia Pacific stands as the dominant region in the global Acetic Anhydride market, with China leading as the largest producer and consumer. This dominance is attributed to several factors, including robust industrial growth, a well-established chemical manufacturing infrastructure, and significant demand from its vast domestic pharmaceutical and agrochemical industries. The economic policies in countries like China and India have been instrumental in fostering the growth of their chemical sectors, providing incentives for production and investment. Infrastructure development, including transportation networks and specialized chemical logistics, further supports the region's leading position.
Within the application segments, the Synthesizer application holds the largest market share, reflecting its indispensable role as a key intermediate in the synthesis of a wide array of chemicals, most notably pharmaceuticals. The Pharmaceutical end-user industry is consequently the most significant consumer of acetic anhydride, driven by the global demand for medications and healthcare products.
Asia Pacific Dominance:
- Key Drivers: Rapid industrialization, strong government support for chemical manufacturing, substantial domestic demand from pharmaceuticals and agrochemicals, and favorable economic policies.
- Leading Countries: China, India, and other Southeast Asian nations.
- Infrastructure: Well-developed manufacturing hubs and logistical networks.
Dominant Application Segment:
- Synthesizer: This segment benefits from the broad applicability of acetic anhydride as a crucial reagent in organic synthesis, leading to its widespread use across various chemical manufacturing processes.
- Market Drivers: Continuous innovation in synthetic chemistry, demand for complex organic molecules, and cost-effectiveness compared to alternative synthetic pathways.
Dominant End-user Industry:
- Pharmaceutical: This sector is the primary consumer, driven by its use in the production of essential medicines, pain relievers, and various other therapeutic compounds.
- Market Drivers: Increasing global healthcare expenditure, growing prevalence of chronic diseases, and the development of new drug molecules requiring acetic anhydride in their synthesis.
Acetic Anhydride Industry Product Innovations
Product innovation in the Acetic Anhydride industry is centered on enhancing purity levels to meet stringent pharmaceutical and electronic grade requirements. Companies are also focusing on developing more environmentally friendly production methods, such as those utilizing captured carbon or waste streams, which offer a competitive advantage and appeal to sustainability-conscious end-users. Advanced catalytic processes are leading to higher yields and reduced by-product formation. These innovations translate into improved cost-effectiveness and a reduced environmental footprint for downstream industries, solidifying acetic anhydride's market position.
Report Scope & Segmentation Analysis
This report provides an exhaustive analysis of the Acetic Anhydride market, segmented by application and end-user industry.
- Application Segments: The report details the Coating Material segment, analyzing its demand in paints and varnishes, and the Explosive segment, focusing on its role in energetic materials. The Plasticizer segment examines its use in polymer modification, while the Synthesizer segment, the largest, covers its role as a chemical intermediate. Other Applications encompass niche uses across various industries.
- End-user Industry Segments: The Tobacco segment analyzes demand for cellulose acetate production. The Pharmaceutical segment, a major consumer, details its use in API synthesis. The Laundry & Cleaning segment looks at its application in detergents and cleaning agents. The Agrochemical segment covers its use in pesticides and herbicides. The Textile segment explores its role in fiber production, and Other End-user Industries encompass emerging applications and miscellaneous uses. Each segment's market size, projected growth, and competitive landscape are meticulously analyzed.
Key Drivers of Acetic Anhydride Industry Growth
The growth of the Acetic Anhydride industry is propelled by several interconnected factors. The expanding pharmaceutical sector, particularly in emerging economies, directly fuels demand for acetic anhydride as a crucial intermediate in drug synthesis. Similarly, the agrochemical industry's growth, driven by increasing global food demand, necessitates the use of acetic anhydride for pesticide and herbicide production. Technological advancements in manufacturing processes, leading to cost efficiencies and higher purity grades, are also significant drivers, making it a more attractive option for various applications. Furthermore, supportive government policies in key regions, aimed at bolstering chemical manufacturing capabilities, indirectly contribute to market expansion.
Challenges in the Acetic Anhydride Industry Sector
Despite its growth, the Acetic Anhydride industry faces several challenges. Fluctuations in raw material prices, particularly methanol and carbon monoxide, can impact production costs and profitability. Stringent environmental regulations regarding emissions and waste disposal necessitate significant investment in pollution control technologies, adding to operational expenses. The volatile nature of downstream markets, such as the pharmaceutical and textile sectors, can lead to unpredictable demand patterns. Furthermore, intense competition among global players, often leading to price wars, can squeeze profit margins. The threat of alternative chemicals or production methods for specific applications also poses a continuous challenge.
Emerging Opportunities in Acetic Anhydride Industry
Emerging opportunities for the Acetic Anhydride industry lie in the development of bio-based acetic anhydride, driven by increasing demand for sustainable and renewable chemicals. Advancements in catalytic processes promise to further reduce energy consumption and environmental impact, creating a competitive edge. The growing use of acetic anhydride in niche applications, such as specialty polymers and advanced materials, presents new market avenues. Furthermore, the expansion of pharmaceutical manufacturing in emerging economies offers significant untapped potential for market growth. The focus on circular economy principles may also unlock opportunities for recycling and valorizing by-products.
Leading Players in the Acetic Anhydride Industry Market
- Celanese Corporation
- China National Petroleum Corporation
- BASF SE
- Eastman Chemical Company
- DuPont
- Daicel Corporation
- Jubilant Life Sciences
- Jiangsu Danhua Group Pvt Ltd
- Sipchem
- BP PLC
- Shijiazhuang Shengkang Biotech Co Ltd
- Taj Pharmaceuticals Ltd
- Kunshan Yalong Co Ltd
- Luna Chemical Industries Pvt Ltd
- Sigma Aldrich
Key Developments in Acetic Anhydride Industry Industry
- 2023: Celanese Corporation announces expansion of its acetic anhydride production capacity in North America to meet growing global demand.
- 2023: BASF SE invests in new catalyst technology to improve the sustainability of acetic anhydride production, reducing energy consumption by 15%.
- 2022: Jubilant Life Sciences inaugurates a new production facility for high-purity acetic anhydride, catering to the pharmaceutical sector.
- 2021: Daicel Corporation develops an innovative process for producing acetic anhydride from renewable feedstocks, demonstrating a commitment to green chemistry.
- 2020: China National Petroleum Corporation increases its acetic anhydride output to support the burgeoning domestic pharmaceutical industry's needs.
Future Outlook for Acetic Anhydride Industry Market
The future outlook for the Acetic Anhydride market is highly promising, driven by sustained demand from its core applications and the emergence of novel uses. Continued advancements in production technologies will enhance efficiency and sustainability, making the chemical more cost-effective and environmentally benign. The robust growth of the pharmaceutical and agrochemical sectors globally will remain a significant growth accelerator. Strategic investments in R&D, focusing on product diversification and greener manufacturing, will be crucial for companies to maintain their competitive edge. Emerging market penetration, particularly in Asia and Africa, combined with the increasing demand for specialty chemical grades, will further fuel market expansion, projecting a positive trajectory for the industry in the coming years.
Acetic Anhydride Industry Segmentation
-
1. Application
- 1.1. Coating Material
- 1.2. Explosive
- 1.3. Plasticizer
- 1.4. Synthesizer
- 1.5. Other Applications
-
2. End-user Industry
- 2.1. Tobacco
- 2.2. Pharmaceutical
- 2.3. Laundry & Cleaning
- 2.4. Agrochemical
- 2.5. Textile
- 2.6. Other End-user Industries
Acetic Anhydride Industry Segmentation By Geography
-
1. Asia Pacific
- 1.1. China
- 1.2. India
- 1.3. Japan
- 1.4. South Korea
- 1.5. Rest of Asia Pacific
-
2. North America
- 2.1. United States
- 2.2. Canada
- 2.3. Mexico
-
3. Europe
- 3.1. Germany
- 3.2. United Kingdom
- 3.3. Italy
- 3.4. France
- 3.5. Nordic Countries
- 3.6. Rest of Europe
-
4. South America
- 4.1. Brazil
- 4.2. Argentina
- 4.3. Rest of South America
- 5. Middle East
-
6. Saudi Arabia
- 6.1. South Africa
- 6.2. Rest of Middle East
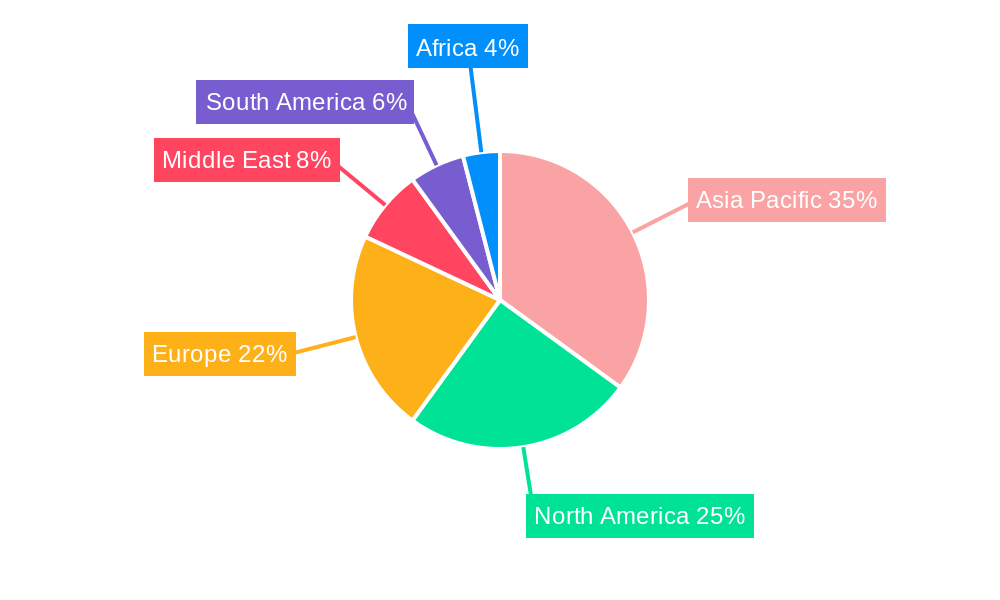
Acetic Anhydride Industry Regional Market Share
Geographic Coverage of Acetic Anhydride Industry
Acetic Anhydride Industry REPORT HIGHLIGHTS
| Aspects | Details |
|---|---|
| Study Period | 2020-2034 |
| Base Year | 2025 |
| Estimated Year | 2026 |
| Forecast Period | 2026-2034 |
| Historical Period | 2020-2025 |
| Growth Rate | CAGR of 4.9% from 2020-2034 |
| Segmentation |
|
Table of Contents
- 1. Introduction
- 1.1. Research Scope
- 1.2. Market Segmentation
- 1.3. Research Objective
- 1.4. Definitions and Assumptions
- 2. Executive Summary
- 2.1. Market Snapshot
- 3. Market Dynamics
- 3.1. Market Drivers
- 3.2. Market Restrains
- 3.3. Market Trends
- 3.4. Market Opportunities
- 4. Market Factor Analysis
- 4.1. Porters Five Forces
- 4.1.1. Bargaining Power of Suppliers
- 4.1.2. Bargaining Power of Buyers
- 4.1.3. Threat of New Entrants
- 4.1.4. Threat of Substitutes
- 4.1.5. Competitive Rivalry
- 4.2. PESTEL analysis
- 4.3. BCG Analysis
- 4.3.1. Stars (High Growth, High Market Share)
- 4.3.2. Cash Cows (Low Growth, High Market Share)
- 4.3.3. Question Mark (High Growth, Low Market Share)
- 4.3.4. Dogs (Low Growth, Low Market Share)
- 4.4. Ansoff Matrix Analysis
- 4.5. Supply Chain Analysis
- 4.6. Regulatory Landscape
- 4.7. Current Market Potential and Opportunity Assessment (TAM–SAM–SOM Framework)
- 4.8. PRI Analyst Note
- 4.1. Porters Five Forces
- 5. Market Analysis, Insights and Forecast 2021-2033
- 5.1. Market Analysis, Insights and Forecast - by Application
- 5.1.1. Coating Material
- 5.1.2. Explosive
- 5.1.3. Plasticizer
- 5.1.4. Synthesizer
- 5.1.5. Other Applications
- 5.2. Market Analysis, Insights and Forecast - by End-user Industry
- 5.2.1. Tobacco
- 5.2.2. Pharmaceutical
- 5.2.3. Laundry & Cleaning
- 5.2.4. Agrochemical
- 5.2.5. Textile
- 5.2.6. Other End-user Industries
- 5.3. Market Analysis, Insights and Forecast - by Region
- 5.3.1. Asia Pacific
- 5.3.2. North America
- 5.3.3. Europe
- 5.3.4. South America
- 5.3.5. Middle East
- 5.3.6. Saudi Arabia
- 5.1. Market Analysis, Insights and Forecast - by Application
- 6. Global Acetic Anhydride Industry Analysis, Insights and Forecast, 2021-2033
- 6.1. Market Analysis, Insights and Forecast - by Application
- 6.1.1. Coating Material
- 6.1.2. Explosive
- 6.1.3. Plasticizer
- 6.1.4. Synthesizer
- 6.1.5. Other Applications
- 6.2. Market Analysis, Insights and Forecast - by End-user Industry
- 6.2.1. Tobacco
- 6.2.2. Pharmaceutical
- 6.2.3. Laundry & Cleaning
- 6.2.4. Agrochemical
- 6.2.5. Textile
- 6.2.6. Other End-user Industries
- 6.1. Market Analysis, Insights and Forecast - by Application
- 7. Asia Pacific Acetic Anhydride Industry Analysis, Insights and Forecast, 2020-2032
- 7.1. Market Analysis, Insights and Forecast - by Application
- 7.1.1. Coating Material
- 7.1.2. Explosive
- 7.1.3. Plasticizer
- 7.1.4. Synthesizer
- 7.1.5. Other Applications
- 7.2. Market Analysis, Insights and Forecast - by End-user Industry
- 7.2.1. Tobacco
- 7.2.2. Pharmaceutical
- 7.2.3. Laundry & Cleaning
- 7.2.4. Agrochemical
- 7.2.5. Textile
- 7.2.6. Other End-user Industries
- 7.1. Market Analysis, Insights and Forecast - by Application
- 8. North America Acetic Anhydride Industry Analysis, Insights and Forecast, 2020-2032
- 8.1. Market Analysis, Insights and Forecast - by Application
- 8.1.1. Coating Material
- 8.1.2. Explosive
- 8.1.3. Plasticizer
- 8.1.4. Synthesizer
- 8.1.5. Other Applications
- 8.2. Market Analysis, Insights and Forecast - by End-user Industry
- 8.2.1. Tobacco
- 8.2.2. Pharmaceutical
- 8.2.3. Laundry & Cleaning
- 8.2.4. Agrochemical
- 8.2.5. Textile
- 8.2.6. Other End-user Industries
- 8.1. Market Analysis, Insights and Forecast - by Application
- 9. Europe Acetic Anhydride Industry Analysis, Insights and Forecast, 2020-2032
- 9.1. Market Analysis, Insights and Forecast - by Application
- 9.1.1. Coating Material
- 9.1.2. Explosive
- 9.1.3. Plasticizer
- 9.1.4. Synthesizer
- 9.1.5. Other Applications
- 9.2. Market Analysis, Insights and Forecast - by End-user Industry
- 9.2.1. Tobacco
- 9.2.2. Pharmaceutical
- 9.2.3. Laundry & Cleaning
- 9.2.4. Agrochemical
- 9.2.5. Textile
- 9.2.6. Other End-user Industries
- 9.1. Market Analysis, Insights and Forecast - by Application
- 10. South America Acetic Anhydride Industry Analysis, Insights and Forecast, 2020-2032
- 10.1. Market Analysis, Insights and Forecast - by Application
- 10.1.1. Coating Material
- 10.1.2. Explosive
- 10.1.3. Plasticizer
- 10.1.4. Synthesizer
- 10.1.5. Other Applications
- 10.2. Market Analysis, Insights and Forecast - by End-user Industry
- 10.2.1. Tobacco
- 10.2.2. Pharmaceutical
- 10.2.3. Laundry & Cleaning
- 10.2.4. Agrochemical
- 10.2.5. Textile
- 10.2.6. Other End-user Industries
- 10.1. Market Analysis, Insights and Forecast - by Application
- 11. Middle East Acetic Anhydride Industry Analysis, Insights and Forecast, 2020-2032
- 11.1. Market Analysis, Insights and Forecast - by Application
- 11.1.1. Coating Material
- 11.1.2. Explosive
- 11.1.3. Plasticizer
- 11.1.4. Synthesizer
- 11.1.5. Other Applications
- 11.2. Market Analysis, Insights and Forecast - by End-user Industry
- 11.2.1. Tobacco
- 11.2.2. Pharmaceutical
- 11.2.3. Laundry & Cleaning
- 11.2.4. Agrochemical
- 11.2.5. Textile
- 11.2.6. Other End-user Industries
- 11.1. Market Analysis, Insights and Forecast - by Application
- 12. Saudi Arabia Acetic Anhydride Industry Analysis, Insights and Forecast, 2020-2032
- 12.1. Market Analysis, Insights and Forecast - by Application
- 12.1.1. Coating Material
- 12.1.2. Explosive
- 12.1.3. Plasticizer
- 12.1.4. Synthesizer
- 12.1.5. Other Applications
- 12.2. Market Analysis, Insights and Forecast - by End-user Industry
- 12.2.1. Tobacco
- 12.2.2. Pharmaceutical
- 12.2.3. Laundry & Cleaning
- 12.2.4. Agrochemical
- 12.2.5. Textile
- 12.2.6. Other End-user Industries
- 12.1. Market Analysis, Insights and Forecast - by Application
- 13. Competitive Analysis
- 13.1. Company Profiles
- 13.1.1 Shijiazhuang Shengkang Biotech Co Ltd
- 13.1.1.1. Company Overview
- 13.1.1.2. Products
- 13.1.1.3. Company Financials
- 13.1.1.4. SWOT Analysis
- 13.1.2 Taj Pharmaceuticals Ltd
- 13.1.2.1. Company Overview
- 13.1.2.2. Products
- 13.1.2.3. Company Financials
- 13.1.2.4. SWOT Analysis
- 13.1.3 Kunshan Yalong Co Ltd*List Not Exhaustive
- 13.1.3.1. Company Overview
- 13.1.3.2. Products
- 13.1.3.3. Company Financials
- 13.1.3.4. SWOT Analysis
- 13.1.4 Celanese Corporation
- 13.1.4.1. Company Overview
- 13.1.4.2. Products
- 13.1.4.3. Company Financials
- 13.1.4.4. SWOT Analysis
- 13.1.5 China National Petroleum Corporation
- 13.1.5.1. Company Overview
- 13.1.5.2. Products
- 13.1.5.3. Company Financials
- 13.1.5.4. SWOT Analysis
- 13.1.6 Jiangsu Danhua Group Pvt Ltd
- 13.1.6.1. Company Overview
- 13.1.6.2. Products
- 13.1.6.3. Company Financials
- 13.1.6.4. SWOT Analysis
- 13.1.7 Jubilant Life Sciences
- 13.1.7.1. Company Overview
- 13.1.7.2. Products
- 13.1.7.3. Company Financials
- 13.1.7.4. SWOT Analysis
- 13.1.8 BASF SE
- 13.1.8.1. Company Overview
- 13.1.8.2. Products
- 13.1.8.3. Company Financials
- 13.1.8.4. SWOT Analysis
- 13.1.9 DuPont
- 13.1.9.1. Company Overview
- 13.1.9.2. Products
- 13.1.9.3. Company Financials
- 13.1.9.4. SWOT Analysis
- 13.1.10 Eastman Chemical Company
- 13.1.10.1. Company Overview
- 13.1.10.2. Products
- 13.1.10.3. Company Financials
- 13.1.10.4. SWOT Analysis
- 13.1.11 Daicel Corporation
- 13.1.11.1. Company Overview
- 13.1.11.2. Products
- 13.1.11.3. Company Financials
- 13.1.11.4. SWOT Analysis
- 13.1.12 Luna Chemical Industries Pvt Ltd
- 13.1.12.1. Company Overview
- 13.1.12.2. Products
- 13.1.12.3. Company Financials
- 13.1.12.4. SWOT Analysis
- 13.1.13 Sigma Aldrich
- 13.1.13.1. Company Overview
- 13.1.13.2. Products
- 13.1.13.3. Company Financials
- 13.1.13.4. SWOT Analysis
- 13.1.14 BP PLC
- 13.1.14.1. Company Overview
- 13.1.14.2. Products
- 13.1.14.3. Company Financials
- 13.1.14.4. SWOT Analysis
- 13.1.15 Sipchem
- 13.1.15.1. Company Overview
- 13.1.15.2. Products
- 13.1.15.3. Company Financials
- 13.1.15.4. SWOT Analysis
- 13.1.1 Shijiazhuang Shengkang Biotech Co Ltd
- 13.2. Market Entropy
- 13.2.1 Company's Key Areas Served
- 13.2.2 Recent Developments
- 13.3. Company Market Share Analysis 2025
- 13.3.1 Top 5 Companies Market Share Analysis
- 13.3.2 Top 3 Companies Market Share Analysis
- 13.4. List of Potential Customers
- 14. Research Methodology
List of Figures
- Figure 1: Global Acetic Anhydride Industry Revenue Breakdown (billion, %) by Region 2025 & 2033
- Figure 2: Global Acetic Anhydride Industry Volume Breakdown (Million, %) by Region 2025 & 2033
- Figure 3: Asia Pacific Acetic Anhydride Industry Revenue (billion), by Application 2025 & 2033
- Figure 4: Asia Pacific Acetic Anhydride Industry Volume (Million), by Application 2025 & 2033
- Figure 5: Asia Pacific Acetic Anhydride Industry Revenue Share (%), by Application 2025 & 2033
- Figure 6: Asia Pacific Acetic Anhydride Industry Volume Share (%), by Application 2025 & 2033
- Figure 7: Asia Pacific Acetic Anhydride Industry Revenue (billion), by End-user Industry 2025 & 2033
- Figure 8: Asia Pacific Acetic Anhydride Industry Volume (Million), by End-user Industry 2025 & 2033
- Figure 9: Asia Pacific Acetic Anhydride Industry Revenue Share (%), by End-user Industry 2025 & 2033
- Figure 10: Asia Pacific Acetic Anhydride Industry Volume Share (%), by End-user Industry 2025 & 2033
- Figure 11: Asia Pacific Acetic Anhydride Industry Revenue (billion), by Country 2025 & 2033
- Figure 12: Asia Pacific Acetic Anhydride Industry Volume (Million), by Country 2025 & 2033
- Figure 13: Asia Pacific Acetic Anhydride Industry Revenue Share (%), by Country 2025 & 2033
- Figure 14: Asia Pacific Acetic Anhydride Industry Volume Share (%), by Country 2025 & 2033
- Figure 15: North America Acetic Anhydride Industry Revenue (billion), by Application 2025 & 2033
- Figure 16: North America Acetic Anhydride Industry Volume (Million), by Application 2025 & 2033
- Figure 17: North America Acetic Anhydride Industry Revenue Share (%), by Application 2025 & 2033
- Figure 18: North America Acetic Anhydride Industry Volume Share (%), by Application 2025 & 2033
- Figure 19: North America Acetic Anhydride Industry Revenue (billion), by End-user Industry 2025 & 2033
- Figure 20: North America Acetic Anhydride Industry Volume (Million), by End-user Industry 2025 & 2033
- Figure 21: North America Acetic Anhydride Industry Revenue Share (%), by End-user Industry 2025 & 2033
- Figure 22: North America Acetic Anhydride Industry Volume Share (%), by End-user Industry 2025 & 2033
- Figure 23: North America Acetic Anhydride Industry Revenue (billion), by Country 2025 & 2033
- Figure 24: North America Acetic Anhydride Industry Volume (Million), by Country 2025 & 2033
- Figure 25: North America Acetic Anhydride Industry Revenue Share (%), by Country 2025 & 2033
- Figure 26: North America Acetic Anhydride Industry Volume Share (%), by Country 2025 & 2033
- Figure 27: Europe Acetic Anhydride Industry Revenue (billion), by Application 2025 & 2033
- Figure 28: Europe Acetic Anhydride Industry Volume (Million), by Application 2025 & 2033
- Figure 29: Europe Acetic Anhydride Industry Revenue Share (%), by Application 2025 & 2033
- Figure 30: Europe Acetic Anhydride Industry Volume Share (%), by Application 2025 & 2033
- Figure 31: Europe Acetic Anhydride Industry Revenue (billion), by End-user Industry 2025 & 2033
- Figure 32: Europe Acetic Anhydride Industry Volume (Million), by End-user Industry 2025 & 2033
- Figure 33: Europe Acetic Anhydride Industry Revenue Share (%), by End-user Industry 2025 & 2033
- Figure 34: Europe Acetic Anhydride Industry Volume Share (%), by End-user Industry 2025 & 2033
- Figure 35: Europe Acetic Anhydride Industry Revenue (billion), by Country 2025 & 2033
- Figure 36: Europe Acetic Anhydride Industry Volume (Million), by Country 2025 & 2033
- Figure 37: Europe Acetic Anhydride Industry Revenue Share (%), by Country 2025 & 2033
- Figure 38: Europe Acetic Anhydride Industry Volume Share (%), by Country 2025 & 2033
- Figure 39: South America Acetic Anhydride Industry Revenue (billion), by Application 2025 & 2033
- Figure 40: South America Acetic Anhydride Industry Volume (Million), by Application 2025 & 2033
- Figure 41: South America Acetic Anhydride Industry Revenue Share (%), by Application 2025 & 2033
- Figure 42: South America Acetic Anhydride Industry Volume Share (%), by Application 2025 & 2033
- Figure 43: South America Acetic Anhydride Industry Revenue (billion), by End-user Industry 2025 & 2033
- Figure 44: South America Acetic Anhydride Industry Volume (Million), by End-user Industry 2025 & 2033
- Figure 45: South America Acetic Anhydride Industry Revenue Share (%), by End-user Industry 2025 & 2033
- Figure 46: South America Acetic Anhydride Industry Volume Share (%), by End-user Industry 2025 & 2033
- Figure 47: South America Acetic Anhydride Industry Revenue (billion), by Country 2025 & 2033
- Figure 48: South America Acetic Anhydride Industry Volume (Million), by Country 2025 & 2033
- Figure 49: South America Acetic Anhydride Industry Revenue Share (%), by Country 2025 & 2033
- Figure 50: South America Acetic Anhydride Industry Volume Share (%), by Country 2025 & 2033
- Figure 51: Middle East Acetic Anhydride Industry Revenue (billion), by Application 2025 & 2033
- Figure 52: Middle East Acetic Anhydride Industry Volume (Million), by Application 2025 & 2033
- Figure 53: Middle East Acetic Anhydride Industry Revenue Share (%), by Application 2025 & 2033
- Figure 54: Middle East Acetic Anhydride Industry Volume Share (%), by Application 2025 & 2033
- Figure 55: Middle East Acetic Anhydride Industry Revenue (billion), by End-user Industry 2025 & 2033
- Figure 56: Middle East Acetic Anhydride Industry Volume (Million), by End-user Industry 2025 & 2033
- Figure 57: Middle East Acetic Anhydride Industry Revenue Share (%), by End-user Industry 2025 & 2033
- Figure 58: Middle East Acetic Anhydride Industry Volume Share (%), by End-user Industry 2025 & 2033
- Figure 59: Middle East Acetic Anhydride Industry Revenue (billion), by Country 2025 & 2033
- Figure 60: Middle East Acetic Anhydride Industry Volume (Million), by Country 2025 & 2033
- Figure 61: Middle East Acetic Anhydride Industry Revenue Share (%), by Country 2025 & 2033
- Figure 62: Middle East Acetic Anhydride Industry Volume Share (%), by Country 2025 & 2033
- Figure 63: Saudi Arabia Acetic Anhydride Industry Revenue (billion), by Application 2025 & 2033
- Figure 64: Saudi Arabia Acetic Anhydride Industry Volume (Million), by Application 2025 & 2033
- Figure 65: Saudi Arabia Acetic Anhydride Industry Revenue Share (%), by Application 2025 & 2033
- Figure 66: Saudi Arabia Acetic Anhydride Industry Volume Share (%), by Application 2025 & 2033
- Figure 67: Saudi Arabia Acetic Anhydride Industry Revenue (billion), by End-user Industry 2025 & 2033
- Figure 68: Saudi Arabia Acetic Anhydride Industry Volume (Million), by End-user Industry 2025 & 2033
- Figure 69: Saudi Arabia Acetic Anhydride Industry Revenue Share (%), by End-user Industry 2025 & 2033
- Figure 70: Saudi Arabia Acetic Anhydride Industry Volume Share (%), by End-user Industry 2025 & 2033
- Figure 71: Saudi Arabia Acetic Anhydride Industry Revenue (billion), by Country 2025 & 2033
- Figure 72: Saudi Arabia Acetic Anhydride Industry Volume (Million), by Country 2025 & 2033
- Figure 73: Saudi Arabia Acetic Anhydride Industry Revenue Share (%), by Country 2025 & 2033
- Figure 74: Saudi Arabia Acetic Anhydride Industry Volume Share (%), by Country 2025 & 2033
List of Tables
- Table 1: Global Acetic Anhydride Industry Revenue billion Forecast, by Application 2020 & 2033
- Table 2: Global Acetic Anhydride Industry Volume Million Forecast, by Application 2020 & 2033
- Table 3: Global Acetic Anhydride Industry Revenue billion Forecast, by End-user Industry 2020 & 2033
- Table 4: Global Acetic Anhydride Industry Volume Million Forecast, by End-user Industry 2020 & 2033
- Table 5: Global Acetic Anhydride Industry Revenue billion Forecast, by Region 2020 & 2033
- Table 6: Global Acetic Anhydride Industry Volume Million Forecast, by Region 2020 & 2033
- Table 7: Global Acetic Anhydride Industry Revenue billion Forecast, by Application 2020 & 2033
- Table 8: Global Acetic Anhydride Industry Volume Million Forecast, by Application 2020 & 2033
- Table 9: Global Acetic Anhydride Industry Revenue billion Forecast, by End-user Industry 2020 & 2033
- Table 10: Global Acetic Anhydride Industry Volume Million Forecast, by End-user Industry 2020 & 2033
- Table 11: Global Acetic Anhydride Industry Revenue billion Forecast, by Country 2020 & 2033
- Table 12: Global Acetic Anhydride Industry Volume Million Forecast, by Country 2020 & 2033
- Table 13: China Acetic Anhydride Industry Revenue (billion) Forecast, by Application 2020 & 2033
- Table 14: China Acetic Anhydride Industry Volume (Million) Forecast, by Application 2020 & 2033
- Table 15: India Acetic Anhydride Industry Revenue (billion) Forecast, by Application 2020 & 2033
- Table 16: India Acetic Anhydride Industry Volume (Million) Forecast, by Application 2020 & 2033
- Table 17: Japan Acetic Anhydride Industry Revenue (billion) Forecast, by Application 2020 & 2033
- Table 18: Japan Acetic Anhydride Industry Volume (Million) Forecast, by Application 2020 & 2033
- Table 19: South Korea Acetic Anhydride Industry Revenue (billion) Forecast, by Application 2020 & 2033
- Table 20: South Korea Acetic Anhydride Industry Volume (Million) Forecast, by Application 2020 & 2033
- Table 21: Rest of Asia Pacific Acetic Anhydride Industry Revenue (billion) Forecast, by Application 2020 & 2033
- Table 22: Rest of Asia Pacific Acetic Anhydride Industry Volume (Million) Forecast, by Application 2020 & 2033
- Table 23: Global Acetic Anhydride Industry Revenue billion Forecast, by Application 2020 & 2033
- Table 24: Global Acetic Anhydride Industry Volume Million Forecast, by Application 2020 & 2033
- Table 25: Global Acetic Anhydride Industry Revenue billion Forecast, by End-user Industry 2020 & 2033
- Table 26: Global Acetic Anhydride Industry Volume Million Forecast, by End-user Industry 2020 & 2033
- Table 27: Global Acetic Anhydride Industry Revenue billion Forecast, by Country 2020 & 2033
- Table 28: Global Acetic Anhydride Industry Volume Million Forecast, by Country 2020 & 2033
- Table 29: United States Acetic Anhydride Industry Revenue (billion) Forecast, by Application 2020 & 2033
- Table 30: United States Acetic Anhydride Industry Volume (Million) Forecast, by Application 2020 & 2033
- Table 31: Canada Acetic Anhydride Industry Revenue (billion) Forecast, by Application 2020 & 2033
- Table 32: Canada Acetic Anhydride Industry Volume (Million) Forecast, by Application 2020 & 2033
- Table 33: Mexico Acetic Anhydride Industry Revenue (billion) Forecast, by Application 2020 & 2033
- Table 34: Mexico Acetic Anhydride Industry Volume (Million) Forecast, by Application 2020 & 2033
- Table 35: Global Acetic Anhydride Industry Revenue billion Forecast, by Application 2020 & 2033
- Table 36: Global Acetic Anhydride Industry Volume Million Forecast, by Application 2020 & 2033
- Table 37: Global Acetic Anhydride Industry Revenue billion Forecast, by End-user Industry 2020 & 2033
- Table 38: Global Acetic Anhydride Industry Volume Million Forecast, by End-user Industry 2020 & 2033
- Table 39: Global Acetic Anhydride Industry Revenue billion Forecast, by Country 2020 & 2033
- Table 40: Global Acetic Anhydride Industry Volume Million Forecast, by Country 2020 & 2033
- Table 41: Germany Acetic Anhydride Industry Revenue (billion) Forecast, by Application 2020 & 2033
- Table 42: Germany Acetic Anhydride Industry Volume (Million) Forecast, by Application 2020 & 2033
- Table 43: United Kingdom Acetic Anhydride Industry Revenue (billion) Forecast, by Application 2020 & 2033
- Table 44: United Kingdom Acetic Anhydride Industry Volume (Million) Forecast, by Application 2020 & 2033
- Table 45: Italy Acetic Anhydride Industry Revenue (billion) Forecast, by Application 2020 & 2033
- Table 46: Italy Acetic Anhydride Industry Volume (Million) Forecast, by Application 2020 & 2033
- Table 47: France Acetic Anhydride Industry Revenue (billion) Forecast, by Application 2020 & 2033
- Table 48: France Acetic Anhydride Industry Volume (Million) Forecast, by Application 2020 & 2033
- Table 49: Nordic Countries Acetic Anhydride Industry Revenue (billion) Forecast, by Application 2020 & 2033
- Table 50: Nordic Countries Acetic Anhydride Industry Volume (Million) Forecast, by Application 2020 & 2033
- Table 51: Rest of Europe Acetic Anhydride Industry Revenue (billion) Forecast, by Application 2020 & 2033
- Table 52: Rest of Europe Acetic Anhydride Industry Volume (Million) Forecast, by Application 2020 & 2033
- Table 53: Global Acetic Anhydride Industry Revenue billion Forecast, by Application 2020 & 2033
- Table 54: Global Acetic Anhydride Industry Volume Million Forecast, by Application 2020 & 2033
- Table 55: Global Acetic Anhydride Industry Revenue billion Forecast, by End-user Industry 2020 & 2033
- Table 56: Global Acetic Anhydride Industry Volume Million Forecast, by End-user Industry 2020 & 2033
- Table 57: Global Acetic Anhydride Industry Revenue billion Forecast, by Country 2020 & 2033
- Table 58: Global Acetic Anhydride Industry Volume Million Forecast, by Country 2020 & 2033
- Table 59: Brazil Acetic Anhydride Industry Revenue (billion) Forecast, by Application 2020 & 2033
- Table 60: Brazil Acetic Anhydride Industry Volume (Million) Forecast, by Application 2020 & 2033
- Table 61: Argentina Acetic Anhydride Industry Revenue (billion) Forecast, by Application 2020 & 2033
- Table 62: Argentina Acetic Anhydride Industry Volume (Million) Forecast, by Application 2020 & 2033
- Table 63: Rest of South America Acetic Anhydride Industry Revenue (billion) Forecast, by Application 2020 & 2033
- Table 64: Rest of South America Acetic Anhydride Industry Volume (Million) Forecast, by Application 2020 & 2033
- Table 65: Global Acetic Anhydride Industry Revenue billion Forecast, by Application 2020 & 2033
- Table 66: Global Acetic Anhydride Industry Volume Million Forecast, by Application 2020 & 2033
- Table 67: Global Acetic Anhydride Industry Revenue billion Forecast, by End-user Industry 2020 & 2033
- Table 68: Global Acetic Anhydride Industry Volume Million Forecast, by End-user Industry 2020 & 2033
- Table 69: Global Acetic Anhydride Industry Revenue billion Forecast, by Country 2020 & 2033
- Table 70: Global Acetic Anhydride Industry Volume Million Forecast, by Country 2020 & 2033
- Table 71: Global Acetic Anhydride Industry Revenue billion Forecast, by Application 2020 & 2033
- Table 72: Global Acetic Anhydride Industry Volume Million Forecast, by Application 2020 & 2033
- Table 73: Global Acetic Anhydride Industry Revenue billion Forecast, by End-user Industry 2020 & 2033
- Table 74: Global Acetic Anhydride Industry Volume Million Forecast, by End-user Industry 2020 & 2033
- Table 75: Global Acetic Anhydride Industry Revenue billion Forecast, by Country 2020 & 2033
- Table 76: Global Acetic Anhydride Industry Volume Million Forecast, by Country 2020 & 2033
- Table 77: South Africa Acetic Anhydride Industry Revenue (billion) Forecast, by Application 2020 & 2033
- Table 78: South Africa Acetic Anhydride Industry Volume (Million) Forecast, by Application 2020 & 2033
- Table 79: Rest of Middle East Acetic Anhydride Industry Revenue (billion) Forecast, by Application 2020 & 2033
- Table 80: Rest of Middle East Acetic Anhydride Industry Volume (Million) Forecast, by Application 2020 & 2033
Frequently Asked Questions
1. What is the projected Compound Annual Growth Rate (CAGR) of the Acetic Anhydride Industry?
The projected CAGR is approximately 4.9%.
2. Which companies are prominent players in the Acetic Anhydride Industry?
Key companies in the market include Shijiazhuang Shengkang Biotech Co Ltd, Taj Pharmaceuticals Ltd, Kunshan Yalong Co Ltd*List Not Exhaustive, Celanese Corporation, China National Petroleum Corporation, Jiangsu Danhua Group Pvt Ltd, Jubilant Life Sciences, BASF SE, DuPont, Eastman Chemical Company, Daicel Corporation, Luna Chemical Industries Pvt Ltd, Sigma Aldrich, BP PLC, Sipchem.
3. What are the main segments of the Acetic Anhydride Industry?
The market segments include Application, End-user Industry.
4. Can you provide details about the market size?
The market size is estimated to be USD 4.04 billion as of 2022.
5. What are some drivers contributing to market growth?
; Growing Demand from the Pharmaceutical Industry for Acetic Anhydride as an Intermediate; Surging Demand from the Polymer/Resin Industry; Growing Use of Tetraacetylethylenediamine (TAED) in Laundry Detergents.
6. What are the notable trends driving market growth?
Increasing Demand from the Pharmaceutical Industry.
7. Are there any restraints impacting market growth?
; Adoption of E-cigarettes; Declining Usage of Acetic Anhydride for Cellulose Acetate Production.
8. Can you provide examples of recent developments in the market?
N/A
9. What pricing options are available for accessing the report?
Pricing options include single-user, multi-user, and enterprise licenses priced at USD 4750, USD 5250, and USD 8750 respectively.
10. Is the market size provided in terms of value or volume?
The market size is provided in terms of value, measured in billion and volume, measured in Million.
11. Are there any specific market keywords associated with the report?
Yes, the market keyword associated with the report is "Acetic Anhydride Industry," which aids in identifying and referencing the specific market segment covered.
12. How do I determine which pricing option suits my needs best?
The pricing options vary based on user requirements and access needs. Individual users may opt for single-user licenses, while businesses requiring broader access may choose multi-user or enterprise licenses for cost-effective access to the report.
13. Are there any additional resources or data provided in the Acetic Anhydride Industry report?
While the report offers comprehensive insights, it's advisable to review the specific contents or supplementary materials provided to ascertain if additional resources or data are available.
14. How can I stay updated on further developments or reports in the Acetic Anhydride Industry?
To stay informed about further developments, trends, and reports in the Acetic Anhydride Industry, consider subscribing to industry newsletters, following relevant companies and organizations, or regularly checking reputable industry news sources and publications.
Methodology
Step 1 - Identification of Relevant Samples Size from Population Database


Step 2 - Approaches for Defining Global Market Size (Value, Volume* & Price*)

Note*: In applicable scenarios
Step 3 - Data Sources
Primary Research
- Web Analytics
- Survey Reports
- Research Institute
- Latest Research Reports
- Opinion Leaders
Secondary Research
- Annual Reports
- White Paper
- Latest Press Release
- Industry Association
- Paid Database
- Investor Presentations

Step 4 - Data Triangulation
Involves using different sources of information in order to increase the validity of a study
These sources are likely to be stakeholders in a program - participants, other researchers, program staff, other community members, and so on.
Then we put all data in single framework & apply various statistical tools to find out the dynamic on the market.
During the analysis stage, feedback from the stakeholder groups would be compared to determine areas of agreement as well as areas of divergence