

Key Insights
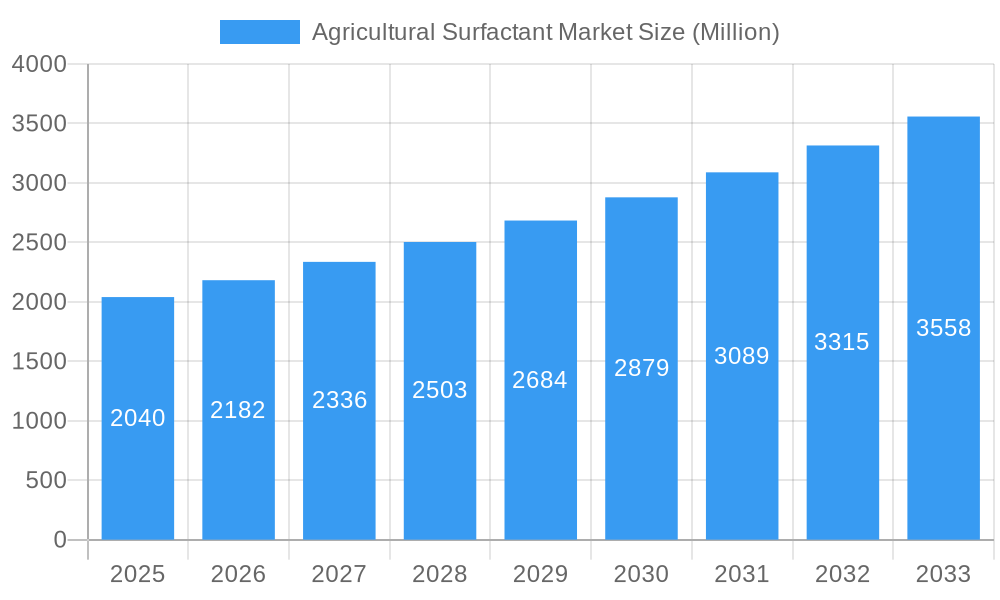
The global agricultural surfactant market, valued at $2.04 billion in 2025, is projected to experience robust growth, driven by the increasing demand for high-yield and quality crops. A compound annual growth rate (CAGR) of 6.70% from 2025 to 2033 indicates a significant market expansion. Several factors contribute to this growth. Firstly, the rising global population necessitates increased food production, leading to greater adoption of efficient agricultural practices that rely heavily on surfactants for improved pesticide and fertilizer efficacy. Secondly, the growing awareness of sustainable agriculture practices is fueling demand for bio-based surfactants, a segment expected to show particularly strong growth. Furthermore, advancements in surfactant technology, leading to the development of more targeted and effective formulations, are boosting market expansion. The market is segmented by type (anionic, nonionic, cationic, amphoteric), application (insecticide, herbicide, fungicide, other), substrate (synthetic, bio-based), and crop application (crop-based, non-crop-based), each offering unique growth opportunities. The leading players, including Tanatex Chemicals BV, Clariant, Solvay SA, and others, are constantly innovating to capture market share through product diversification and strategic partnerships. Geographical distribution shows strong growth potential across Asia-Pacific and South America, driven by expanding agricultural sectors and increasing adoption of modern farming techniques.
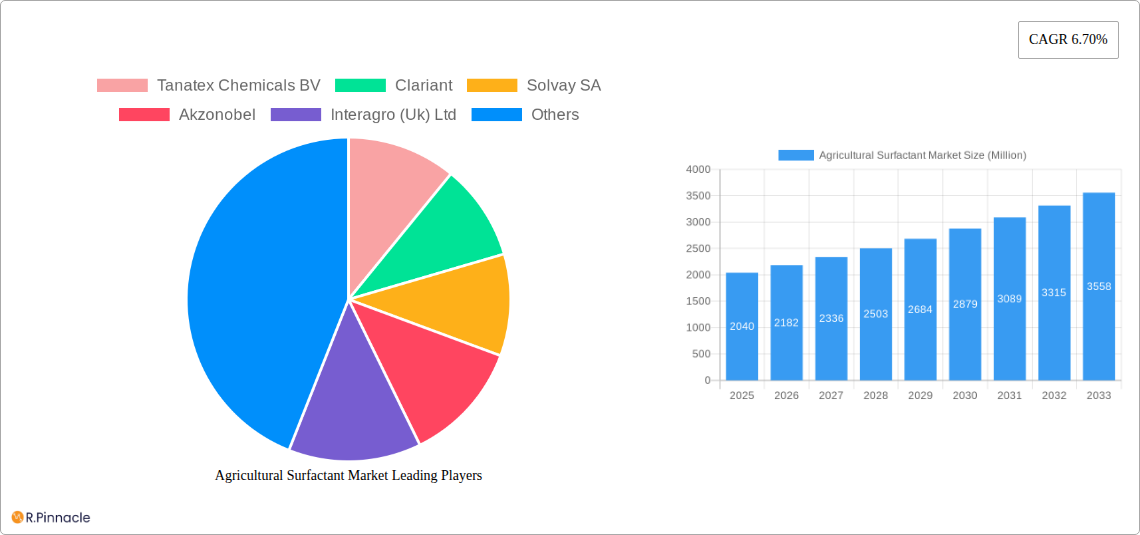
Agricultural Surfactant Market Market Size (In Billion)
The restraints on market growth are primarily related to the environmental concerns surrounding the use of certain surfactant types and potential regulatory changes. However, the industry is proactively addressing these challenges through the development of environmentally friendly alternatives and stringent quality control measures. Competition among established players and new entrants is intense, leading to price pressures and a constant need for innovation. Despite these challenges, the long-term outlook for the agricultural surfactant market remains positive, with substantial growth expected driven by increasing agricultural output demands and a global focus on improving crop yields sustainably. The market’s continued growth is expected to be further fueled by government initiatives promoting agricultural advancements and increased investment in research and development within the agricultural chemical sector.
Agricultural Surfactant Market Company Market Share
Agricultural Surfactant Market Report: 2019-2033
This comprehensive report provides a detailed analysis of the Agricultural Surfactant Market, offering invaluable insights for industry professionals, investors, and stakeholders. Covering the period 2019-2033, with a focus on 2025, this report examines market dynamics, competitive landscapes, and future growth potential. The report utilizes a robust methodology incorporating historical data (2019-2024), current estimates (2025), and future projections (2025-2033) to provide a complete market overview. The market size is projected to reach xx Million by 2033, showcasing significant growth opportunities.
Agricultural Surfactant Market Structure & Innovation Trends
This section analyzes the competitive landscape of the agricultural surfactant market, identifying key players and assessing market concentration. We delve into innovation drivers, regulatory influences, and the role of mergers and acquisitions (M&A) in shaping market dynamics. The report examines the impact of substitute products and evolving end-user demographics.
- Market Concentration: The market exhibits a moderately concentrated structure, with key players holding significant market share. The top five players collectively control approximately xx% of the market.
- Innovation Drivers: Sustainability concerns and the demand for higher efficacy are major innovation drivers. Companies are focusing on developing bio-based surfactants and formulations with enhanced performance characteristics.
- Regulatory Framework: Stringent environmental regulations and safety standards are shaping product development and market access. Compliance with these regulations is crucial for market success.
- M&A Activity: The market has witnessed significant M&A activity in recent years, driven by the desire for expansion and access to new technologies. Deal values have ranged from xx Million to xx Million, with a focus on consolidating market share.
- Product Substitutes: Competition from alternative crop protection technologies is a factor to consider. However, the unique properties of agricultural surfactants ensure sustained demand.
Agricultural Surfactant Market Dynamics & Trends
This section explores the key factors driving market growth, technological disruptions, evolving consumer preferences, and competitive dynamics within the agricultural surfactant market. The report examines specific market segments to pinpoint growth opportunities.
The market is expected to experience a CAGR of xx% during the forecast period (2025-2033), driven by factors such as increasing crop production, growing adoption of advanced agricultural practices, and rising demand for improved crop yields. Technological advancements, such as the development of bio-based surfactants and targeted delivery systems, are further fueling market growth. Consumer preference for sustainable and environmentally friendly agricultural products is also a significant driving force. However, price fluctuations in raw materials and intense competition among market players present challenges. Market penetration of bio-based surfactants is projected to reach xx% by 2033, highlighting the growing adoption of eco-friendly solutions.
Dominant Regions & Segments in Agricultural Surfactant Market
This section identifies the leading geographical regions and market segments within the agricultural surfactant market. We provide a detailed analysis of the factors contributing to regional and segment dominance.
Dominant Regions: [Insert dominant region, e.g., North America] holds the largest market share, driven by factors such as [list bullet points of key drivers for this region, e.g., high agricultural output, advanced farming techniques, supportive government policies]. [Insert second largest region, e.g., Europe] is another significant market, with growth driven by [list bullet points of key drivers, e.g., increasing focus on sustainable agriculture, stringent environmental regulations].
Dominant Segments:
- Type: Non-ionic surfactants dominate the market due to their versatility and efficacy in various applications.
- Application: The herbicide segment holds the largest market share, owing to the widespread use of herbicides in crop production.
- Substrate: Synthetic surfactants currently dominate, but bio-based surfactants are gaining traction due to increasing environmental concerns and sustainability initiatives.
- Crop Application: Crop-based applications hold the largest market share.
Agricultural Surfactant Market Product Innovations
Recent years have witnessed significant product innovations in the agricultural surfactant market. Companies are focusing on developing high-performance, sustainable products to meet the evolving needs of farmers and address environmental concerns. Key innovations include the development of bio-based surfactants, formulations with enhanced efficacy and reduced environmental impact, and targeted delivery systems for improved crop protection. These innovations contribute to increased efficiency and reduce the environmental footprint of agricultural practices, improving market competitiveness.
Report Scope & Segmentation Analysis
This report provides a comprehensive analysis of the agricultural surfactant market across various segments. Each segment is thoroughly evaluated, considering growth projections, market sizes, and competitive dynamics.
- Fruits and Vegetables (Non-crop-based): This segment is characterized by [explain segment characteristics, growth projections, and market size].
- Type (Anionic, Nonionic, Cationic, Amphoteric): Each type exhibits unique properties and applications, resulting in varying market sizes and growth rates. [Elaborate briefly on each type].
- Application (Insecticide, Herbicide, Fungicide, Other Applications): [Elaborate briefly on each application segment's market dynamics.]
- Substrate (Synthetic, Bio-based): The growing demand for sustainable solutions is driving the growth of the bio-based segment.
- Crop Application (Crop-based): This segment dominates the market due to [explain reasons].
Key Drivers of Agricultural Surfactant Market Growth
Several factors drive the growth of the agricultural surfactant market. These include:
- Increasing demand for higher crop yields: The global population's growth necessitates increased food production, driving the demand for agricultural inputs including surfactants.
- Growing adoption of modern farming techniques: Precision agriculture and other advanced techniques rely heavily on surfactants for effective pesticide and herbicide application.
- Favorable government policies and subsidies: Government support for sustainable agriculture and crop protection initiatives further contributes to market growth.
- Technological advancements: The development of bio-based and other high-performance surfactants increases efficiency and reduces the environmental impact.
Challenges in the Agricultural Surfactant Market Sector
Despite the positive outlook, the agricultural surfactant market faces challenges:
- Fluctuating raw material prices: The cost of raw materials significantly impacts surfactant prices, affecting profitability.
- Stringent environmental regulations: Compliance with increasingly stringent regulations adds to the cost of product development and market entry.
- Intense competition: The market is highly competitive, with numerous established players and new entrants vying for market share.
Emerging Opportunities in Agricultural Surfactant Market
The agricultural surfactant market presents several emerging opportunities:
- Growing demand for bio-based surfactants: The shift towards sustainable agriculture fuels the demand for environmentally friendly products.
- Expansion into new geographical markets: Untapped markets in developing countries offer significant growth potential.
- Development of innovative formulations: Advanced formulations with enhanced efficacy and targeted delivery systems are expected to drive growth.
Leading Players in the Agricultural Surfactant Market Market
- Tanatex Chemicals BV
- Clariant
- Solvay SA
- Akzonobel
- Interagro (Uk) Ltd
- Brandt Consolidated Inc
- Garrco Products Inc
- Lamberti SPA
- Kao Corporation
- Helena Chemical Company
- Air Products and Chemicals
- Nufarm Limited
- Wilbur-Ellis Company
- Huntsman
- Corteva Agriscience
- Croda International PLC
- Evonik Industries
- BASF SE
Key Developments in Agricultural Surfactant Market Industry
- March 2022: Dow announced a new product extension of VORASURF™ Silicone Surfactants. This signifies a shift towards sustainable solutions and highlights the growing demand for energy-efficient products.
- September 2021: BASF increased prices for non-ionic surfactants due to rising demand, reflecting the strong growth within the agricultural input sector.
- March 2021: BASF signed partnerships to expand its bio-based surfactants market position, emphasizing the increasing importance of sustainability in the industry.
Future Outlook for Agricultural Surfactant Market Market
The agricultural surfactant market is poised for continued growth, driven by increasing global food demand, advancements in agricultural technologies, and a rising focus on sustainable practices. Strategic opportunities exist for companies that can develop innovative, sustainable products that meet the evolving needs of farmers and address environmental concerns. The market's future growth will be significantly influenced by technological advancements, particularly in bio-based surfactants, and by the adoption of precision agriculture techniques.
Agricultural Surfactant Market Segmentation
- 1. Production Analysis
- 2. Consumption Analysis
- 3. Import Market Analysis (Value & Volume)
- 4. Export Market Analysis (Value & Volume)
- 5. Price Trend Analysis
Agricultural Surfactant Market Segmentation By Geography
-
1. North America
- 1.1. United States
- 1.2. Canada
- 1.3. Mexico
-
2. South America
- 2.1. Brazil
- 2.2. Argentina
- 2.3. Rest of South America
-
3. Europe
- 3.1. United Kingdom
- 3.2. Germany
- 3.3. France
- 3.4. Italy
- 3.5. Spain
- 3.6. Russia
- 3.7. Benelux
- 3.8. Nordics
- 3.9. Rest of Europe
-
4. Middle East & Africa
- 4.1. Turkey
- 4.2. Israel
- 4.3. GCC
- 4.4. North Africa
- 4.5. South Africa
- 4.6. Rest of Middle East & Africa
-
5. Asia Pacific
- 5.1. China
- 5.2. India
- 5.3. Japan
- 5.4. South Korea
- 5.5. ASEAN
- 5.6. Oceania
- 5.7. Rest of Asia Pacific
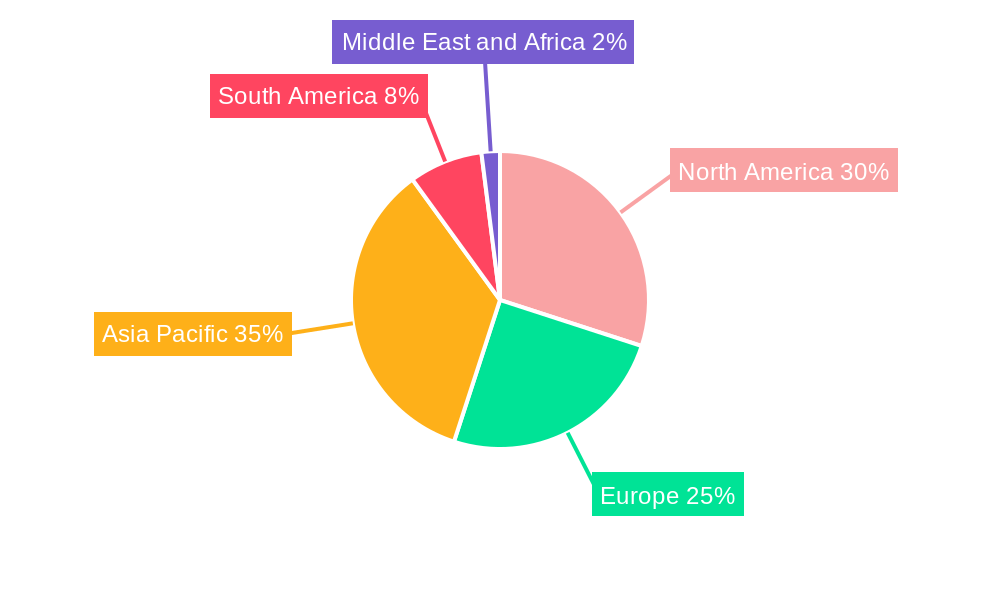
Agricultural Surfactant Market Regional Market Share
Geographic Coverage of Agricultural Surfactant Market
Agricultural Surfactant Market REPORT HIGHLIGHTS
| Aspects | Details |
|---|---|
| Study Period | 2020-2034 |
| Base Year | 2025 |
| Estimated Year | 2026 |
| Forecast Period | 2026-2034 |
| Historical Period | 2020-2025 |
| Growth Rate | CAGR of 6.70% from 2020-2034 |
| Segmentation |
|
Table of Contents
- 1. Introduction
- 1.1. Research Scope
- 1.2. Market Segmentation
- 1.3. Research Objective
- 1.4. Definitions and Assumptions
- 2. Executive Summary
- 2.1. Market Snapshot
- 3. Market Dynamics
- 3.1. Market Drivers
- 3.2. Market Restrains
- 3.3. Market Trends
- 3.4. Market Opportunities
- 4. Market Factor Analysis
- 4.1. Porters Five Forces
- 4.1.1. Bargaining Power of Suppliers
- 4.1.2. Bargaining Power of Buyers
- 4.1.3. Threat of New Entrants
- 4.1.4. Threat of Substitutes
- 4.1.5. Competitive Rivalry
- 4.2. PESTEL analysis
- 4.3. BCG Analysis
- 4.3.1. Stars (High Growth, High Market Share)
- 4.3.2. Cash Cows (Low Growth, High Market Share)
- 4.3.3. Question Mark (High Growth, Low Market Share)
- 4.3.4. Dogs (Low Growth, Low Market Share)
- 4.4. Ansoff Matrix Analysis
- 4.5. Supply Chain Analysis
- 4.6. Regulatory Landscape
- 4.7. Current Market Potential and Opportunity Assessment (TAM–SAM–SOM Framework)
- 4.8. PRI Analyst Note
- 4.1. Porters Five Forces
- 5. Market Analysis, Insights and Forecast 2021-2033
- 5.1. Market Analysis, Insights and Forecast - by Production Analysis
- 5.2. Market Analysis, Insights and Forecast - by Consumption Analysis
- 5.3. Market Analysis, Insights and Forecast - by Import Market Analysis (Value & Volume)
- 5.4. Market Analysis, Insights and Forecast - by Export Market Analysis (Value & Volume)
- 5.5. Market Analysis, Insights and Forecast - by Price Trend Analysis
- 5.6. Market Analysis, Insights and Forecast - by Region
- 5.6.1. North America
- 5.6.2. South America
- 5.6.3. Europe
- 5.6.4. Middle East & Africa
- 5.6.5. Asia Pacific
- 6. Global Agricultural Surfactant Market Analysis, Insights and Forecast, 2021-2033
- 6.1. Market Analysis, Insights and Forecast - by Production Analysis
- 6.2. Market Analysis, Insights and Forecast - by Consumption Analysis
- 6.3. Market Analysis, Insights and Forecast - by Import Market Analysis (Value & Volume)
- 6.4. Market Analysis, Insights and Forecast - by Export Market Analysis (Value & Volume)
- 6.5. Market Analysis, Insights and Forecast - by Price Trend Analysis
- 7. North America Agricultural Surfactant Market Analysis, Insights and Forecast, 2020-2032
- 7.1. Market Analysis, Insights and Forecast - by Production Analysis
- 7.2. Market Analysis, Insights and Forecast - by Consumption Analysis
- 7.3. Market Analysis, Insights and Forecast - by Import Market Analysis (Value & Volume)
- 7.4. Market Analysis, Insights and Forecast - by Export Market Analysis (Value & Volume)
- 7.5. Market Analysis, Insights and Forecast - by Price Trend Analysis
- 8. South America Agricultural Surfactant Market Analysis, Insights and Forecast, 2020-2032
- 8.1. Market Analysis, Insights and Forecast - by Production Analysis
- 8.2. Market Analysis, Insights and Forecast - by Consumption Analysis
- 8.3. Market Analysis, Insights and Forecast - by Import Market Analysis (Value & Volume)
- 8.4. Market Analysis, Insights and Forecast - by Export Market Analysis (Value & Volume)
- 8.5. Market Analysis, Insights and Forecast - by Price Trend Analysis
- 9. Europe Agricultural Surfactant Market Analysis, Insights and Forecast, 2020-2032
- 9.1. Market Analysis, Insights and Forecast - by Production Analysis
- 9.2. Market Analysis, Insights and Forecast - by Consumption Analysis
- 9.3. Market Analysis, Insights and Forecast - by Import Market Analysis (Value & Volume)
- 9.4. Market Analysis, Insights and Forecast - by Export Market Analysis (Value & Volume)
- 9.5. Market Analysis, Insights and Forecast - by Price Trend Analysis
- 10. Middle East & Africa Agricultural Surfactant Market Analysis, Insights and Forecast, 2020-2032
- 10.1. Market Analysis, Insights and Forecast - by Production Analysis
- 10.2. Market Analysis, Insights and Forecast - by Consumption Analysis
- 10.3. Market Analysis, Insights and Forecast - by Import Market Analysis (Value & Volume)
- 10.4. Market Analysis, Insights and Forecast - by Export Market Analysis (Value & Volume)
- 10.5. Market Analysis, Insights and Forecast - by Price Trend Analysis
- 11. Asia Pacific Agricultural Surfactant Market Analysis, Insights and Forecast, 2020-2032
- 11.1. Market Analysis, Insights and Forecast - by Production Analysis
- 11.2. Market Analysis, Insights and Forecast - by Consumption Analysis
- 11.3. Market Analysis, Insights and Forecast - by Import Market Analysis (Value & Volume)
- 11.4. Market Analysis, Insights and Forecast - by Export Market Analysis (Value & Volume)
- 11.5. Market Analysis, Insights and Forecast - by Price Trend Analysis
- 12. Competitive Analysis
- 12.1. Company Profiles
- 12.1.1 Tanatex Chemicals BV
- 12.1.1.1. Company Overview
- 12.1.1.2. Products
- 12.1.1.3. Company Financials
- 12.1.1.4. SWOT Analysis
- 12.1.2 Clariant
- 12.1.2.1. Company Overview
- 12.1.2.2. Products
- 12.1.2.3. Company Financials
- 12.1.2.4. SWOT Analysis
- 12.1.3 Solvay SA
- 12.1.3.1. Company Overview
- 12.1.3.2. Products
- 12.1.3.3. Company Financials
- 12.1.3.4. SWOT Analysis
- 12.1.4 Akzonobel
- 12.1.4.1. Company Overview
- 12.1.4.2. Products
- 12.1.4.3. Company Financials
- 12.1.4.4. SWOT Analysis
- 12.1.5 Interagro (Uk) Ltd
- 12.1.5.1. Company Overview
- 12.1.5.2. Products
- 12.1.5.3. Company Financials
- 12.1.5.4. SWOT Analysis
- 12.1.6 Brandt Consolidated Inc
- 12.1.6.1. Company Overview
- 12.1.6.2. Products
- 12.1.6.3. Company Financials
- 12.1.6.4. SWOT Analysis
- 12.1.7 Garrco Products Inc
- 12.1.7.1. Company Overview
- 12.1.7.2. Products
- 12.1.7.3. Company Financials
- 12.1.7.4. SWOT Analysis
- 12.1.8 Lamberti SPA
- 12.1.8.1. Company Overview
- 12.1.8.2. Products
- 12.1.8.3. Company Financials
- 12.1.8.4. SWOT Analysis
- 12.1.9 Kao Corporation
- 12.1.9.1. Company Overview
- 12.1.9.2. Products
- 12.1.9.3. Company Financials
- 12.1.9.4. SWOT Analysis
- 12.1.10 Helena Chemical Company
- 12.1.10.1. Company Overview
- 12.1.10.2. Products
- 12.1.10.3. Company Financials
- 12.1.10.4. SWOT Analysis
- 12.1.11 Air Products and Chemicals
- 12.1.11.1. Company Overview
- 12.1.11.2. Products
- 12.1.11.3. Company Financials
- 12.1.11.4. SWOT Analysis
- 12.1.12 Nufarm Limited
- 12.1.12.1. Company Overview
- 12.1.12.2. Products
- 12.1.12.3. Company Financials
- 12.1.12.4. SWOT Analysis
- 12.1.13 Wilbur-Ellis Company
- 12.1.13.1. Company Overview
- 12.1.13.2. Products
- 12.1.13.3. Company Financials
- 12.1.13.4. SWOT Analysis
- 12.1.14 Huntsman
- 12.1.14.1. Company Overview
- 12.1.14.2. Products
- 12.1.14.3. Company Financials
- 12.1.14.4. SWOT Analysis
- 12.1.15 Corteva Agriscience
- 12.1.15.1. Company Overview
- 12.1.15.2. Products
- 12.1.15.3. Company Financials
- 12.1.15.4. SWOT Analysis
- 12.1.16 Croda International PLC
- 12.1.16.1. Company Overview
- 12.1.16.2. Products
- 12.1.16.3. Company Financials
- 12.1.16.4. SWOT Analysis
- 12.1.17 Evonik Industries
- 12.1.17.1. Company Overview
- 12.1.17.2. Products
- 12.1.17.3. Company Financials
- 12.1.17.4. SWOT Analysis
- 12.1.18 BASF SE
- 12.1.18.1. Company Overview
- 12.1.18.2. Products
- 12.1.18.3. Company Financials
- 12.1.18.4. SWOT Analysis
- 12.1.1 Tanatex Chemicals BV
- 12.2. Market Entropy
- 12.2.1 Company's Key Areas Served
- 12.2.2 Recent Developments
- 12.3. Company Market Share Analysis 2025
- 12.3.1 Top 5 Companies Market Share Analysis
- 12.3.2 Top 3 Companies Market Share Analysis
- 12.4. List of Potential Customers
- 13. Research Methodology
List of Figures
- Figure 1: Global Agricultural Surfactant Market Revenue Breakdown (Million, %) by Region 2025 & 2033
- Figure 2: North America Agricultural Surfactant Market Revenue (Million), by Production Analysis 2025 & 2033
- Figure 3: North America Agricultural Surfactant Market Revenue Share (%), by Production Analysis 2025 & 2033
- Figure 4: North America Agricultural Surfactant Market Revenue (Million), by Consumption Analysis 2025 & 2033
- Figure 5: North America Agricultural Surfactant Market Revenue Share (%), by Consumption Analysis 2025 & 2033
- Figure 6: North America Agricultural Surfactant Market Revenue (Million), by Import Market Analysis (Value & Volume) 2025 & 2033
- Figure 7: North America Agricultural Surfactant Market Revenue Share (%), by Import Market Analysis (Value & Volume) 2025 & 2033
- Figure 8: North America Agricultural Surfactant Market Revenue (Million), by Export Market Analysis (Value & Volume) 2025 & 2033
- Figure 9: North America Agricultural Surfactant Market Revenue Share (%), by Export Market Analysis (Value & Volume) 2025 & 2033
- Figure 10: North America Agricultural Surfactant Market Revenue (Million), by Price Trend Analysis 2025 & 2033
- Figure 11: North America Agricultural Surfactant Market Revenue Share (%), by Price Trend Analysis 2025 & 2033
- Figure 12: North America Agricultural Surfactant Market Revenue (Million), by Country 2025 & 2033
- Figure 13: North America Agricultural Surfactant Market Revenue Share (%), by Country 2025 & 2033
- Figure 14: South America Agricultural Surfactant Market Revenue (Million), by Production Analysis 2025 & 2033
- Figure 15: South America Agricultural Surfactant Market Revenue Share (%), by Production Analysis 2025 & 2033
- Figure 16: South America Agricultural Surfactant Market Revenue (Million), by Consumption Analysis 2025 & 2033
- Figure 17: South America Agricultural Surfactant Market Revenue Share (%), by Consumption Analysis 2025 & 2033
- Figure 18: South America Agricultural Surfactant Market Revenue (Million), by Import Market Analysis (Value & Volume) 2025 & 2033
- Figure 19: South America Agricultural Surfactant Market Revenue Share (%), by Import Market Analysis (Value & Volume) 2025 & 2033
- Figure 20: South America Agricultural Surfactant Market Revenue (Million), by Export Market Analysis (Value & Volume) 2025 & 2033
- Figure 21: South America Agricultural Surfactant Market Revenue Share (%), by Export Market Analysis (Value & Volume) 2025 & 2033
- Figure 22: South America Agricultural Surfactant Market Revenue (Million), by Price Trend Analysis 2025 & 2033
- Figure 23: South America Agricultural Surfactant Market Revenue Share (%), by Price Trend Analysis 2025 & 2033
- Figure 24: South America Agricultural Surfactant Market Revenue (Million), by Country 2025 & 2033
- Figure 25: South America Agricultural Surfactant Market Revenue Share (%), by Country 2025 & 2033
- Figure 26: Europe Agricultural Surfactant Market Revenue (Million), by Production Analysis 2025 & 2033
- Figure 27: Europe Agricultural Surfactant Market Revenue Share (%), by Production Analysis 2025 & 2033
- Figure 28: Europe Agricultural Surfactant Market Revenue (Million), by Consumption Analysis 2025 & 2033
- Figure 29: Europe Agricultural Surfactant Market Revenue Share (%), by Consumption Analysis 2025 & 2033
- Figure 30: Europe Agricultural Surfactant Market Revenue (Million), by Import Market Analysis (Value & Volume) 2025 & 2033
- Figure 31: Europe Agricultural Surfactant Market Revenue Share (%), by Import Market Analysis (Value & Volume) 2025 & 2033
- Figure 32: Europe Agricultural Surfactant Market Revenue (Million), by Export Market Analysis (Value & Volume) 2025 & 2033
- Figure 33: Europe Agricultural Surfactant Market Revenue Share (%), by Export Market Analysis (Value & Volume) 2025 & 2033
- Figure 34: Europe Agricultural Surfactant Market Revenue (Million), by Price Trend Analysis 2025 & 2033
- Figure 35: Europe Agricultural Surfactant Market Revenue Share (%), by Price Trend Analysis 2025 & 2033
- Figure 36: Europe Agricultural Surfactant Market Revenue (Million), by Country 2025 & 2033
- Figure 37: Europe Agricultural Surfactant Market Revenue Share (%), by Country 2025 & 2033
- Figure 38: Middle East & Africa Agricultural Surfactant Market Revenue (Million), by Production Analysis 2025 & 2033
- Figure 39: Middle East & Africa Agricultural Surfactant Market Revenue Share (%), by Production Analysis 2025 & 2033
- Figure 40: Middle East & Africa Agricultural Surfactant Market Revenue (Million), by Consumption Analysis 2025 & 2033
- Figure 41: Middle East & Africa Agricultural Surfactant Market Revenue Share (%), by Consumption Analysis 2025 & 2033
- Figure 42: Middle East & Africa Agricultural Surfactant Market Revenue (Million), by Import Market Analysis (Value & Volume) 2025 & 2033
- Figure 43: Middle East & Africa Agricultural Surfactant Market Revenue Share (%), by Import Market Analysis (Value & Volume) 2025 & 2033
- Figure 44: Middle East & Africa Agricultural Surfactant Market Revenue (Million), by Export Market Analysis (Value & Volume) 2025 & 2033
- Figure 45: Middle East & Africa Agricultural Surfactant Market Revenue Share (%), by Export Market Analysis (Value & Volume) 2025 & 2033
- Figure 46: Middle East & Africa Agricultural Surfactant Market Revenue (Million), by Price Trend Analysis 2025 & 2033
- Figure 47: Middle East & Africa Agricultural Surfactant Market Revenue Share (%), by Price Trend Analysis 2025 & 2033
- Figure 48: Middle East & Africa Agricultural Surfactant Market Revenue (Million), by Country 2025 & 2033
- Figure 49: Middle East & Africa Agricultural Surfactant Market Revenue Share (%), by Country 2025 & 2033
- Figure 50: Asia Pacific Agricultural Surfactant Market Revenue (Million), by Production Analysis 2025 & 2033
- Figure 51: Asia Pacific Agricultural Surfactant Market Revenue Share (%), by Production Analysis 2025 & 2033
- Figure 52: Asia Pacific Agricultural Surfactant Market Revenue (Million), by Consumption Analysis 2025 & 2033
- Figure 53: Asia Pacific Agricultural Surfactant Market Revenue Share (%), by Consumption Analysis 2025 & 2033
- Figure 54: Asia Pacific Agricultural Surfactant Market Revenue (Million), by Import Market Analysis (Value & Volume) 2025 & 2033
- Figure 55: Asia Pacific Agricultural Surfactant Market Revenue Share (%), by Import Market Analysis (Value & Volume) 2025 & 2033
- Figure 56: Asia Pacific Agricultural Surfactant Market Revenue (Million), by Export Market Analysis (Value & Volume) 2025 & 2033
- Figure 57: Asia Pacific Agricultural Surfactant Market Revenue Share (%), by Export Market Analysis (Value & Volume) 2025 & 2033
- Figure 58: Asia Pacific Agricultural Surfactant Market Revenue (Million), by Price Trend Analysis 2025 & 2033
- Figure 59: Asia Pacific Agricultural Surfactant Market Revenue Share (%), by Price Trend Analysis 2025 & 2033
- Figure 60: Asia Pacific Agricultural Surfactant Market Revenue (Million), by Country 2025 & 2033
- Figure 61: Asia Pacific Agricultural Surfactant Market Revenue Share (%), by Country 2025 & 2033
List of Tables
- Table 1: Global Agricultural Surfactant Market Revenue Million Forecast, by Production Analysis 2020 & 2033
- Table 2: Global Agricultural Surfactant Market Revenue Million Forecast, by Consumption Analysis 2020 & 2033
- Table 3: Global Agricultural Surfactant Market Revenue Million Forecast, by Import Market Analysis (Value & Volume) 2020 & 2033
- Table 4: Global Agricultural Surfactant Market Revenue Million Forecast, by Export Market Analysis (Value & Volume) 2020 & 2033
- Table 5: Global Agricultural Surfactant Market Revenue Million Forecast, by Price Trend Analysis 2020 & 2033
- Table 6: Global Agricultural Surfactant Market Revenue Million Forecast, by Region 2020 & 2033
- Table 7: Global Agricultural Surfactant Market Revenue Million Forecast, by Production Analysis 2020 & 2033
- Table 8: Global Agricultural Surfactant Market Revenue Million Forecast, by Consumption Analysis 2020 & 2033
- Table 9: Global Agricultural Surfactant Market Revenue Million Forecast, by Import Market Analysis (Value & Volume) 2020 & 2033
- Table 10: Global Agricultural Surfactant Market Revenue Million Forecast, by Export Market Analysis (Value & Volume) 2020 & 2033
- Table 11: Global Agricultural Surfactant Market Revenue Million Forecast, by Price Trend Analysis 2020 & 2033
- Table 12: Global Agricultural Surfactant Market Revenue Million Forecast, by Country 2020 & 2033
- Table 13: United States Agricultural Surfactant Market Revenue (Million) Forecast, by Application 2020 & 2033
- Table 14: Canada Agricultural Surfactant Market Revenue (Million) Forecast, by Application 2020 & 2033
- Table 15: Mexico Agricultural Surfactant Market Revenue (Million) Forecast, by Application 2020 & 2033
- Table 16: Global Agricultural Surfactant Market Revenue Million Forecast, by Production Analysis 2020 & 2033
- Table 17: Global Agricultural Surfactant Market Revenue Million Forecast, by Consumption Analysis 2020 & 2033
- Table 18: Global Agricultural Surfactant Market Revenue Million Forecast, by Import Market Analysis (Value & Volume) 2020 & 2033
- Table 19: Global Agricultural Surfactant Market Revenue Million Forecast, by Export Market Analysis (Value & Volume) 2020 & 2033
- Table 20: Global Agricultural Surfactant Market Revenue Million Forecast, by Price Trend Analysis 2020 & 2033
- Table 21: Global Agricultural Surfactant Market Revenue Million Forecast, by Country 2020 & 2033
- Table 22: Brazil Agricultural Surfactant Market Revenue (Million) Forecast, by Application 2020 & 2033
- Table 23: Argentina Agricultural Surfactant Market Revenue (Million) Forecast, by Application 2020 & 2033
- Table 24: Rest of South America Agricultural Surfactant Market Revenue (Million) Forecast, by Application 2020 & 2033
- Table 25: Global Agricultural Surfactant Market Revenue Million Forecast, by Production Analysis 2020 & 2033
- Table 26: Global Agricultural Surfactant Market Revenue Million Forecast, by Consumption Analysis 2020 & 2033
- Table 27: Global Agricultural Surfactant Market Revenue Million Forecast, by Import Market Analysis (Value & Volume) 2020 & 2033
- Table 28: Global Agricultural Surfactant Market Revenue Million Forecast, by Export Market Analysis (Value & Volume) 2020 & 2033
- Table 29: Global Agricultural Surfactant Market Revenue Million Forecast, by Price Trend Analysis 2020 & 2033
- Table 30: Global Agricultural Surfactant Market Revenue Million Forecast, by Country 2020 & 2033
- Table 31: United Kingdom Agricultural Surfactant Market Revenue (Million) Forecast, by Application 2020 & 2033
- Table 32: Germany Agricultural Surfactant Market Revenue (Million) Forecast, by Application 2020 & 2033
- Table 33: France Agricultural Surfactant Market Revenue (Million) Forecast, by Application 2020 & 2033
- Table 34: Italy Agricultural Surfactant Market Revenue (Million) Forecast, by Application 2020 & 2033
- Table 35: Spain Agricultural Surfactant Market Revenue (Million) Forecast, by Application 2020 & 2033
- Table 36: Russia Agricultural Surfactant Market Revenue (Million) Forecast, by Application 2020 & 2033
- Table 37: Benelux Agricultural Surfactant Market Revenue (Million) Forecast, by Application 2020 & 2033
- Table 38: Nordics Agricultural Surfactant Market Revenue (Million) Forecast, by Application 2020 & 2033
- Table 39: Rest of Europe Agricultural Surfactant Market Revenue (Million) Forecast, by Application 2020 & 2033
- Table 40: Global Agricultural Surfactant Market Revenue Million Forecast, by Production Analysis 2020 & 2033
- Table 41: Global Agricultural Surfactant Market Revenue Million Forecast, by Consumption Analysis 2020 & 2033
- Table 42: Global Agricultural Surfactant Market Revenue Million Forecast, by Import Market Analysis (Value & Volume) 2020 & 2033
- Table 43: Global Agricultural Surfactant Market Revenue Million Forecast, by Export Market Analysis (Value & Volume) 2020 & 2033
- Table 44: Global Agricultural Surfactant Market Revenue Million Forecast, by Price Trend Analysis 2020 & 2033
- Table 45: Global Agricultural Surfactant Market Revenue Million Forecast, by Country 2020 & 2033
- Table 46: Turkey Agricultural Surfactant Market Revenue (Million) Forecast, by Application 2020 & 2033
- Table 47: Israel Agricultural Surfactant Market Revenue (Million) Forecast, by Application 2020 & 2033
- Table 48: GCC Agricultural Surfactant Market Revenue (Million) Forecast, by Application 2020 & 2033
- Table 49: North Africa Agricultural Surfactant Market Revenue (Million) Forecast, by Application 2020 & 2033
- Table 50: South Africa Agricultural Surfactant Market Revenue (Million) Forecast, by Application 2020 & 2033
- Table 51: Rest of Middle East & Africa Agricultural Surfactant Market Revenue (Million) Forecast, by Application 2020 & 2033
- Table 52: Global Agricultural Surfactant Market Revenue Million Forecast, by Production Analysis 2020 & 2033
- Table 53: Global Agricultural Surfactant Market Revenue Million Forecast, by Consumption Analysis 2020 & 2033
- Table 54: Global Agricultural Surfactant Market Revenue Million Forecast, by Import Market Analysis (Value & Volume) 2020 & 2033
- Table 55: Global Agricultural Surfactant Market Revenue Million Forecast, by Export Market Analysis (Value & Volume) 2020 & 2033
- Table 56: Global Agricultural Surfactant Market Revenue Million Forecast, by Price Trend Analysis 2020 & 2033
- Table 57: Global Agricultural Surfactant Market Revenue Million Forecast, by Country 2020 & 2033
- Table 58: China Agricultural Surfactant Market Revenue (Million) Forecast, by Application 2020 & 2033
- Table 59: India Agricultural Surfactant Market Revenue (Million) Forecast, by Application 2020 & 2033
- Table 60: Japan Agricultural Surfactant Market Revenue (Million) Forecast, by Application 2020 & 2033
- Table 61: South Korea Agricultural Surfactant Market Revenue (Million) Forecast, by Application 2020 & 2033
- Table 62: ASEAN Agricultural Surfactant Market Revenue (Million) Forecast, by Application 2020 & 2033
- Table 63: Oceania Agricultural Surfactant Market Revenue (Million) Forecast, by Application 2020 & 2033
- Table 64: Rest of Asia Pacific Agricultural Surfactant Market Revenue (Million) Forecast, by Application 2020 & 2033
Frequently Asked Questions
1. What is the projected Compound Annual Growth Rate (CAGR) of the Agricultural Surfactant Market?
The projected CAGR is approximately 6.70%.
2. Which companies are prominent players in the Agricultural Surfactant Market?
Key companies in the market include Tanatex Chemicals BV, Clariant, Solvay SA, Akzonobel, Interagro (Uk) Ltd, Brandt Consolidated Inc, Garrco Products Inc, Lamberti SPA, Kao Corporation, Helena Chemical Company, Air Products and Chemicals, Nufarm Limited, Wilbur-Ellis Company, Huntsman, Corteva Agriscience, Croda International PLC, Evonik Industries, BASF SE.
3. What are the main segments of the Agricultural Surfactant Market?
The market segments include Production Analysis, Consumption Analysis, Import Market Analysis (Value & Volume), Export Market Analysis (Value & Volume), Price Trend Analysis.
4. Can you provide details about the market size?
The market size is estimated to be USD 2.04 Million as of 2022.
5. What are some drivers contributing to market growth?
Shortage of Skilled Labor; Government Support to Enhance Farm Mechanization.
6. What are the notable trends driving market growth?
Rising Demand for Food and Shrinking Land Driving the Market.
7. Are there any restraints impacting market growth?
Heavy Initial Procurement Cost and High Expenditure on Maintenance.
8. Can you provide examples of recent developments in the market?
March 2022 - Dow announced a new product extension of VORASURF™ Silicone Surfactants to support the growing demand for enhanced energy efficiency and sustainable solutions in the rigid polyurethane foam market, with a specific focus on spray and construction applications.
9. What pricing options are available for accessing the report?
Pricing options include single-user, multi-user, and enterprise licenses priced at USD 4750, USD 5250, and USD 8750 respectively.
10. Is the market size provided in terms of value or volume?
The market size is provided in terms of value, measured in Million.
11. Are there any specific market keywords associated with the report?
Yes, the market keyword associated with the report is "Agricultural Surfactant Market," which aids in identifying and referencing the specific market segment covered.
12. How do I determine which pricing option suits my needs best?
The pricing options vary based on user requirements and access needs. Individual users may opt for single-user licenses, while businesses requiring broader access may choose multi-user or enterprise licenses for cost-effective access to the report.
13. Are there any additional resources or data provided in the Agricultural Surfactant Market report?
While the report offers comprehensive insights, it's advisable to review the specific contents or supplementary materials provided to ascertain if additional resources or data are available.
14. How can I stay updated on further developments or reports in the Agricultural Surfactant Market?
To stay informed about further developments, trends, and reports in the Agricultural Surfactant Market, consider subscribing to industry newsletters, following relevant companies and organizations, or regularly checking reputable industry news sources and publications.
Methodology
Step 1 - Identification of Relevant Samples Size from Population Database


Step 2 - Approaches for Defining Global Market Size (Value, Volume* & Price*)

Note*: In applicable scenarios
Step 3 - Data Sources
Primary Research
- Web Analytics
- Survey Reports
- Research Institute
- Latest Research Reports
- Opinion Leaders
Secondary Research
- Annual Reports
- White Paper
- Latest Press Release
- Industry Association
- Paid Database
- Investor Presentations

Step 4 - Data Triangulation
Involves using different sources of information in order to increase the validity of a study
These sources are likely to be stakeholders in a program - participants, other researchers, program staff, other community members, and so on.
Then we put all data in single framework & apply various statistical tools to find out the dynamic on the market.
During the analysis stage, feedback from the stakeholder groups would be compared to determine areas of agreement as well as areas of divergence