

Key Insights
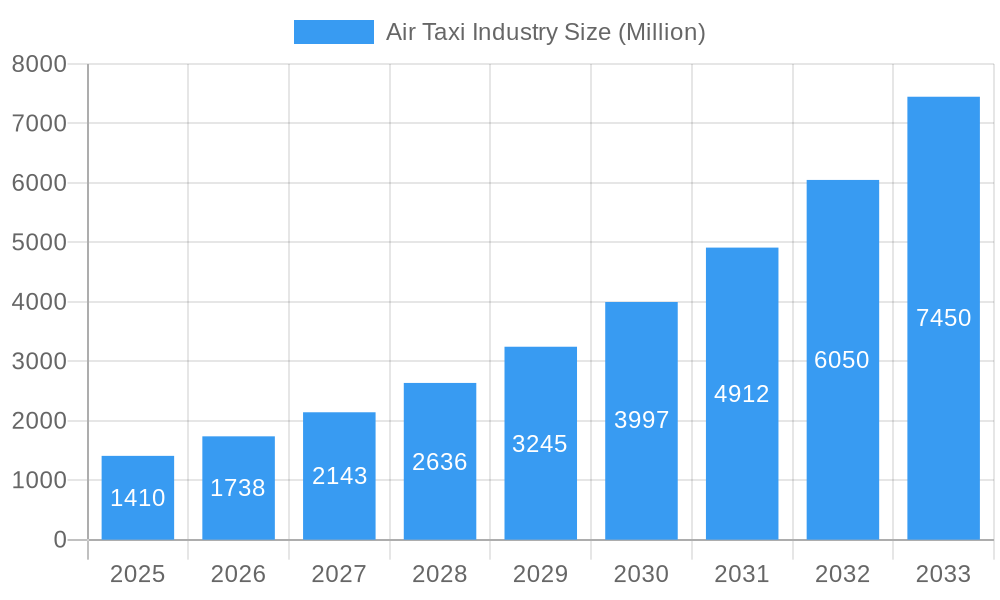
The air taxi industry is poised for explosive growth, projected to reach a market size of $1.41 billion in 2025 and experiencing a remarkable Compound Annual Growth Rate (CAGR) of 23.32% from 2025 to 2033. Several factors drive this expansion. Technological advancements in electric vertical takeoff and landing (eVTOL) aircraft are leading to safer, quieter, and more efficient air taxis. Increasing urbanization and traffic congestion in major cities are creating a strong demand for faster, more convenient transportation alternatives. Furthermore, growing government support and investment in the development and regulation of this emerging industry are fostering innovation and market entry. The industry is witnessing significant investments from both established aerospace giants and innovative startups, creating a dynamic and competitive landscape. While challenges remain, such as regulatory hurdles, infrastructure development needs, and public acceptance, the long-term potential of air taxis to revolutionize urban transportation remains significant.
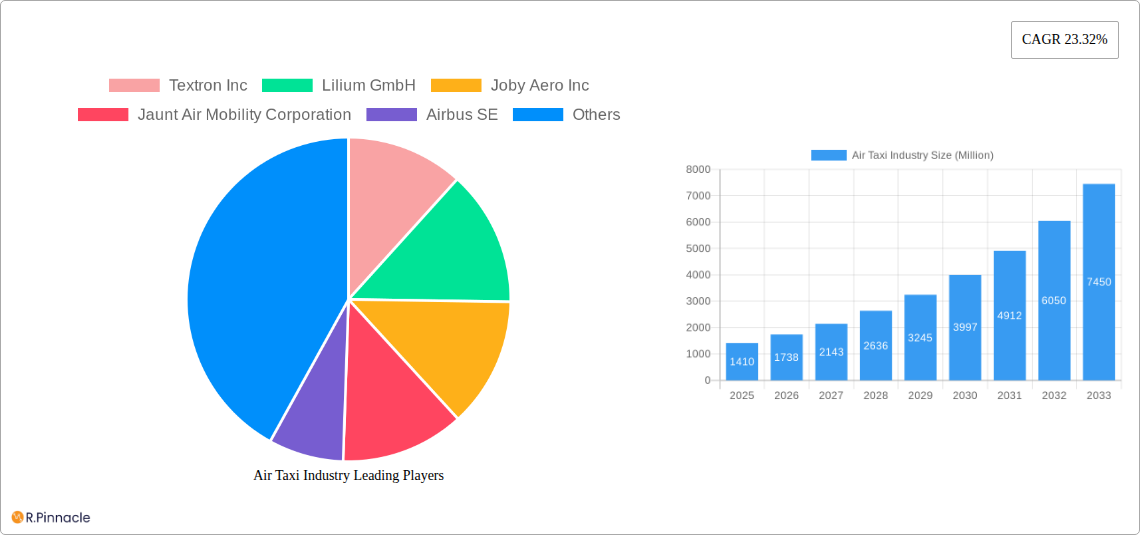
Air Taxi Industry Market Size (In Billion)
Market segmentation reveals a rapidly evolving landscape. The mode of operation is currently primarily piloted, but the autonomous segment is expected to experience the most significant growth in the coming years. Geographical distribution showcases strong early adoption in North America and Europe, with Asia Pacific showing substantial growth potential fueled by rapid urbanization and technological adoption in key markets such as China and India. The dominance of major players like Textron, Lilium, Joby Aero, and Airbus reflects significant financial commitment and technological prowess. However, the entry of numerous startups and the potential for disruptive innovations promise a dynamic and competitive environment in the years to come. The forecast period of 2025-2033 anticipates significant market expansion driven by continued technological advancements, increasing affordability, and growing consumer acceptance.
Air Taxi Industry Company Market Share
Air Taxi Industry Market Report: 2019-2033 Forecast
This comprehensive report provides an in-depth analysis of the burgeoning air taxi industry, projecting a market valued at $XX Million by 2033. Leveraging data from the historical period (2019-2024), base year (2025), and estimated year (2025), this report offers crucial insights for industry professionals, investors, and strategists. The study period covers 2019-2033, with a forecast period spanning 2025-2033. Key players like Textron Inc, Lilium GmbH, Joby Aero Inc, and Airbus SE are analyzed, alongside emerging competitors. This report is essential for understanding market dynamics, technological advancements, and future growth opportunities in this transformative sector.
Air Taxi Industry Market Structure & Innovation Trends
The air taxi market is characterized by a dynamic interplay of established aerospace giants and innovative startups. Market concentration is currently low, with several companies vying for market share. However, consolidation through mergers and acquisitions (M&A) is expected to increase in the coming years. The estimated value of M&A deals in the period 2019-2024 totalled $XX Million. Innovation is driven by advancements in electric propulsion, autonomous flight technology, and urban air mobility (UAM) infrastructure development. Regulatory frameworks are still evolving, posing both challenges and opportunities. Key product substitutes include traditional helicopter services and high-speed rail, but the air taxi market offers unique advantages in terms of speed and convenience. End-user demographics are expected to encompass both business and leisure travelers, with a potential expansion into cargo and emergency medical services.
- Market Share (2025 Estimate): Airbus SE (XX%), Joby Aero Inc (XX%), Lilium GmbH (XX%), Others (XX%)
- M&A Activity (2019-2024): XX deals valued at approximately $XX Million.
Air Taxi Industry Market Dynamics & Trends
The air taxi market is poised for significant growth, driven by several key factors. The Compound Annual Growth Rate (CAGR) is projected to be XX% during the forecast period (2025-2033), with market penetration expected to reach XX% by 2033. Increasing urbanization, traffic congestion in major cities, and the demand for faster and more efficient transportation are key growth drivers. Technological disruptions, including the development of advanced electric Vertical Take-Off and Landing (eVTOL) aircraft and autonomous flight systems, are revolutionizing the industry. Consumer preferences are shifting towards sustainable and convenient travel options, creating a favorable environment for air taxi services. Competitive dynamics are intense, with companies focusing on innovation, partnerships, and strategic investments to gain a competitive edge.
Dominant Regions & Segments in Air Taxi Industry
North America and Europe are currently the leading regions for air taxi development and deployment, driven by supportive regulatory environments, robust technological ecosystems, and significant investments. However, Asia-Pacific is expected to experience rapid growth in the coming years due to increasing urbanization and government initiatives.
Key Drivers:
- North America: Strong investor interest, advanced technological infrastructure, supportive regulatory frameworks.
- Europe: Government funding for UAM initiatives, established aerospace industry.
- Asia-Pacific: Rapid urbanization, increasing disposable income, government support for sustainable transportation.
Mode of Operation:
- Piloted: Currently dominates the market, offering a higher level of safety and reliability. Growth is expected to slow as autonomous technology matures.
- Autonomous: This segment is projected to experience significant growth, driven by technological advancements and cost reductions, but faces hurdles in certification and public acceptance.
Air Taxi Industry Product Innovations
The air taxi industry is witnessing rapid product innovation, focusing on improving safety, efficiency, and passenger experience. Key developments include advancements in electric propulsion systems, autonomous flight controls, noise reduction technologies, and cabin design. These innovations are improving market fit by addressing key concerns such as cost, range, and environmental impact.
Report Scope & Segmentation Analysis
This report segments the air taxi market by Mode of Operation: Piloted and Autonomous.
Piloted: This segment is expected to maintain a significant market share in the near term, driven by safety concerns and the need for experienced pilots. Market size in 2025 is estimated at $XX Million, with projected growth to $XX Million by 2033.
Autonomous: This segment is expected to show substantial growth, with market size projected to reach $XX Million by 2033. The growth is contingent on regulatory approvals and public acceptance of autonomous flight.
Key Drivers of Air Taxi Industry Growth
Technological advancements in eVTOL aircraft, autonomous flight systems, and battery technology are key drivers of industry growth. Government support through funding and regulatory frameworks is also crucial, alongside the increasing demand for faster and more efficient urban transportation. The growing adoption of sustainable transportation solutions further fuels market expansion.
Challenges in the Air Taxi Industry Sector
Regulatory hurdles, including certification processes and airspace management, pose significant challenges. Supply chain complexities in securing components and skilled labor impact production and deployment. Intense competition among established players and new entrants also creates pressure on margins and market share. The high initial investment costs for infrastructure and aircraft remain a barrier to entry.
Emerging Opportunities in Air Taxi Industry
Emerging opportunities include expansion into new markets such as cargo delivery and emergency medical services. The development of advanced air traffic management (ATM) systems and integrated urban mobility solutions will unlock further growth potential. Growing demand for sustainable and eco-friendly transportation creates opportunities for electric and hybrid-electric air taxis.
Leading Players in the Air Taxi Industry Market
- Textron Inc
- Lilium GmbH
- Joby Aero Inc
- Jaunt Air Mobility Corporation
- Airbus SE
- Hyundai Motor Company
- Volocopter GmbH
- Wisk Aero LL
- Guangzhou EHang Intelligent Technology Co Ltd
- The Boeing Company
Key Developments in Air Taxi Industry
- 2022-Q4: Joby Aero secures FAA certification for its eVTOL aircraft.
- 2023-Q1: Lilium GmbH announces a partnership with a major airline for commercial operations.
- 2023-Q2: Airbus SE unveils a new generation of electric propulsion system for air taxis.
Future Outlook for Air Taxi Industry Market
The future outlook for the air taxi market is exceptionally positive, with significant growth potential driven by technological advancements, favorable regulatory environments, and increasing consumer demand. Strategic partnerships, innovative business models, and expansion into new markets will be crucial for success. The market is poised for substantial expansion, offering significant opportunities for investors and industry players.
Air Taxi Industry Segmentation
-
1. Mode of Operation
- 1.1. Piloted
- 1.2. Autonomous
Air Taxi Industry Segmentation By Geography
-
1. North America
- 1.1. United States
- 1.2. Canada
-
2. Europe
- 2.1. Germany
- 2.2. United Kingdom
- 2.3. France
- 2.4. Russia
- 2.5. Rest of Europe
-
3. Asia Pacific
- 3.1. India
- 3.2. China
- 3.3. Japan
- 3.4. South Korea
- 3.5. Australia
- 3.6. Rest of Asia Pacific
-
4. Latin America
- 4.1. Brazil
- 4.2. Mexico
- 4.3. Rest of Latin America
-
5. Middle East and Africa
- 5.1. Saudi Arabia
- 5.2. Egypt
- 5.3. Israel
- 5.4. Rest of Middle East and Africa
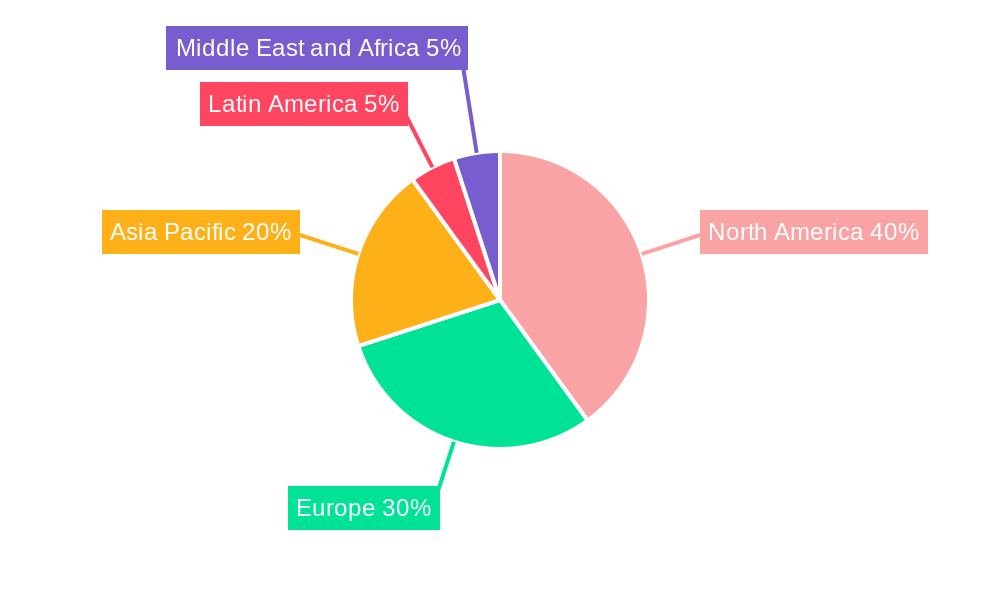
Air Taxi Industry Regional Market Share
Geographic Coverage of Air Taxi Industry
Air Taxi Industry REPORT HIGHLIGHTS
| Aspects | Details |
|---|---|
| Study Period | 2020-2034 |
| Base Year | 2025 |
| Estimated Year | 2026 |
| Forecast Period | 2026-2034 |
| Historical Period | 2020-2025 |
| Growth Rate | CAGR of 23.32% from 2020-2034 |
| Segmentation |
|
Table of Contents
- 1. Introduction
- 1.1. Research Scope
- 1.2. Market Segmentation
- 1.3. Research Objective
- 1.4. Definitions and Assumptions
- 2. Executive Summary
- 2.1. Market Snapshot
- 3. Market Dynamics
- 3.1. Market Drivers
- 3.2. Market Restrains
- 3.3. Market Trends
- 3.4. Market Opportunities
- 4. Market Factor Analysis
- 4.1. Porters Five Forces
- 4.1.1. Bargaining Power of Suppliers
- 4.1.2. Bargaining Power of Buyers
- 4.1.3. Threat of New Entrants
- 4.1.4. Threat of Substitutes
- 4.1.5. Competitive Rivalry
- 4.2. PESTEL analysis
- 4.3. BCG Analysis
- 4.3.1. Stars (High Growth, High Market Share)
- 4.3.2. Cash Cows (Low Growth, High Market Share)
- 4.3.3. Question Mark (High Growth, Low Market Share)
- 4.3.4. Dogs (Low Growth, Low Market Share)
- 4.4. Ansoff Matrix Analysis
- 4.5. Supply Chain Analysis
- 4.6. Regulatory Landscape
- 4.7. Current Market Potential and Opportunity Assessment (TAM–SAM–SOM Framework)
- 4.8. PRI Analyst Note
- 4.1. Porters Five Forces
- 5. Market Analysis, Insights and Forecast 2021-2033
- 5.1. Market Analysis, Insights and Forecast - by Mode of Operation
- 5.1.1. Piloted
- 5.1.2. Autonomous
- 5.2. Market Analysis, Insights and Forecast - by Region
- 5.2.1. North America
- 5.2.2. Europe
- 5.2.3. Asia Pacific
- 5.2.4. Latin America
- 5.2.5. Middle East and Africa
- 5.1. Market Analysis, Insights and Forecast - by Mode of Operation
- 6. Global Air Taxi Industry Analysis, Insights and Forecast, 2021-2033
- 6.1. Market Analysis, Insights and Forecast - by Mode of Operation
- 6.1.1. Piloted
- 6.1.2. Autonomous
- 6.1. Market Analysis, Insights and Forecast - by Mode of Operation
- 7. North America Air Taxi Industry Analysis, Insights and Forecast, 2020-2032
- 7.1. Market Analysis, Insights and Forecast - by Mode of Operation
- 7.1.1. Piloted
- 7.1.2. Autonomous
- 7.1. Market Analysis, Insights and Forecast - by Mode of Operation
- 8. Europe Air Taxi Industry Analysis, Insights and Forecast, 2020-2032
- 8.1. Market Analysis, Insights and Forecast - by Mode of Operation
- 8.1.1. Piloted
- 8.1.2. Autonomous
- 8.1. Market Analysis, Insights and Forecast - by Mode of Operation
- 9. Asia Pacific Air Taxi Industry Analysis, Insights and Forecast, 2020-2032
- 9.1. Market Analysis, Insights and Forecast - by Mode of Operation
- 9.1.1. Piloted
- 9.1.2. Autonomous
- 9.1. Market Analysis, Insights and Forecast - by Mode of Operation
- 10. Latin America Air Taxi Industry Analysis, Insights and Forecast, 2020-2032
- 10.1. Market Analysis, Insights and Forecast - by Mode of Operation
- 10.1.1. Piloted
- 10.1.2. Autonomous
- 10.1. Market Analysis, Insights and Forecast - by Mode of Operation
- 11. Middle East and Africa Air Taxi Industry Analysis, Insights and Forecast, 2020-2032
- 11.1. Market Analysis, Insights and Forecast - by Mode of Operation
- 11.1.1. Piloted
- 11.1.2. Autonomous
- 11.1. Market Analysis, Insights and Forecast - by Mode of Operation
- 12. Competitive Analysis
- 12.1. Company Profiles
- 12.1.1 Textron Inc
- 12.1.1.1. Company Overview
- 12.1.1.2. Products
- 12.1.1.3. Company Financials
- 12.1.1.4. SWOT Analysis
- 12.1.2 Lilium GmbH
- 12.1.2.1. Company Overview
- 12.1.2.2. Products
- 12.1.2.3. Company Financials
- 12.1.2.4. SWOT Analysis
- 12.1.3 Joby Aero Inc
- 12.1.3.1. Company Overview
- 12.1.3.2. Products
- 12.1.3.3. Company Financials
- 12.1.3.4. SWOT Analysis
- 12.1.4 Jaunt Air Mobility Corporation
- 12.1.4.1. Company Overview
- 12.1.4.2. Products
- 12.1.4.3. Company Financials
- 12.1.4.4. SWOT Analysis
- 12.1.5 Airbus SE
- 12.1.5.1. Company Overview
- 12.1.5.2. Products
- 12.1.5.3. Company Financials
- 12.1.5.4. SWOT Analysis
- 12.1.6 Hyundai Motor Company
- 12.1.6.1. Company Overview
- 12.1.6.2. Products
- 12.1.6.3. Company Financials
- 12.1.6.4. SWOT Analysis
- 12.1.7 Volocopter GmbH
- 12.1.7.1. Company Overview
- 12.1.7.2. Products
- 12.1.7.3. Company Financials
- 12.1.7.4. SWOT Analysis
- 12.1.8 Wisk Aero LL
- 12.1.8.1. Company Overview
- 12.1.8.2. Products
- 12.1.8.3. Company Financials
- 12.1.8.4. SWOT Analysis
- 12.1.9 Guangzhou EHang Intelligent Technology Co Ltd
- 12.1.9.1. Company Overview
- 12.1.9.2. Products
- 12.1.9.3. Company Financials
- 12.1.9.4. SWOT Analysis
- 12.1.10 The Boeing Company
- 12.1.10.1. Company Overview
- 12.1.10.2. Products
- 12.1.10.3. Company Financials
- 12.1.10.4. SWOT Analysis
- 12.1.1 Textron Inc
- 12.2. Market Entropy
- 12.2.1 Company's Key Areas Served
- 12.2.2 Recent Developments
- 12.3. Company Market Share Analysis 2025
- 12.3.1 Top 5 Companies Market Share Analysis
- 12.3.2 Top 3 Companies Market Share Analysis
- 12.4. List of Potential Customers
- 13. Research Methodology
List of Figures
- Figure 1: Global Air Taxi Industry Revenue Breakdown (Million, %) by Region 2025 & 2033
- Figure 2: North America Air Taxi Industry Revenue (Million), by Mode of Operation 2025 & 2033
- Figure 3: North America Air Taxi Industry Revenue Share (%), by Mode of Operation 2025 & 2033
- Figure 4: North America Air Taxi Industry Revenue (Million), by Country 2025 & 2033
- Figure 5: North America Air Taxi Industry Revenue Share (%), by Country 2025 & 2033
- Figure 6: Europe Air Taxi Industry Revenue (Million), by Mode of Operation 2025 & 2033
- Figure 7: Europe Air Taxi Industry Revenue Share (%), by Mode of Operation 2025 & 2033
- Figure 8: Europe Air Taxi Industry Revenue (Million), by Country 2025 & 2033
- Figure 9: Europe Air Taxi Industry Revenue Share (%), by Country 2025 & 2033
- Figure 10: Asia Pacific Air Taxi Industry Revenue (Million), by Mode of Operation 2025 & 2033
- Figure 11: Asia Pacific Air Taxi Industry Revenue Share (%), by Mode of Operation 2025 & 2033
- Figure 12: Asia Pacific Air Taxi Industry Revenue (Million), by Country 2025 & 2033
- Figure 13: Asia Pacific Air Taxi Industry Revenue Share (%), by Country 2025 & 2033
- Figure 14: Latin America Air Taxi Industry Revenue (Million), by Mode of Operation 2025 & 2033
- Figure 15: Latin America Air Taxi Industry Revenue Share (%), by Mode of Operation 2025 & 2033
- Figure 16: Latin America Air Taxi Industry Revenue (Million), by Country 2025 & 2033
- Figure 17: Latin America Air Taxi Industry Revenue Share (%), by Country 2025 & 2033
- Figure 18: Middle East and Africa Air Taxi Industry Revenue (Million), by Mode of Operation 2025 & 2033
- Figure 19: Middle East and Africa Air Taxi Industry Revenue Share (%), by Mode of Operation 2025 & 2033
- Figure 20: Middle East and Africa Air Taxi Industry Revenue (Million), by Country 2025 & 2033
- Figure 21: Middle East and Africa Air Taxi Industry Revenue Share (%), by Country 2025 & 2033
List of Tables
- Table 1: Global Air Taxi Industry Revenue Million Forecast, by Mode of Operation 2020 & 2033
- Table 2: Global Air Taxi Industry Revenue Million Forecast, by Region 2020 & 2033
- Table 3: Global Air Taxi Industry Revenue Million Forecast, by Mode of Operation 2020 & 2033
- Table 4: Global Air Taxi Industry Revenue Million Forecast, by Country 2020 & 2033
- Table 5: United States Air Taxi Industry Revenue (Million) Forecast, by Application 2020 & 2033
- Table 6: Canada Air Taxi Industry Revenue (Million) Forecast, by Application 2020 & 2033
- Table 7: Global Air Taxi Industry Revenue Million Forecast, by Mode of Operation 2020 & 2033
- Table 8: Global Air Taxi Industry Revenue Million Forecast, by Country 2020 & 2033
- Table 9: Germany Air Taxi Industry Revenue (Million) Forecast, by Application 2020 & 2033
- Table 10: United Kingdom Air Taxi Industry Revenue (Million) Forecast, by Application 2020 & 2033
- Table 11: France Air Taxi Industry Revenue (Million) Forecast, by Application 2020 & 2033
- Table 12: Russia Air Taxi Industry Revenue (Million) Forecast, by Application 2020 & 2033
- Table 13: Rest of Europe Air Taxi Industry Revenue (Million) Forecast, by Application 2020 & 2033
- Table 14: Global Air Taxi Industry Revenue Million Forecast, by Mode of Operation 2020 & 2033
- Table 15: Global Air Taxi Industry Revenue Million Forecast, by Country 2020 & 2033
- Table 16: India Air Taxi Industry Revenue (Million) Forecast, by Application 2020 & 2033
- Table 17: China Air Taxi Industry Revenue (Million) Forecast, by Application 2020 & 2033
- Table 18: Japan Air Taxi Industry Revenue (Million) Forecast, by Application 2020 & 2033
- Table 19: South Korea Air Taxi Industry Revenue (Million) Forecast, by Application 2020 & 2033
- Table 20: Australia Air Taxi Industry Revenue (Million) Forecast, by Application 2020 & 2033
- Table 21: Rest of Asia Pacific Air Taxi Industry Revenue (Million) Forecast, by Application 2020 & 2033
- Table 22: Global Air Taxi Industry Revenue Million Forecast, by Mode of Operation 2020 & 2033
- Table 23: Global Air Taxi Industry Revenue Million Forecast, by Country 2020 & 2033
- Table 24: Brazil Air Taxi Industry Revenue (Million) Forecast, by Application 2020 & 2033
- Table 25: Mexico Air Taxi Industry Revenue (Million) Forecast, by Application 2020 & 2033
- Table 26: Rest of Latin America Air Taxi Industry Revenue (Million) Forecast, by Application 2020 & 2033
- Table 27: Global Air Taxi Industry Revenue Million Forecast, by Mode of Operation 2020 & 2033
- Table 28: Global Air Taxi Industry Revenue Million Forecast, by Country 2020 & 2033
- Table 29: Saudi Arabia Air Taxi Industry Revenue (Million) Forecast, by Application 2020 & 2033
- Table 30: Egypt Air Taxi Industry Revenue (Million) Forecast, by Application 2020 & 2033
- Table 31: Israel Air Taxi Industry Revenue (Million) Forecast, by Application 2020 & 2033
- Table 32: Rest of Middle East and Africa Air Taxi Industry Revenue (Million) Forecast, by Application 2020 & 2033
Frequently Asked Questions
1. What is the projected Compound Annual Growth Rate (CAGR) of the Air Taxi Industry?
The projected CAGR is approximately 23.32%.
2. Which companies are prominent players in the Air Taxi Industry?
Key companies in the market include Textron Inc, Lilium GmbH, Joby Aero Inc, Jaunt Air Mobility Corporation, Airbus SE, Hyundai Motor Company, Volocopter GmbH, Wisk Aero LL, Guangzhou EHang Intelligent Technology Co Ltd, The Boeing Company.
3. What are the main segments of the Air Taxi Industry?
The market segments include Mode of Operation.
4. Can you provide details about the market size?
The market size is estimated to be USD 1.41 Million as of 2022.
5. What are some drivers contributing to market growth?
N/A
6. What are the notable trends driving market growth?
Piloted Segment to Dominate Market Share During the Forecast Period.
7. Are there any restraints impacting market growth?
N/A
8. Can you provide examples of recent developments in the market?
N/A
9. What pricing options are available for accessing the report?
Pricing options include single-user, multi-user, and enterprise licenses priced at USD 4750, USD 5250, and USD 8750 respectively.
10. Is the market size provided in terms of value or volume?
The market size is provided in terms of value, measured in Million.
11. Are there any specific market keywords associated with the report?
Yes, the market keyword associated with the report is "Air Taxi Industry," which aids in identifying and referencing the specific market segment covered.
12. How do I determine which pricing option suits my needs best?
The pricing options vary based on user requirements and access needs. Individual users may opt for single-user licenses, while businesses requiring broader access may choose multi-user or enterprise licenses for cost-effective access to the report.
13. Are there any additional resources or data provided in the Air Taxi Industry report?
While the report offers comprehensive insights, it's advisable to review the specific contents or supplementary materials provided to ascertain if additional resources or data are available.
14. How can I stay updated on further developments or reports in the Air Taxi Industry?
To stay informed about further developments, trends, and reports in the Air Taxi Industry, consider subscribing to industry newsletters, following relevant companies and organizations, or regularly checking reputable industry news sources and publications.
Methodology
Step 1 - Identification of Relevant Samples Size from Population Database


Step 2 - Approaches for Defining Global Market Size (Value, Volume* & Price*)

Note*: In applicable scenarios
Step 3 - Data Sources
Primary Research
- Web Analytics
- Survey Reports
- Research Institute
- Latest Research Reports
- Opinion Leaders
Secondary Research
- Annual Reports
- White Paper
- Latest Press Release
- Industry Association
- Paid Database
- Investor Presentations

Step 4 - Data Triangulation
Involves using different sources of information in order to increase the validity of a study
These sources are likely to be stakeholders in a program - participants, other researchers, program staff, other community members, and so on.
Then we put all data in single framework & apply various statistical tools to find out the dynamic on the market.
During the analysis stage, feedback from the stakeholder groups would be compared to determine areas of agreement as well as areas of divergence