

Key Insights
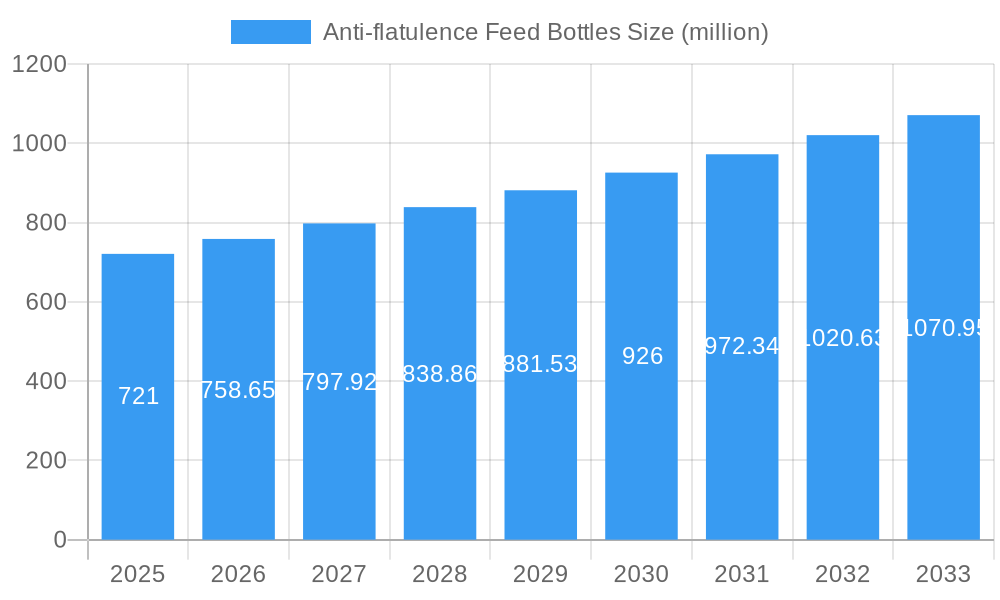
The global anti-flatulence feeding bottle market, valued at $721 million in 2025, is projected to experience robust growth, driven by increasing parental awareness regarding infant colic and digestive issues. The 5.1% CAGR from 2019 to 2024 suggests a steadily expanding market, fueled by technological advancements in bottle design and the rising adoption of specialized feeding solutions aimed at reducing infant discomfort. Key drivers include the growing prevalence of colic among infants, increased disposable incomes in developing economies leading to higher spending on baby products, and the rising popularity of online retail channels providing convenient access to specialized baby products. Market segmentation likely includes variations in bottle material (e.g., silicone, glass, plastic), nipple design (e.g., slow-flow, anti-colic), and price point, catering to diverse consumer needs and preferences. Competitive landscape analysis reveals a mix of established international brands like Philips Avent and Mayborn, alongside regional players like Zhejiang Rikang Baby's Products and Shanghai Alibaby Babythings, indicating potential for both established and emerging companies to thrive.
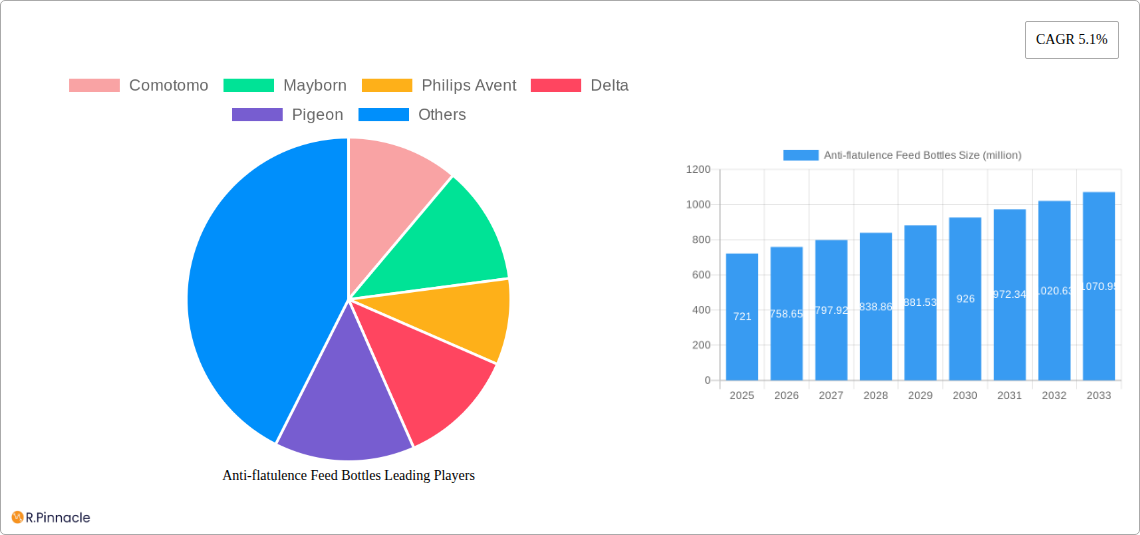
Anti-flatulence Feed Bottles Market Size (In Million)
The market's growth trajectory is expected to remain positive through 2033, although the rate may fluctuate based on economic conditions and evolving parental preferences. Factors potentially restraining growth could include the availability of alternative solutions like breastfeeding and the inherent challenges in demonstrating quantifiable effectiveness of anti-flatulence features in bottles. Furthermore, rigorous safety and regulatory standards surrounding baby products present significant hurdles for manufacturers. To maintain competitive advantage, manufacturers are likely focusing on innovation in bottle design, material selection, and marketing strategies that emphasize health benefits and convenience to parents. This includes emphasizing clinically-tested designs and highlighting the positive impact on infant comfort and parental peace of mind.
Anti-flatulence Feed Bottles Company Market Share
Anti-Flatulence Feed Bottles Market Report: 2019-2033 - A Comprehensive Analysis
This comprehensive report provides a detailed analysis of the global anti-flatulence feed bottles market, offering invaluable insights for industry professionals, investors, and strategic decision-makers. Covering the period from 2019 to 2033, with a base year of 2025 and a forecast period of 2025-2033, this report offers a granular understanding of market dynamics, competitive landscape, and future growth potential. The report values are presented in millions.
Anti-flatulence Feed Bottles Market Structure & Innovation Trends
This section analyzes the market's competitive landscape, focusing on market concentration, key innovation drivers, regulatory frameworks, prevalent product substitutes, end-user demographics, and significant mergers and acquisitions (M&A) activities. The report examines the market share held by leading players such as Comotomo, Mayborn, Philips Avent, Delta, Pigeon, Hegen, Betta, Goodbaby, Beijing Shenchuang Century, Combi, Luv N' Care, Richell, Zhejiang Rikang Baby's Products, Hito, Shanghai Alibaby Babythings, and Mammy Shop. The analysis includes an assessment of M&A deal values, revealing the dynamics of market consolidation and strategic partnerships. Market concentration is assessed with metrics like the Herfindahl-Hirschman Index (HHI) - xx, indicating a moderately concentrated market with xx% market share held by the top 5 players in 2024. The report also investigates regulatory hurdles relating to product safety and material composition, leading to xx million in compliance costs annually. Innovation is driven primarily by the demand for improved anti-colic features and ergonomic designs.
- Market Share Analysis: Detailed breakdown of market share among leading players in 2024 and projected for 2033.
- M&A Activity: Review of significant mergers and acquisitions, including deal values (in millions) and their impact on market dynamics. (xx million in total M&A value for 2019-2024)
- Regulatory Landscape: Analysis of existing and emerging regulations impacting the market, including specific examples.
- Innovation Drivers: Identification and analysis of key factors driving innovation in anti-flatulence feed bottle design and functionality.
Anti-flatulence Feed Bottles Market Dynamics & Trends
This section delves into the market’s dynamic growth trajectory, exploring key growth drivers, technological disruptions, evolving consumer preferences, and intense competitive dynamics. The report will feature a detailed analysis of market growth drivers, including rising awareness of colic in infants and increasing disposable income in emerging economies. Technological disruptions, such as the introduction of new materials and anti-colic valve designs, are also assessed. The impact of these factors on market penetration and compound annual growth rate (CAGR) is quantitatively demonstrated, projecting a CAGR of xx% from 2025 to 2033. Consumer preference shifts towards eco-friendly and sustainable materials are also considered. Competitive dynamics are analyzed through a Porter's Five Forces framework.
- Market Growth Drivers: Detailed examination of factors driving market expansion.
- Technological Disruptions: Assessment of innovative technologies and their impact on market dynamics.
- Consumer Preferences: Analysis of shifting consumer preferences and their influence on product demand.
- Competitive Dynamics: In-depth analysis of competition including pricing strategies, product differentiation, and market share battles.
- Market Size & CAGR: Quantitative data on market size (in millions) for historical, base, and forecast periods, including CAGR projections.
Dominant Regions & Segments in Anti-flatulence Feed Bottles
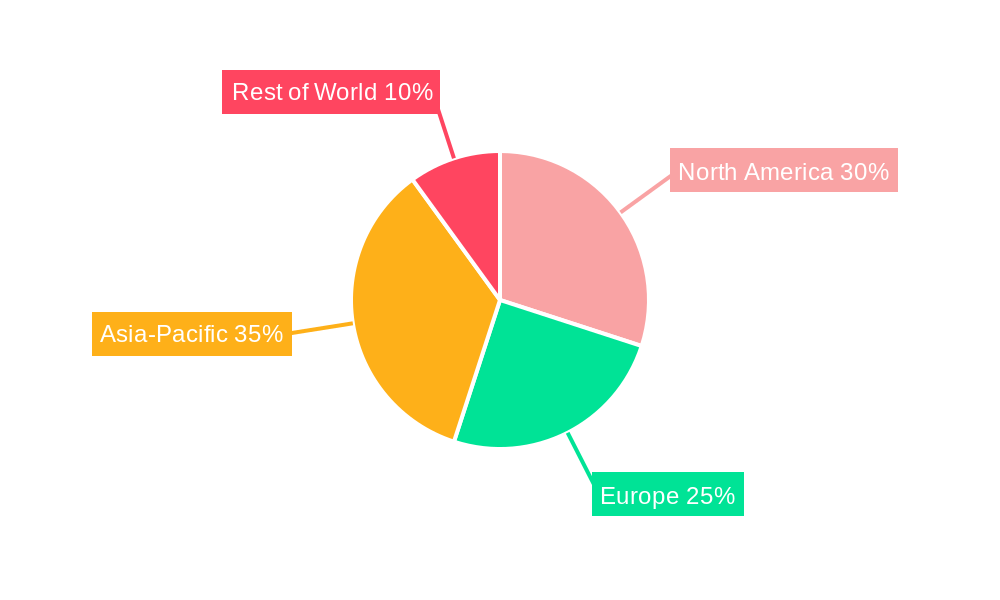
This section identifies the leading geographical regions and market segments within the global anti-flatulence feed bottle market. Detailed analysis of regional dominance is provided, outlining key factors contributing to market leadership in specific regions. The report uses bullet points to highlight key drivers such as economic policies, infrastructure development, and consumer purchasing power. The report will emphasize the dominance of North America (xx million) followed by Asia-Pacific (xx million). The dominance analysis will include a comprehensive discussion of regional market size and growth trends and includes specific case studies.
- North America: Key drivers including strong consumer awareness and high disposable incomes.
- Asia-Pacific: Key drivers such as rapid population growth and increasing disposable incomes in emerging economies.
- Europe: Key drivers like stringent safety regulations and growing health consciousness.
- Other Regions: Overview of market dynamics in other regions.
Anti-flatulence Feed Bottles Product Innovations
This section summarizes recent product developments, applications, and competitive advantages in the anti-flatulence feed bottle market. The focus will be on technological trends impacting product design and functionality, specifically emphasizing innovations aimed at enhancing the anti-colic features and improving user experience. The section also notes the competitive advantages gained by companies through patent protection and proprietary technologies and discusses how well new products meet the market needs. For example, the introduction of self-sterilizing bottles and the use of advanced materials to reduce the risk of colic.
Report Scope & Segmentation Analysis
This section provides a detailed overview of the market segmentation employed in this report. Market segmentation is crucial for understanding the unique characteristics and demands of different customer groups. This will include analysis of segments based on material type (e.g., silicone, glass, plastic), price range (premium, mid-range, budget), and distribution channel (online, offline). Each segment's growth projections, market size, and competitive dynamics are discussed individually.
Key Drivers of Anti-flatulence Feed Bottles Growth
This section outlines the key factors driving the growth of the anti-flatulence feed bottle market. This includes technological advancements (e.g., improved valve systems, innovative materials), economic factors (e.g., rising disposable incomes in developing countries), and regulatory frameworks (e.g., safety standards influencing product design). Specific examples of these drivers and their impact on market expansion are provided.
Challenges in the Anti-flatulence Feed Bottles Sector
This section identifies and discusses the significant challenges and restraints faced by the anti-flatulence feed bottle market. This includes regulatory hurdles (e.g., stringent safety and material certifications), supply chain issues (e.g., material sourcing and manufacturing complexities), and competitive pressures (e.g., intense competition and price wars). The quantitative impact of these challenges on market growth is highlighted. For example, xx million in lost revenue due to supply chain disruptions in 2022.
Emerging Opportunities in Anti-flatulence Feed Bottles
This section highlights emerging trends and opportunities within the anti-flatulence feed bottle market. It focuses on new market segments (e.g., specialized bottles for premature infants), technological advancements (e.g., smart bottles with integrated sensors), and evolving consumer preferences (e.g., demand for eco-friendly materials). These opportunities present potential avenues for market expansion and growth.
Key Developments in Anti-flatulence Feed Bottles Industry
- 2022 Q4: Launch of a new anti-colic bottle with a patented valve system by Comotomo.
- 2023 Q1: Acquisition of a smaller anti-flatulence bottle manufacturer by Philips Avent.
- 2023 Q3: Introduction of a new line of eco-friendly, biodegradable bottles by Pigeon. (Further key developments will be included in the full report)
Future Outlook for Anti-flatulence Feed Bottles Market
The future outlook for the anti-flatulence feed bottle market is positive, driven by continued innovation, increasing consumer awareness, and expanding market penetration in developing countries. Strategic opportunities exist for companies to capitalize on emerging trends like smart bottle technology and sustainable materials. The market is expected to show robust growth over the forecast period, offering substantial potential for both established players and new entrants.
Anti-flatulence Feed Bottles Segmentation
-
1. Application
- 1.1. Supermarket
- 1.2. Maternal and Infant Store
- 1.3. Shopping Mall
- 1.4. Online
- 1.5. Exclusive Shop
-
2. Types
- 2.1. Plastics
- 2.2. Glass
- 2.3. Silicone
- 2.4. Others
Anti-flatulence Feed Bottles Segmentation By Geography
-
1. North America
- 1.1. United States
- 1.2. Canada
- 1.3. Mexico
-
2. South America
- 2.1. Brazil
- 2.2. Argentina
- 2.3. Rest of South America
-
3. Europe
- 3.1. United Kingdom
- 3.2. Germany
- 3.3. France
- 3.4. Italy
- 3.5. Spain
- 3.6. Russia
- 3.7. Benelux
- 3.8. Nordics
- 3.9. Rest of Europe
-
4. Middle East & Africa
- 4.1. Turkey
- 4.2. Israel
- 4.3. GCC
- 4.4. North Africa
- 4.5. South Africa
- 4.6. Rest of Middle East & Africa
-
5. Asia Pacific
- 5.1. China
- 5.2. India
- 5.3. Japan
- 5.4. South Korea
- 5.5. ASEAN
- 5.6. Oceania
- 5.7. Rest of Asia Pacific
Anti-flatulence Feed Bottles Regional Market Share
Geographic Coverage of Anti-flatulence Feed Bottles
Anti-flatulence Feed Bottles REPORT HIGHLIGHTS
| Aspects | Details |
|---|---|
| Study Period | 2020-2034 |
| Base Year | 2025 |
| Estimated Year | 2026 |
| Forecast Period | 2026-2034 |
| Historical Period | 2020-2025 |
| Growth Rate | CAGR of 5.1% from 2020-2034 |
| Segmentation |
|
Table of Contents
- 1. Introduction
- 1.1. Research Scope
- 1.2. Market Segmentation
- 1.3. Research Methodology
- 1.4. Definitions and Assumptions
- 2. Executive Summary
- 2.1. Introduction
- 3. Market Dynamics
- 3.1. Introduction
- 3.2. Market Drivers
- 3.3. Market Restrains
- 3.4. Market Trends
- 4. Market Factor Analysis
- 4.1. Porters Five Forces
- 4.2. Supply/Value Chain
- 4.3. PESTEL analysis
- 4.4. Market Entropy
- 4.5. Patent/Trademark Analysis
- 5. Global Anti-flatulence Feed Bottles Analysis, Insights and Forecast, 2020-2032
- 5.1. Market Analysis, Insights and Forecast - by Application
- 5.1.1. Supermarket
- 5.1.2. Maternal and Infant Store
- 5.1.3. Shopping Mall
- 5.1.4. Online
- 5.1.5. Exclusive Shop
- 5.2. Market Analysis, Insights and Forecast - by Types
- 5.2.1. Plastics
- 5.2.2. Glass
- 5.2.3. Silicone
- 5.2.4. Others
- 5.3. Market Analysis, Insights and Forecast - by Region
- 5.3.1. North America
- 5.3.2. South America
- 5.3.3. Europe
- 5.3.4. Middle East & Africa
- 5.3.5. Asia Pacific
- 5.1. Market Analysis, Insights and Forecast - by Application
- 6. North America Anti-flatulence Feed Bottles Analysis, Insights and Forecast, 2020-2032
- 6.1. Market Analysis, Insights and Forecast - by Application
- 6.1.1. Supermarket
- 6.1.2. Maternal and Infant Store
- 6.1.3. Shopping Mall
- 6.1.4. Online
- 6.1.5. Exclusive Shop
- 6.2. Market Analysis, Insights and Forecast - by Types
- 6.2.1. Plastics
- 6.2.2. Glass
- 6.2.3. Silicone
- 6.2.4. Others
- 6.1. Market Analysis, Insights and Forecast - by Application
- 7. South America Anti-flatulence Feed Bottles Analysis, Insights and Forecast, 2020-2032
- 7.1. Market Analysis, Insights and Forecast - by Application
- 7.1.1. Supermarket
- 7.1.2. Maternal and Infant Store
- 7.1.3. Shopping Mall
- 7.1.4. Online
- 7.1.5. Exclusive Shop
- 7.2. Market Analysis, Insights and Forecast - by Types
- 7.2.1. Plastics
- 7.2.2. Glass
- 7.2.3. Silicone
- 7.2.4. Others
- 7.1. Market Analysis, Insights and Forecast - by Application
- 8. Europe Anti-flatulence Feed Bottles Analysis, Insights and Forecast, 2020-2032
- 8.1. Market Analysis, Insights and Forecast - by Application
- 8.1.1. Supermarket
- 8.1.2. Maternal and Infant Store
- 8.1.3. Shopping Mall
- 8.1.4. Online
- 8.1.5. Exclusive Shop
- 8.2. Market Analysis, Insights and Forecast - by Types
- 8.2.1. Plastics
- 8.2.2. Glass
- 8.2.3. Silicone
- 8.2.4. Others
- 8.1. Market Analysis, Insights and Forecast - by Application
- 9. Middle East & Africa Anti-flatulence Feed Bottles Analysis, Insights and Forecast, 2020-2032
- 9.1. Market Analysis, Insights and Forecast - by Application
- 9.1.1. Supermarket
- 9.1.2. Maternal and Infant Store
- 9.1.3. Shopping Mall
- 9.1.4. Online
- 9.1.5. Exclusive Shop
- 9.2. Market Analysis, Insights and Forecast - by Types
- 9.2.1. Plastics
- 9.2.2. Glass
- 9.2.3. Silicone
- 9.2.4. Others
- 9.1. Market Analysis, Insights and Forecast - by Application
- 10. Asia Pacific Anti-flatulence Feed Bottles Analysis, Insights and Forecast, 2020-2032
- 10.1. Market Analysis, Insights and Forecast - by Application
- 10.1.1. Supermarket
- 10.1.2. Maternal and Infant Store
- 10.1.3. Shopping Mall
- 10.1.4. Online
- 10.1.5. Exclusive Shop
- 10.2. Market Analysis, Insights and Forecast - by Types
- 10.2.1. Plastics
- 10.2.2. Glass
- 10.2.3. Silicone
- 10.2.4. Others
- 10.1. Market Analysis, Insights and Forecast - by Application
- 11. Competitive Analysis
- 11.1. Global Market Share Analysis 2025
- 11.2. Company Profiles
- 11.2.1 Comotomo
- 11.2.1.1. Overview
- 11.2.1.2. Products
- 11.2.1.3. SWOT Analysis
- 11.2.1.4. Recent Developments
- 11.2.1.5. Financials (Based on Availability)
- 11.2.2 Mayborn
- 11.2.2.1. Overview
- 11.2.2.2. Products
- 11.2.2.3. SWOT Analysis
- 11.2.2.4. Recent Developments
- 11.2.2.5. Financials (Based on Availability)
- 11.2.3 Philips Avent
- 11.2.3.1. Overview
- 11.2.3.2. Products
- 11.2.3.3. SWOT Analysis
- 11.2.3.4. Recent Developments
- 11.2.3.5. Financials (Based on Availability)
- 11.2.4 Delta
- 11.2.4.1. Overview
- 11.2.4.2. Products
- 11.2.4.3. SWOT Analysis
- 11.2.4.4. Recent Developments
- 11.2.4.5. Financials (Based on Availability)
- 11.2.5 Pigeon
- 11.2.5.1. Overview
- 11.2.5.2. Products
- 11.2.5.3. SWOT Analysis
- 11.2.5.4. Recent Developments
- 11.2.5.5. Financials (Based on Availability)
- 11.2.6 Hegen
- 11.2.6.1. Overview
- 11.2.6.2. Products
- 11.2.6.3. SWOT Analysis
- 11.2.6.4. Recent Developments
- 11.2.6.5. Financials (Based on Availability)
- 11.2.7 Betta
- 11.2.7.1. Overview
- 11.2.7.2. Products
- 11.2.7.3. SWOT Analysis
- 11.2.7.4. Recent Developments
- 11.2.7.5. Financials (Based on Availability)
- 11.2.8 Goodbaby
- 11.2.8.1. Overview
- 11.2.8.2. Products
- 11.2.8.3. SWOT Analysis
- 11.2.8.4. Recent Developments
- 11.2.8.5. Financials (Based on Availability)
- 11.2.9 Beijing Shenchuang Century
- 11.2.9.1. Overview
- 11.2.9.2. Products
- 11.2.9.3. SWOT Analysis
- 11.2.9.4. Recent Developments
- 11.2.9.5. Financials (Based on Availability)
- 11.2.10 Combi
- 11.2.10.1. Overview
- 11.2.10.2. Products
- 11.2.10.3. SWOT Analysis
- 11.2.10.4. Recent Developments
- 11.2.10.5. Financials (Based on Availability)
- 11.2.11 Luv N' Care
- 11.2.11.1. Overview
- 11.2.11.2. Products
- 11.2.11.3. SWOT Analysis
- 11.2.11.4. Recent Developments
- 11.2.11.5. Financials (Based on Availability)
- 11.2.12 Richell
- 11.2.12.1. Overview
- 11.2.12.2. Products
- 11.2.12.3. SWOT Analysis
- 11.2.12.4. Recent Developments
- 11.2.12.5. Financials (Based on Availability)
- 11.2.13 Zhejiang Rikang Baby's Products
- 11.2.13.1. Overview
- 11.2.13.2. Products
- 11.2.13.3. SWOT Analysis
- 11.2.13.4. Recent Developments
- 11.2.13.5. Financials (Based on Availability)
- 11.2.14 Hito
- 11.2.14.1. Overview
- 11.2.14.2. Products
- 11.2.14.3. SWOT Analysis
- 11.2.14.4. Recent Developments
- 11.2.14.5. Financials (Based on Availability)
- 11.2.15 Shanghai Alibaby Babythings
- 11.2.15.1. Overview
- 11.2.15.2. Products
- 11.2.15.3. SWOT Analysis
- 11.2.15.4. Recent Developments
- 11.2.15.5. Financials (Based on Availability)
- 11.2.16 Mammy Shop
- 11.2.16.1. Overview
- 11.2.16.2. Products
- 11.2.16.3. SWOT Analysis
- 11.2.16.4. Recent Developments
- 11.2.16.5. Financials (Based on Availability)
- 11.2.1 Comotomo
List of Figures
- Figure 1: Global Anti-flatulence Feed Bottles Revenue Breakdown (million, %) by Region 2025 & 2033
- Figure 2: Global Anti-flatulence Feed Bottles Volume Breakdown (K, %) by Region 2025 & 2033
- Figure 3: North America Anti-flatulence Feed Bottles Revenue (million), by Application 2025 & 2033
- Figure 4: North America Anti-flatulence Feed Bottles Volume (K), by Application 2025 & 2033
- Figure 5: North America Anti-flatulence Feed Bottles Revenue Share (%), by Application 2025 & 2033
- Figure 6: North America Anti-flatulence Feed Bottles Volume Share (%), by Application 2025 & 2033
- Figure 7: North America Anti-flatulence Feed Bottles Revenue (million), by Types 2025 & 2033
- Figure 8: North America Anti-flatulence Feed Bottles Volume (K), by Types 2025 & 2033
- Figure 9: North America Anti-flatulence Feed Bottles Revenue Share (%), by Types 2025 & 2033
- Figure 10: North America Anti-flatulence Feed Bottles Volume Share (%), by Types 2025 & 2033
- Figure 11: North America Anti-flatulence Feed Bottles Revenue (million), by Country 2025 & 2033
- Figure 12: North America Anti-flatulence Feed Bottles Volume (K), by Country 2025 & 2033
- Figure 13: North America Anti-flatulence Feed Bottles Revenue Share (%), by Country 2025 & 2033
- Figure 14: North America Anti-flatulence Feed Bottles Volume Share (%), by Country 2025 & 2033
- Figure 15: South America Anti-flatulence Feed Bottles Revenue (million), by Application 2025 & 2033
- Figure 16: South America Anti-flatulence Feed Bottles Volume (K), by Application 2025 & 2033
- Figure 17: South America Anti-flatulence Feed Bottles Revenue Share (%), by Application 2025 & 2033
- Figure 18: South America Anti-flatulence Feed Bottles Volume Share (%), by Application 2025 & 2033
- Figure 19: South America Anti-flatulence Feed Bottles Revenue (million), by Types 2025 & 2033
- Figure 20: South America Anti-flatulence Feed Bottles Volume (K), by Types 2025 & 2033
- Figure 21: South America Anti-flatulence Feed Bottles Revenue Share (%), by Types 2025 & 2033
- Figure 22: South America Anti-flatulence Feed Bottles Volume Share (%), by Types 2025 & 2033
- Figure 23: South America Anti-flatulence Feed Bottles Revenue (million), by Country 2025 & 2033
- Figure 24: South America Anti-flatulence Feed Bottles Volume (K), by Country 2025 & 2033
- Figure 25: South America Anti-flatulence Feed Bottles Revenue Share (%), by Country 2025 & 2033
- Figure 26: South America Anti-flatulence Feed Bottles Volume Share (%), by Country 2025 & 2033
- Figure 27: Europe Anti-flatulence Feed Bottles Revenue (million), by Application 2025 & 2033
- Figure 28: Europe Anti-flatulence Feed Bottles Volume (K), by Application 2025 & 2033
- Figure 29: Europe Anti-flatulence Feed Bottles Revenue Share (%), by Application 2025 & 2033
- Figure 30: Europe Anti-flatulence Feed Bottles Volume Share (%), by Application 2025 & 2033
- Figure 31: Europe Anti-flatulence Feed Bottles Revenue (million), by Types 2025 & 2033
- Figure 32: Europe Anti-flatulence Feed Bottles Volume (K), by Types 2025 & 2033
- Figure 33: Europe Anti-flatulence Feed Bottles Revenue Share (%), by Types 2025 & 2033
- Figure 34: Europe Anti-flatulence Feed Bottles Volume Share (%), by Types 2025 & 2033
- Figure 35: Europe Anti-flatulence Feed Bottles Revenue (million), by Country 2025 & 2033
- Figure 36: Europe Anti-flatulence Feed Bottles Volume (K), by Country 2025 & 2033
- Figure 37: Europe Anti-flatulence Feed Bottles Revenue Share (%), by Country 2025 & 2033
- Figure 38: Europe Anti-flatulence Feed Bottles Volume Share (%), by Country 2025 & 2033
- Figure 39: Middle East & Africa Anti-flatulence Feed Bottles Revenue (million), by Application 2025 & 2033
- Figure 40: Middle East & Africa Anti-flatulence Feed Bottles Volume (K), by Application 2025 & 2033
- Figure 41: Middle East & Africa Anti-flatulence Feed Bottles Revenue Share (%), by Application 2025 & 2033
- Figure 42: Middle East & Africa Anti-flatulence Feed Bottles Volume Share (%), by Application 2025 & 2033
- Figure 43: Middle East & Africa Anti-flatulence Feed Bottles Revenue (million), by Types 2025 & 2033
- Figure 44: Middle East & Africa Anti-flatulence Feed Bottles Volume (K), by Types 2025 & 2033
- Figure 45: Middle East & Africa Anti-flatulence Feed Bottles Revenue Share (%), by Types 2025 & 2033
- Figure 46: Middle East & Africa Anti-flatulence Feed Bottles Volume Share (%), by Types 2025 & 2033
- Figure 47: Middle East & Africa Anti-flatulence Feed Bottles Revenue (million), by Country 2025 & 2033
- Figure 48: Middle East & Africa Anti-flatulence Feed Bottles Volume (K), by Country 2025 & 2033
- Figure 49: Middle East & Africa Anti-flatulence Feed Bottles Revenue Share (%), by Country 2025 & 2033
- Figure 50: Middle East & Africa Anti-flatulence Feed Bottles Volume Share (%), by Country 2025 & 2033
- Figure 51: Asia Pacific Anti-flatulence Feed Bottles Revenue (million), by Application 2025 & 2033
- Figure 52: Asia Pacific Anti-flatulence Feed Bottles Volume (K), by Application 2025 & 2033
- Figure 53: Asia Pacific Anti-flatulence Feed Bottles Revenue Share (%), by Application 2025 & 2033
- Figure 54: Asia Pacific Anti-flatulence Feed Bottles Volume Share (%), by Application 2025 & 2033
- Figure 55: Asia Pacific Anti-flatulence Feed Bottles Revenue (million), by Types 2025 & 2033
- Figure 56: Asia Pacific Anti-flatulence Feed Bottles Volume (K), by Types 2025 & 2033
- Figure 57: Asia Pacific Anti-flatulence Feed Bottles Revenue Share (%), by Types 2025 & 2033
- Figure 58: Asia Pacific Anti-flatulence Feed Bottles Volume Share (%), by Types 2025 & 2033
- Figure 59: Asia Pacific Anti-flatulence Feed Bottles Revenue (million), by Country 2025 & 2033
- Figure 60: Asia Pacific Anti-flatulence Feed Bottles Volume (K), by Country 2025 & 2033
- Figure 61: Asia Pacific Anti-flatulence Feed Bottles Revenue Share (%), by Country 2025 & 2033
- Figure 62: Asia Pacific Anti-flatulence Feed Bottles Volume Share (%), by Country 2025 & 2033
List of Tables
- Table 1: Global Anti-flatulence Feed Bottles Revenue million Forecast, by Application 2020 & 2033
- Table 2: Global Anti-flatulence Feed Bottles Volume K Forecast, by Application 2020 & 2033
- Table 3: Global Anti-flatulence Feed Bottles Revenue million Forecast, by Types 2020 & 2033
- Table 4: Global Anti-flatulence Feed Bottles Volume K Forecast, by Types 2020 & 2033
- Table 5: Global Anti-flatulence Feed Bottles Revenue million Forecast, by Region 2020 & 2033
- Table 6: Global Anti-flatulence Feed Bottles Volume K Forecast, by Region 2020 & 2033
- Table 7: Global Anti-flatulence Feed Bottles Revenue million Forecast, by Application 2020 & 2033
- Table 8: Global Anti-flatulence Feed Bottles Volume K Forecast, by Application 2020 & 2033
- Table 9: Global Anti-flatulence Feed Bottles Revenue million Forecast, by Types 2020 & 2033
- Table 10: Global Anti-flatulence Feed Bottles Volume K Forecast, by Types 2020 & 2033
- Table 11: Global Anti-flatulence Feed Bottles Revenue million Forecast, by Country 2020 & 2033
- Table 12: Global Anti-flatulence Feed Bottles Volume K Forecast, by Country 2020 & 2033
- Table 13: United States Anti-flatulence Feed Bottles Revenue (million) Forecast, by Application 2020 & 2033
- Table 14: United States Anti-flatulence Feed Bottles Volume (K) Forecast, by Application 2020 & 2033
- Table 15: Canada Anti-flatulence Feed Bottles Revenue (million) Forecast, by Application 2020 & 2033
- Table 16: Canada Anti-flatulence Feed Bottles Volume (K) Forecast, by Application 2020 & 2033
- Table 17: Mexico Anti-flatulence Feed Bottles Revenue (million) Forecast, by Application 2020 & 2033
- Table 18: Mexico Anti-flatulence Feed Bottles Volume (K) Forecast, by Application 2020 & 2033
- Table 19: Global Anti-flatulence Feed Bottles Revenue million Forecast, by Application 2020 & 2033
- Table 20: Global Anti-flatulence Feed Bottles Volume K Forecast, by Application 2020 & 2033
- Table 21: Global Anti-flatulence Feed Bottles Revenue million Forecast, by Types 2020 & 2033
- Table 22: Global Anti-flatulence Feed Bottles Volume K Forecast, by Types 2020 & 2033
- Table 23: Global Anti-flatulence Feed Bottles Revenue million Forecast, by Country 2020 & 2033
- Table 24: Global Anti-flatulence Feed Bottles Volume K Forecast, by Country 2020 & 2033
- Table 25: Brazil Anti-flatulence Feed Bottles Revenue (million) Forecast, by Application 2020 & 2033
- Table 26: Brazil Anti-flatulence Feed Bottles Volume (K) Forecast, by Application 2020 & 2033
- Table 27: Argentina Anti-flatulence Feed Bottles Revenue (million) Forecast, by Application 2020 & 2033
- Table 28: Argentina Anti-flatulence Feed Bottles Volume (K) Forecast, by Application 2020 & 2033
- Table 29: Rest of South America Anti-flatulence Feed Bottles Revenue (million) Forecast, by Application 2020 & 2033
- Table 30: Rest of South America Anti-flatulence Feed Bottles Volume (K) Forecast, by Application 2020 & 2033
- Table 31: Global Anti-flatulence Feed Bottles Revenue million Forecast, by Application 2020 & 2033
- Table 32: Global Anti-flatulence Feed Bottles Volume K Forecast, by Application 2020 & 2033
- Table 33: Global Anti-flatulence Feed Bottles Revenue million Forecast, by Types 2020 & 2033
- Table 34: Global Anti-flatulence Feed Bottles Volume K Forecast, by Types 2020 & 2033
- Table 35: Global Anti-flatulence Feed Bottles Revenue million Forecast, by Country 2020 & 2033
- Table 36: Global Anti-flatulence Feed Bottles Volume K Forecast, by Country 2020 & 2033
- Table 37: United Kingdom Anti-flatulence Feed Bottles Revenue (million) Forecast, by Application 2020 & 2033
- Table 38: United Kingdom Anti-flatulence Feed Bottles Volume (K) Forecast, by Application 2020 & 2033
- Table 39: Germany Anti-flatulence Feed Bottles Revenue (million) Forecast, by Application 2020 & 2033
- Table 40: Germany Anti-flatulence Feed Bottles Volume (K) Forecast, by Application 2020 & 2033
- Table 41: France Anti-flatulence Feed Bottles Revenue (million) Forecast, by Application 2020 & 2033
- Table 42: France Anti-flatulence Feed Bottles Volume (K) Forecast, by Application 2020 & 2033
- Table 43: Italy Anti-flatulence Feed Bottles Revenue (million) Forecast, by Application 2020 & 2033
- Table 44: Italy Anti-flatulence Feed Bottles Volume (K) Forecast, by Application 2020 & 2033
- Table 45: Spain Anti-flatulence Feed Bottles Revenue (million) Forecast, by Application 2020 & 2033
- Table 46: Spain Anti-flatulence Feed Bottles Volume (K) Forecast, by Application 2020 & 2033
- Table 47: Russia Anti-flatulence Feed Bottles Revenue (million) Forecast, by Application 2020 & 2033
- Table 48: Russia Anti-flatulence Feed Bottles Volume (K) Forecast, by Application 2020 & 2033
- Table 49: Benelux Anti-flatulence Feed Bottles Revenue (million) Forecast, by Application 2020 & 2033
- Table 50: Benelux Anti-flatulence Feed Bottles Volume (K) Forecast, by Application 2020 & 2033
- Table 51: Nordics Anti-flatulence Feed Bottles Revenue (million) Forecast, by Application 2020 & 2033
- Table 52: Nordics Anti-flatulence Feed Bottles Volume (K) Forecast, by Application 2020 & 2033
- Table 53: Rest of Europe Anti-flatulence Feed Bottles Revenue (million) Forecast, by Application 2020 & 2033
- Table 54: Rest of Europe Anti-flatulence Feed Bottles Volume (K) Forecast, by Application 2020 & 2033
- Table 55: Global Anti-flatulence Feed Bottles Revenue million Forecast, by Application 2020 & 2033
- Table 56: Global Anti-flatulence Feed Bottles Volume K Forecast, by Application 2020 & 2033
- Table 57: Global Anti-flatulence Feed Bottles Revenue million Forecast, by Types 2020 & 2033
- Table 58: Global Anti-flatulence Feed Bottles Volume K Forecast, by Types 2020 & 2033
- Table 59: Global Anti-flatulence Feed Bottles Revenue million Forecast, by Country 2020 & 2033
- Table 60: Global Anti-flatulence Feed Bottles Volume K Forecast, by Country 2020 & 2033
- Table 61: Turkey Anti-flatulence Feed Bottles Revenue (million) Forecast, by Application 2020 & 2033
- Table 62: Turkey Anti-flatulence Feed Bottles Volume (K) Forecast, by Application 2020 & 2033
- Table 63: Israel Anti-flatulence Feed Bottles Revenue (million) Forecast, by Application 2020 & 2033
- Table 64: Israel Anti-flatulence Feed Bottles Volume (K) Forecast, by Application 2020 & 2033
- Table 65: GCC Anti-flatulence Feed Bottles Revenue (million) Forecast, by Application 2020 & 2033
- Table 66: GCC Anti-flatulence Feed Bottles Volume (K) Forecast, by Application 2020 & 2033
- Table 67: North Africa Anti-flatulence Feed Bottles Revenue (million) Forecast, by Application 2020 & 2033
- Table 68: North Africa Anti-flatulence Feed Bottles Volume (K) Forecast, by Application 2020 & 2033
- Table 69: South Africa Anti-flatulence Feed Bottles Revenue (million) Forecast, by Application 2020 & 2033
- Table 70: South Africa Anti-flatulence Feed Bottles Volume (K) Forecast, by Application 2020 & 2033
- Table 71: Rest of Middle East & Africa Anti-flatulence Feed Bottles Revenue (million) Forecast, by Application 2020 & 2033
- Table 72: Rest of Middle East & Africa Anti-flatulence Feed Bottles Volume (K) Forecast, by Application 2020 & 2033
- Table 73: Global Anti-flatulence Feed Bottles Revenue million Forecast, by Application 2020 & 2033
- Table 74: Global Anti-flatulence Feed Bottles Volume K Forecast, by Application 2020 & 2033
- Table 75: Global Anti-flatulence Feed Bottles Revenue million Forecast, by Types 2020 & 2033
- Table 76: Global Anti-flatulence Feed Bottles Volume K Forecast, by Types 2020 & 2033
- Table 77: Global Anti-flatulence Feed Bottles Revenue million Forecast, by Country 2020 & 2033
- Table 78: Global Anti-flatulence Feed Bottles Volume K Forecast, by Country 2020 & 2033
- Table 79: China Anti-flatulence Feed Bottles Revenue (million) Forecast, by Application 2020 & 2033
- Table 80: China Anti-flatulence Feed Bottles Volume (K) Forecast, by Application 2020 & 2033
- Table 81: India Anti-flatulence Feed Bottles Revenue (million) Forecast, by Application 2020 & 2033
- Table 82: India Anti-flatulence Feed Bottles Volume (K) Forecast, by Application 2020 & 2033
- Table 83: Japan Anti-flatulence Feed Bottles Revenue (million) Forecast, by Application 2020 & 2033
- Table 84: Japan Anti-flatulence Feed Bottles Volume (K) Forecast, by Application 2020 & 2033
- Table 85: South Korea Anti-flatulence Feed Bottles Revenue (million) Forecast, by Application 2020 & 2033
- Table 86: South Korea Anti-flatulence Feed Bottles Volume (K) Forecast, by Application 2020 & 2033
- Table 87: ASEAN Anti-flatulence Feed Bottles Revenue (million) Forecast, by Application 2020 & 2033
- Table 88: ASEAN Anti-flatulence Feed Bottles Volume (K) Forecast, by Application 2020 & 2033
- Table 89: Oceania Anti-flatulence Feed Bottles Revenue (million) Forecast, by Application 2020 & 2033
- Table 90: Oceania Anti-flatulence Feed Bottles Volume (K) Forecast, by Application 2020 & 2033
- Table 91: Rest of Asia Pacific Anti-flatulence Feed Bottles Revenue (million) Forecast, by Application 2020 & 2033
- Table 92: Rest of Asia Pacific Anti-flatulence Feed Bottles Volume (K) Forecast, by Application 2020 & 2033
Frequently Asked Questions
1. What is the projected Compound Annual Growth Rate (CAGR) of the Anti-flatulence Feed Bottles?
The projected CAGR is approximately 5.1%.
2. Which companies are prominent players in the Anti-flatulence Feed Bottles?
Key companies in the market include Comotomo, Mayborn, Philips Avent, Delta, Pigeon, Hegen, Betta, Goodbaby, Beijing Shenchuang Century, Combi, Luv N' Care, Richell, Zhejiang Rikang Baby's Products, Hito, Shanghai Alibaby Babythings, Mammy Shop.
3. What are the main segments of the Anti-flatulence Feed Bottles?
The market segments include Application, Types.
4. Can you provide details about the market size?
The market size is estimated to be USD 721 million as of 2022.
5. What are some drivers contributing to market growth?
N/A
6. What are the notable trends driving market growth?
N/A
7. Are there any restraints impacting market growth?
N/A
8. Can you provide examples of recent developments in the market?
N/A
9. What pricing options are available for accessing the report?
Pricing options include single-user, multi-user, and enterprise licenses priced at USD 3950.00, USD 5925.00, and USD 7900.00 respectively.
10. Is the market size provided in terms of value or volume?
The market size is provided in terms of value, measured in million and volume, measured in K.
11. Are there any specific market keywords associated with the report?
Yes, the market keyword associated with the report is "Anti-flatulence Feed Bottles," which aids in identifying and referencing the specific market segment covered.
12. How do I determine which pricing option suits my needs best?
The pricing options vary based on user requirements and access needs. Individual users may opt for single-user licenses, while businesses requiring broader access may choose multi-user or enterprise licenses for cost-effective access to the report.
13. Are there any additional resources or data provided in the Anti-flatulence Feed Bottles report?
While the report offers comprehensive insights, it's advisable to review the specific contents or supplementary materials provided to ascertain if additional resources or data are available.
14. How can I stay updated on further developments or reports in the Anti-flatulence Feed Bottles?
To stay informed about further developments, trends, and reports in the Anti-flatulence Feed Bottles, consider subscribing to industry newsletters, following relevant companies and organizations, or regularly checking reputable industry news sources and publications.
Methodology
Step 1 - Identification of Relevant Samples Size from Population Database


Step 2 - Approaches for Defining Global Market Size (Value, Volume* & Price*)

Note*: In applicable scenarios
Step 3 - Data Sources
Primary Research
- Web Analytics
- Survey Reports
- Research Institute
- Latest Research Reports
- Opinion Leaders
Secondary Research
- Annual Reports
- White Paper
- Latest Press Release
- Industry Association
- Paid Database
- Investor Presentations

Step 4 - Data Triangulation
Involves using different sources of information in order to increase the validity of a study
These sources are likely to be stakeholders in a program - participants, other researchers, program staff, other community members, and so on.
Then we put all data in single framework & apply various statistical tools to find out the dynamic on the market.
During the analysis stage, feedback from the stakeholder groups would be compared to determine areas of agreement as well as areas of divergence