

Key Insights
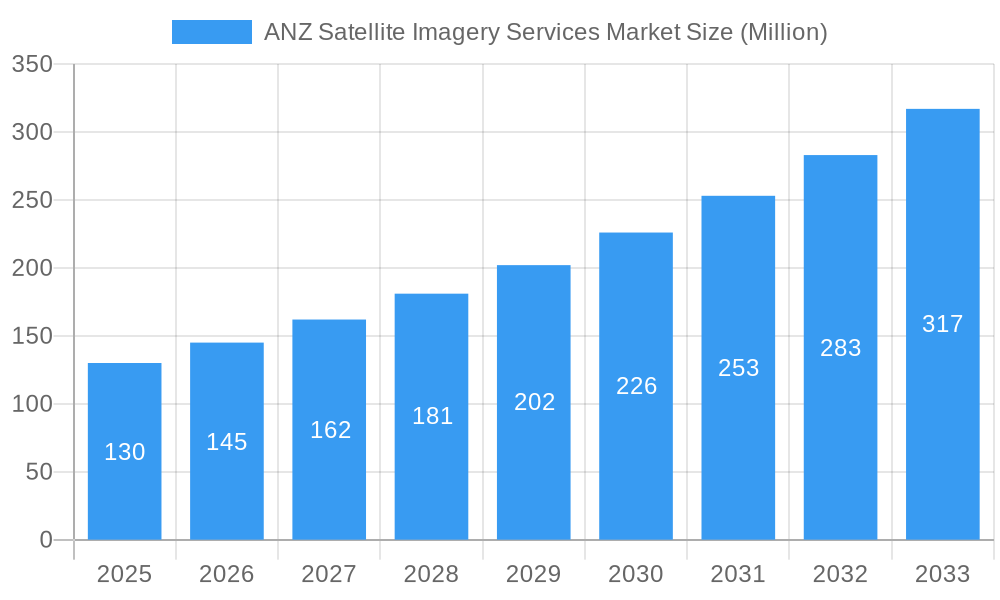
The Australian and New Zealand (ANZ) satellite imagery services market, currently valued at $0.13 billion in 2025, is projected to experience robust growth, driven by a compound annual growth rate (CAGR) of 11.61% from 2025 to 2033. This expansion is fueled by several key factors. Firstly, increasing government initiatives focused on infrastructure development, precision agriculture, and environmental monitoring are creating significant demand for high-resolution satellite imagery. Secondly, the rising adoption of advanced analytics and AI for processing and interpreting this data is unlocking valuable insights across various sectors. The construction, transportation and logistics, and agriculture industries are major beneficiaries, utilizing satellite imagery for project planning, route optimization, and crop monitoring. Furthermore, the growing awareness of environmental conservation and disaster management is boosting demand for satellite imagery in research and mitigation efforts. The market is segmented by application (geospatial data acquisition and mapping, natural resource management, surveillance and security, conservation and research, disaster management, and intelligence) and end-user (government, construction, transportation and logistics, military and defense, forestry and agriculture, and other end-users). Competition is fierce, with both international players like Airbus and L3Harris, and domestic firms like Nearmap and Aerometrex vying for market share. The market's growth is expected to be particularly strong in urban areas and regions with significant infrastructure projects.
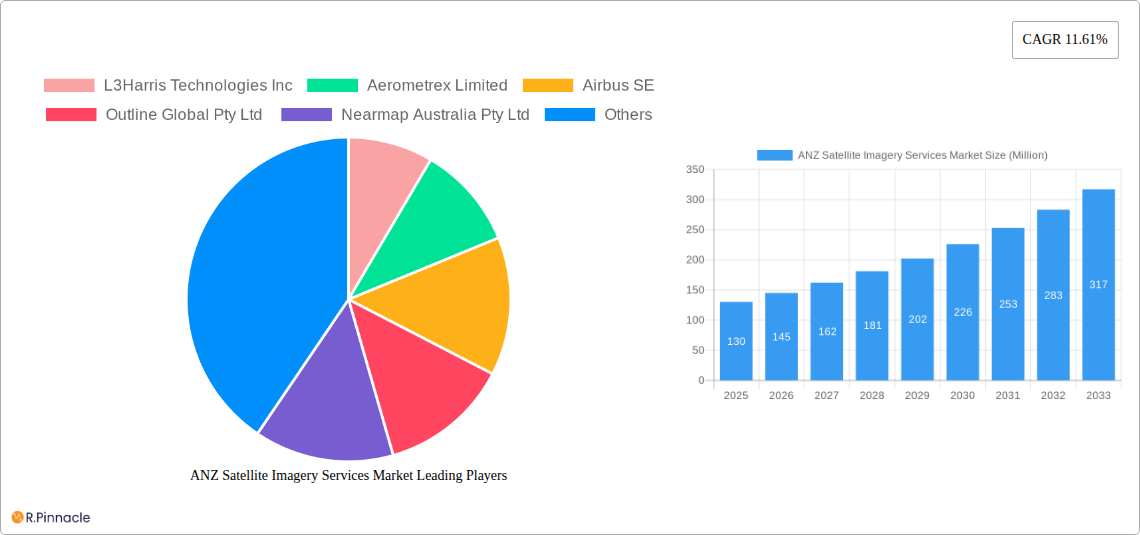
ANZ Satellite Imagery Services Market Market Size (In Million)
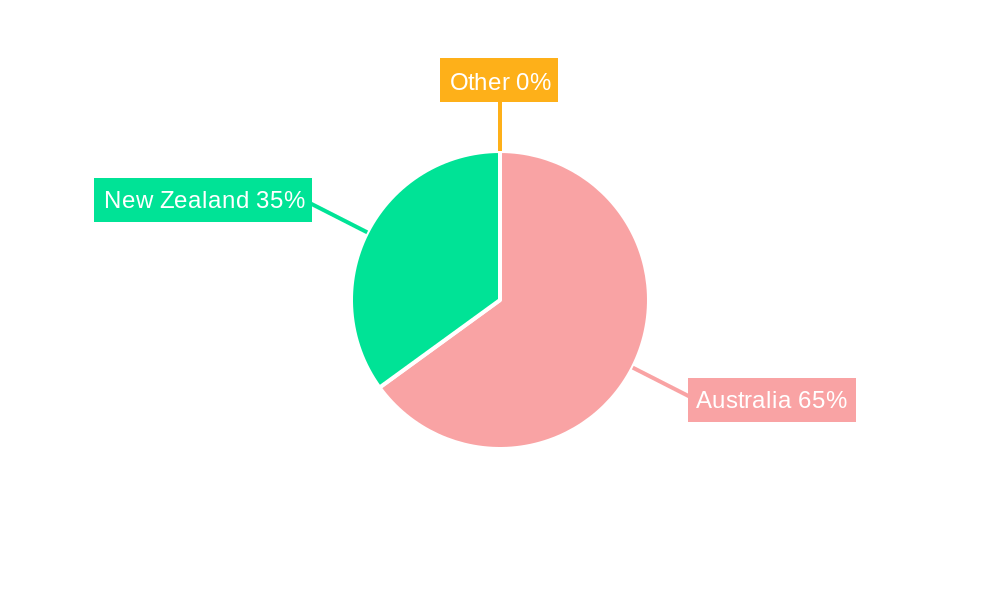
The ANZ region's unique geographical characteristics and regulatory landscape contribute to the market’s specific dynamics. Australia's vast landmass and remote areas make satellite imagery a crucial tool for surveying and resource management. New Zealand's focus on sustainable agriculture and environmental protection similarly fuels demand. The market is expected to see continued innovation in satellite technology, with higher resolution imagery, improved data processing capabilities, and the emergence of new applications driving further expansion. While challenges remain, including data privacy concerns and the need for skilled professionals, the overall outlook for the ANZ satellite imagery services market is highly positive, promising significant growth opportunities for businesses operating in this sector.
ANZ Satellite Imagery Services Market Company Market Share
ANZ Satellite Imagery Services Market Report: 2019-2033
This comprehensive report provides an in-depth analysis of the Australian and New Zealand (ANZ) satellite imagery services market, offering invaluable insights for industry professionals, investors, and strategic planners. Covering the period 2019-2033, with a focus on 2025, this report unveils market trends, competitive dynamics, and future growth opportunities.
ANZ Satellite Imagery Services Market Structure & Innovation Trends
The ANZ satellite imagery services market exhibits a moderately concentrated structure, with key players like L3Harris Technologies Inc, Airbus SE, and Nearmap Australia Pty Ltd holding significant market share. However, the market also features a dynamic landscape of smaller, specialized firms like Arlula Pty Ltd and Geoimage Pty Ltd, driving innovation and competition. Market share data for 2025 suggests Nearmap holds approximately xx%, while L3Harris and Airbus each command approximately xx%. The remaining market share is distributed amongst smaller players.
Innovation is driven by advancements in sensor technology, improved data processing capabilities (including AI and machine learning), and the increasing availability of high-resolution imagery. Regulatory frameworks, such as those governing data privacy and security, significantly impact market operations. Substitutes, such as aerial photography and LiDAR, compete to a limited extent, depending on specific application needs. M&A activity in the sector has been relatively low in recent years, with the total value of deals in the period 2019-2024 estimated at xx Million. However, strategic partnerships and collaborations are increasingly common, particularly between data providers and software developers.
- Market Concentration: Moderately concentrated, with a few major players and numerous smaller firms.
- Innovation Drivers: Sensor technology, data processing advancements, high-resolution imagery.
- Regulatory Framework: Influences data privacy, security, and market access.
- Product Substitutes: Aerial photography and LiDAR offer some competition.
- M&A Activity: Relatively low in recent years, valued at approximately xx Million from 2019-2024.
ANZ Satellite Imagery Services Market Dynamics & Trends
The ANZ satellite imagery services market is experiencing robust growth, driven by increasing demand across various sectors. The Compound Annual Growth Rate (CAGR) is projected at xx% from 2025 to 2033, reaching a market value of xx Million by 2033. This growth is fueled by technological advancements that enhance image resolution, processing speed, and analytical capabilities. Government initiatives promoting digital transformation and infrastructure development also contribute to this upward trend. Increased adoption of satellite imagery in natural resource management, precision agriculture, and infrastructure development are key drivers. The market penetration rate is expected to increase from xx% in 2025 to xx% by 2033, demonstrating substantial market potential. Competitive dynamics are characterized by both intense rivalry and collaborative partnerships, with major players focusing on innovation, strategic acquisitions, and the development of comprehensive data solutions.
Dominant Regions & Segments in ANZ Satellite Imagery Services Market
The Australian market currently dominates the ANZ region due to its larger economy and extensive infrastructure projects. Within the application segments, Geospatial Data Acquisition and Mapping and Natural Resource Management are leading sectors. Within the end-user segment, Government, followed by Construction and Military & Defense, are the most significant consumers of satellite imagery services.
- Key Drivers for Australia: Robust economy, large-scale infrastructure projects, government support for geospatial technologies.
- Key Drivers for New Zealand: Increasing focus on environmental monitoring, precision agriculture, and tourism management.
- Dominant Application Segment: Geospatial Data Acquisition and Mapping and Natural Resource Management.
- Dominant End-User Segment: Government, Construction, Military and Defense.
Detailed Dominance Analysis: The dominance of the Australian market is due to a combination of factors including higher government spending on infrastructure and defense, greater demand from the mining and agricultural sectors, and a more developed geospatial data infrastructure. New Zealand's market, while smaller, is experiencing rapid growth due to an increased focus on environmental monitoring and sustainable resource management. The Geospatial Data Acquisition and Mapping segment's dominance reflects the fundamental role of satellite imagery in creating precise maps and geographic information systems (GIS) for various applications.
ANZ Satellite Imagery Services Market Product Innovations
Recent innovations in ANZ satellite imagery services include improvements in image resolution, spectral capabilities (e.g., hyperspectral and multispectral imagery), and data analytics tools. The integration of artificial intelligence and machine learning algorithms is enhancing the efficiency and accuracy of image processing, leading to more sophisticated applications like automated feature extraction and object detection. This improves the market fit by addressing the growing demand for actionable insights from satellite data.
Report Scope & Segmentation Analysis
This report segments the ANZ satellite imagery services market by application (Geospatial Data Acquisition and Mapping, Natural Resource Management, Surveillance and Security, Conservation and Research, Disaster Management, Intelligence) and by end-user (Government, Construction, Transportation and Logistics, Military and Defense, Forestry and Agriculture, Other End-Users). Each segment is analyzed in detail, including market size projections, growth rates, and competitive dynamics. For instance, the Geospatial Data Acquisition and Mapping segment is expected to experience a CAGR of xx% during the forecast period, while the Government end-user segment will drive significant growth due to increasing government investment in infrastructure development and national security initiatives.
Key Drivers of ANZ Satellite Imagery Services Market Growth
Several factors contribute to the market's growth. Technological advancements such as improved sensor technology and AI-powered image analysis enhance the value and applications of satellite imagery. Strong government support for infrastructure development and environmental monitoring initiatives creates significant demand. Furthermore, the increasing need for precise location data in sectors like agriculture and logistics fuels market expansion.
Challenges in the ANZ Satellite Imagery Services Market Sector
The ANZ satellite imagery services market faces challenges, including the high initial investment costs associated with satellite technology and data acquisition. Data security and privacy concerns also pose significant hurdles, requiring robust regulatory compliance and data protection measures. Furthermore, competition from alternative data sources and the need to manage vast amounts of data effectively pose ongoing challenges to market players.
Emerging Opportunities in ANZ Satellite Imagery Services Market
Emerging opportunities lie in the increasing adoption of cloud-based solutions for data storage and processing. The integration of satellite imagery with other data sources, such as IoT sensors and social media data, offers potential for developing more comprehensive and insightful applications. Furthermore, the growth of the space economy and increased accessibility to satellite data creates avenues for new entrants and innovative business models.
Leading Players in the ANZ Satellite Imagery Services Market Market
- L3Harris Technologies Inc
- Aerometrex Limited
- Airbus SE
- Outline Global Pty Ltd
- Nearmap Australia Pty Ltd
- Arlula Pty Ltd
- Geoimage Pty Ltd
- Toitu Te Whenua Land Information New Zealand
- Geospatial Intelligence Pty Ltd
- Planet Labs PBC
- Western Australian Land Information Authority (Landgate)
Key Developments in ANZ Satellite Imagery Services Market Industry
- May 2023: Arlula secured AUD 2.2 Million (USD 1.5 Million) in funding, boosting access to Earth Observation data. This signifies increased industry interest in transforming EO data accessibility.
- May 2023: SouthPAN, partnering with Geoscience Australia and Toitu Te Whenua Land Information New Zealand, contracted Inmarsat Australia for satellite positioning services. This improves safety tracking, farm productivity, and transportation management.
Future Outlook for ANZ Satellite Imagery Services Market Market
The ANZ satellite imagery services market is poised for continued expansion, driven by technological advancements, increased government investment, and growing demand from diverse sectors. Strategic partnerships, the development of innovative applications, and the increasing accessibility of high-resolution imagery will further fuel market growth. The market's future potential is substantial, offering significant opportunities for existing players and new entrants alike.
ANZ Satellite Imagery Services Market Segmentation
-
1. Application
- 1.1. Geospatial Data Acquisition and Mapping
- 1.2. Natural Resource Management
- 1.3. Surveillance and Security
- 1.4. Conservation and Research
- 1.5. Disaster Management
- 1.6. Intelligence
-
2. End-User
- 2.1. Government
- 2.2. Construction
- 2.3. Transportation and Logistics
- 2.4. Military and Defense
- 2.5. Forestry and Agriculture
- 2.6. Other End-Users
ANZ Satellite Imagery Services Market Segmentation By Geography
-
1. North America
- 1.1. United States
- 1.2. Canada
- 1.3. Mexico
-
2. South America
- 2.1. Brazil
- 2.2. Argentina
- 2.3. Rest of South America
-
3. Europe
- 3.1. United Kingdom
- 3.2. Germany
- 3.3. France
- 3.4. Italy
- 3.5. Spain
- 3.6. Russia
- 3.7. Benelux
- 3.8. Nordics
- 3.9. Rest of Europe
-
4. Middle East & Africa
- 4.1. Turkey
- 4.2. Israel
- 4.3. GCC
- 4.4. North Africa
- 4.5. South Africa
- 4.6. Rest of Middle East & Africa
-
5. Asia Pacific
- 5.1. China
- 5.2. India
- 5.3. Japan
- 5.4. South Korea
- 5.5. ASEAN
- 5.6. Oceania
- 5.7. Rest of Asia Pacific
ANZ Satellite Imagery Services Market Regional Market Share
Geographic Coverage of ANZ Satellite Imagery Services Market
ANZ Satellite Imagery Services Market REPORT HIGHLIGHTS
| Aspects | Details |
|---|---|
| Study Period | 2020-2034 |
| Base Year | 2025 |
| Estimated Year | 2026 |
| Forecast Period | 2026-2034 |
| Historical Period | 2020-2025 |
| Growth Rate | CAGR of 11.61% from 2020-2034 |
| Segmentation |
|
Table of Contents
- 1. Introduction
- 1.1. Research Scope
- 1.2. Market Segmentation
- 1.3. Research Objective
- 1.4. Definitions and Assumptions
- 2. Executive Summary
- 2.1. Market Snapshot
- 3. Market Dynamics
- 3.1. Market Drivers
- 3.2. Market Restrains
- 3.3. Market Trends
- 3.4. Market Opportunities
- 4. Market Factor Analysis
- 4.1. Porters Five Forces
- 4.1.1. Bargaining Power of Suppliers
- 4.1.2. Bargaining Power of Buyers
- 4.1.3. Threat of New Entrants
- 4.1.4. Threat of Substitutes
- 4.1.5. Competitive Rivalry
- 4.2. PESTEL analysis
- 4.3. BCG Analysis
- 4.3.1. Stars (High Growth, High Market Share)
- 4.3.2. Cash Cows (Low Growth, High Market Share)
- 4.3.3. Question Mark (High Growth, Low Market Share)
- 4.3.4. Dogs (Low Growth, Low Market Share)
- 4.4. Ansoff Matrix Analysis
- 4.5. Supply Chain Analysis
- 4.6. Regulatory Landscape
- 4.7. Current Market Potential and Opportunity Assessment (TAM–SAM–SOM Framework)
- 4.8. PRI Analyst Note
- 4.1. Porters Five Forces
- 5. Market Analysis, Insights and Forecast 2021-2033
- 5.1. Market Analysis, Insights and Forecast - by Application
- 5.1.1. Geospatial Data Acquisition and Mapping
- 5.1.2. Natural Resource Management
- 5.1.3. Surveillance and Security
- 5.1.4. Conservation and Research
- 5.1.5. Disaster Management
- 5.1.6. Intelligence
- 5.2. Market Analysis, Insights and Forecast - by End-User
- 5.2.1. Government
- 5.2.2. Construction
- 5.2.3. Transportation and Logistics
- 5.2.4. Military and Defense
- 5.2.5. Forestry and Agriculture
- 5.2.6. Other End-Users
- 5.3. Market Analysis, Insights and Forecast - by Region
- 5.3.1. North America
- 5.3.2. South America
- 5.3.3. Europe
- 5.3.4. Middle East & Africa
- 5.3.5. Asia Pacific
- 5.1. Market Analysis, Insights and Forecast - by Application
- 6. Global ANZ Satellite Imagery Services Market Analysis, Insights and Forecast, 2021-2033
- 6.1. Market Analysis, Insights and Forecast - by Application
- 6.1.1. Geospatial Data Acquisition and Mapping
- 6.1.2. Natural Resource Management
- 6.1.3. Surveillance and Security
- 6.1.4. Conservation and Research
- 6.1.5. Disaster Management
- 6.1.6. Intelligence
- 6.2. Market Analysis, Insights and Forecast - by End-User
- 6.2.1. Government
- 6.2.2. Construction
- 6.2.3. Transportation and Logistics
- 6.2.4. Military and Defense
- 6.2.5. Forestry and Agriculture
- 6.2.6. Other End-Users
- 6.1. Market Analysis, Insights and Forecast - by Application
- 7. North America ANZ Satellite Imagery Services Market Analysis, Insights and Forecast, 2020-2032
- 7.1. Market Analysis, Insights and Forecast - by Application
- 7.1.1. Geospatial Data Acquisition and Mapping
- 7.1.2. Natural Resource Management
- 7.1.3. Surveillance and Security
- 7.1.4. Conservation and Research
- 7.1.5. Disaster Management
- 7.1.6. Intelligence
- 7.2. Market Analysis, Insights and Forecast - by End-User
- 7.2.1. Government
- 7.2.2. Construction
- 7.2.3. Transportation and Logistics
- 7.2.4. Military and Defense
- 7.2.5. Forestry and Agriculture
- 7.2.6. Other End-Users
- 7.1. Market Analysis, Insights and Forecast - by Application
- 8. South America ANZ Satellite Imagery Services Market Analysis, Insights and Forecast, 2020-2032
- 8.1. Market Analysis, Insights and Forecast - by Application
- 8.1.1. Geospatial Data Acquisition and Mapping
- 8.1.2. Natural Resource Management
- 8.1.3. Surveillance and Security
- 8.1.4. Conservation and Research
- 8.1.5. Disaster Management
- 8.1.6. Intelligence
- 8.2. Market Analysis, Insights and Forecast - by End-User
- 8.2.1. Government
- 8.2.2. Construction
- 8.2.3. Transportation and Logistics
- 8.2.4. Military and Defense
- 8.2.5. Forestry and Agriculture
- 8.2.6. Other End-Users
- 8.1. Market Analysis, Insights and Forecast - by Application
- 9. Europe ANZ Satellite Imagery Services Market Analysis, Insights and Forecast, 2020-2032
- 9.1. Market Analysis, Insights and Forecast - by Application
- 9.1.1. Geospatial Data Acquisition and Mapping
- 9.1.2. Natural Resource Management
- 9.1.3. Surveillance and Security
- 9.1.4. Conservation and Research
- 9.1.5. Disaster Management
- 9.1.6. Intelligence
- 9.2. Market Analysis, Insights and Forecast - by End-User
- 9.2.1. Government
- 9.2.2. Construction
- 9.2.3. Transportation and Logistics
- 9.2.4. Military and Defense
- 9.2.5. Forestry and Agriculture
- 9.2.6. Other End-Users
- 9.1. Market Analysis, Insights and Forecast - by Application
- 10. Middle East & Africa ANZ Satellite Imagery Services Market Analysis, Insights and Forecast, 2020-2032
- 10.1. Market Analysis, Insights and Forecast - by Application
- 10.1.1. Geospatial Data Acquisition and Mapping
- 10.1.2. Natural Resource Management
- 10.1.3. Surveillance and Security
- 10.1.4. Conservation and Research
- 10.1.5. Disaster Management
- 10.1.6. Intelligence
- 10.2. Market Analysis, Insights and Forecast - by End-User
- 10.2.1. Government
- 10.2.2. Construction
- 10.2.3. Transportation and Logistics
- 10.2.4. Military and Defense
- 10.2.5. Forestry and Agriculture
- 10.2.6. Other End-Users
- 10.1. Market Analysis, Insights and Forecast - by Application
- 11. Asia Pacific ANZ Satellite Imagery Services Market Analysis, Insights and Forecast, 2020-2032
- 11.1. Market Analysis, Insights and Forecast - by Application
- 11.1.1. Geospatial Data Acquisition and Mapping
- 11.1.2. Natural Resource Management
- 11.1.3. Surveillance and Security
- 11.1.4. Conservation and Research
- 11.1.5. Disaster Management
- 11.1.6. Intelligence
- 11.2. Market Analysis, Insights and Forecast - by End-User
- 11.2.1. Government
- 11.2.2. Construction
- 11.2.3. Transportation and Logistics
- 11.2.4. Military and Defense
- 11.2.5. Forestry and Agriculture
- 11.2.6. Other End-Users
- 11.1. Market Analysis, Insights and Forecast - by Application
- 12. Competitive Analysis
- 12.1. Company Profiles
- 12.1.1 L3Harris Technologies Inc
- 12.1.1.1. Company Overview
- 12.1.1.2. Products
- 12.1.1.3. Company Financials
- 12.1.1.4. SWOT Analysis
- 12.1.2 Aerometrex Limited
- 12.1.2.1. Company Overview
- 12.1.2.2. Products
- 12.1.2.3. Company Financials
- 12.1.2.4. SWOT Analysis
- 12.1.3 Airbus SE
- 12.1.3.1. Company Overview
- 12.1.3.2. Products
- 12.1.3.3. Company Financials
- 12.1.3.4. SWOT Analysis
- 12.1.4 Outline Global Pty Ltd
- 12.1.4.1. Company Overview
- 12.1.4.2. Products
- 12.1.4.3. Company Financials
- 12.1.4.4. SWOT Analysis
- 12.1.5 Nearmap Australia Pty Ltd
- 12.1.5.1. Company Overview
- 12.1.5.2. Products
- 12.1.5.3. Company Financials
- 12.1.5.4. SWOT Analysis
- 12.1.6 Arlula Pty Ltd
- 12.1.6.1. Company Overview
- 12.1.6.2. Products
- 12.1.6.3. Company Financials
- 12.1.6.4. SWOT Analysis
- 12.1.7 Geoimage Pty Ltd
- 12.1.7.1. Company Overview
- 12.1.7.2. Products
- 12.1.7.3. Company Financials
- 12.1.7.4. SWOT Analysis
- 12.1.8 Toitu Te Whenua Land Information New Zealand
- 12.1.8.1. Company Overview
- 12.1.8.2. Products
- 12.1.8.3. Company Financials
- 12.1.8.4. SWOT Analysis
- 12.1.9 Geospatial Intelligence Pty Ltd
- 12.1.9.1. Company Overview
- 12.1.9.2. Products
- 12.1.9.3. Company Financials
- 12.1.9.4. SWOT Analysis
- 12.1.10 Planet Labs PBC
- 12.1.10.1. Company Overview
- 12.1.10.2. Products
- 12.1.10.3. Company Financials
- 12.1.10.4. SWOT Analysis
- 12.1.11 Western Australian Land Information Authority (Landgate)
- 12.1.11.1. Company Overview
- 12.1.11.2. Products
- 12.1.11.3. Company Financials
- 12.1.11.4. SWOT Analysis
- 12.1.1 L3Harris Technologies Inc
- 12.2. Market Entropy
- 12.2.1 Company's Key Areas Served
- 12.2.2 Recent Developments
- 12.3. Company Market Share Analysis 2025
- 12.3.1 Top 5 Companies Market Share Analysis
- 12.3.2 Top 3 Companies Market Share Analysis
- 12.4. List of Potential Customers
- 13. Research Methodology
List of Figures
- Figure 1: Global ANZ Satellite Imagery Services Market Revenue Breakdown (Million, %) by Region 2025 & 2033
- Figure 2: Global ANZ Satellite Imagery Services Market Volume Breakdown (K Unit, %) by Region 2025 & 2033
- Figure 3: North America ANZ Satellite Imagery Services Market Revenue (Million), by Application 2025 & 2033
- Figure 4: North America ANZ Satellite Imagery Services Market Volume (K Unit), by Application 2025 & 2033
- Figure 5: North America ANZ Satellite Imagery Services Market Revenue Share (%), by Application 2025 & 2033
- Figure 6: North America ANZ Satellite Imagery Services Market Volume Share (%), by Application 2025 & 2033
- Figure 7: North America ANZ Satellite Imagery Services Market Revenue (Million), by End-User 2025 & 2033
- Figure 8: North America ANZ Satellite Imagery Services Market Volume (K Unit), by End-User 2025 & 2033
- Figure 9: North America ANZ Satellite Imagery Services Market Revenue Share (%), by End-User 2025 & 2033
- Figure 10: North America ANZ Satellite Imagery Services Market Volume Share (%), by End-User 2025 & 2033
- Figure 11: North America ANZ Satellite Imagery Services Market Revenue (Million), by Country 2025 & 2033
- Figure 12: North America ANZ Satellite Imagery Services Market Volume (K Unit), by Country 2025 & 2033
- Figure 13: North America ANZ Satellite Imagery Services Market Revenue Share (%), by Country 2025 & 2033
- Figure 14: North America ANZ Satellite Imagery Services Market Volume Share (%), by Country 2025 & 2033
- Figure 15: South America ANZ Satellite Imagery Services Market Revenue (Million), by Application 2025 & 2033
- Figure 16: South America ANZ Satellite Imagery Services Market Volume (K Unit), by Application 2025 & 2033
- Figure 17: South America ANZ Satellite Imagery Services Market Revenue Share (%), by Application 2025 & 2033
- Figure 18: South America ANZ Satellite Imagery Services Market Volume Share (%), by Application 2025 & 2033
- Figure 19: South America ANZ Satellite Imagery Services Market Revenue (Million), by End-User 2025 & 2033
- Figure 20: South America ANZ Satellite Imagery Services Market Volume (K Unit), by End-User 2025 & 2033
- Figure 21: South America ANZ Satellite Imagery Services Market Revenue Share (%), by End-User 2025 & 2033
- Figure 22: South America ANZ Satellite Imagery Services Market Volume Share (%), by End-User 2025 & 2033
- Figure 23: South America ANZ Satellite Imagery Services Market Revenue (Million), by Country 2025 & 2033
- Figure 24: South America ANZ Satellite Imagery Services Market Volume (K Unit), by Country 2025 & 2033
- Figure 25: South America ANZ Satellite Imagery Services Market Revenue Share (%), by Country 2025 & 2033
- Figure 26: South America ANZ Satellite Imagery Services Market Volume Share (%), by Country 2025 & 2033
- Figure 27: Europe ANZ Satellite Imagery Services Market Revenue (Million), by Application 2025 & 2033
- Figure 28: Europe ANZ Satellite Imagery Services Market Volume (K Unit), by Application 2025 & 2033
- Figure 29: Europe ANZ Satellite Imagery Services Market Revenue Share (%), by Application 2025 & 2033
- Figure 30: Europe ANZ Satellite Imagery Services Market Volume Share (%), by Application 2025 & 2033
- Figure 31: Europe ANZ Satellite Imagery Services Market Revenue (Million), by End-User 2025 & 2033
- Figure 32: Europe ANZ Satellite Imagery Services Market Volume (K Unit), by End-User 2025 & 2033
- Figure 33: Europe ANZ Satellite Imagery Services Market Revenue Share (%), by End-User 2025 & 2033
- Figure 34: Europe ANZ Satellite Imagery Services Market Volume Share (%), by End-User 2025 & 2033
- Figure 35: Europe ANZ Satellite Imagery Services Market Revenue (Million), by Country 2025 & 2033
- Figure 36: Europe ANZ Satellite Imagery Services Market Volume (K Unit), by Country 2025 & 2033
- Figure 37: Europe ANZ Satellite Imagery Services Market Revenue Share (%), by Country 2025 & 2033
- Figure 38: Europe ANZ Satellite Imagery Services Market Volume Share (%), by Country 2025 & 2033
- Figure 39: Middle East & Africa ANZ Satellite Imagery Services Market Revenue (Million), by Application 2025 & 2033
- Figure 40: Middle East & Africa ANZ Satellite Imagery Services Market Volume (K Unit), by Application 2025 & 2033
- Figure 41: Middle East & Africa ANZ Satellite Imagery Services Market Revenue Share (%), by Application 2025 & 2033
- Figure 42: Middle East & Africa ANZ Satellite Imagery Services Market Volume Share (%), by Application 2025 & 2033
- Figure 43: Middle East & Africa ANZ Satellite Imagery Services Market Revenue (Million), by End-User 2025 & 2033
- Figure 44: Middle East & Africa ANZ Satellite Imagery Services Market Volume (K Unit), by End-User 2025 & 2033
- Figure 45: Middle East & Africa ANZ Satellite Imagery Services Market Revenue Share (%), by End-User 2025 & 2033
- Figure 46: Middle East & Africa ANZ Satellite Imagery Services Market Volume Share (%), by End-User 2025 & 2033
- Figure 47: Middle East & Africa ANZ Satellite Imagery Services Market Revenue (Million), by Country 2025 & 2033
- Figure 48: Middle East & Africa ANZ Satellite Imagery Services Market Volume (K Unit), by Country 2025 & 2033
- Figure 49: Middle East & Africa ANZ Satellite Imagery Services Market Revenue Share (%), by Country 2025 & 2033
- Figure 50: Middle East & Africa ANZ Satellite Imagery Services Market Volume Share (%), by Country 2025 & 2033
- Figure 51: Asia Pacific ANZ Satellite Imagery Services Market Revenue (Million), by Application 2025 & 2033
- Figure 52: Asia Pacific ANZ Satellite Imagery Services Market Volume (K Unit), by Application 2025 & 2033
- Figure 53: Asia Pacific ANZ Satellite Imagery Services Market Revenue Share (%), by Application 2025 & 2033
- Figure 54: Asia Pacific ANZ Satellite Imagery Services Market Volume Share (%), by Application 2025 & 2033
- Figure 55: Asia Pacific ANZ Satellite Imagery Services Market Revenue (Million), by End-User 2025 & 2033
- Figure 56: Asia Pacific ANZ Satellite Imagery Services Market Volume (K Unit), by End-User 2025 & 2033
- Figure 57: Asia Pacific ANZ Satellite Imagery Services Market Revenue Share (%), by End-User 2025 & 2033
- Figure 58: Asia Pacific ANZ Satellite Imagery Services Market Volume Share (%), by End-User 2025 & 2033
- Figure 59: Asia Pacific ANZ Satellite Imagery Services Market Revenue (Million), by Country 2025 & 2033
- Figure 60: Asia Pacific ANZ Satellite Imagery Services Market Volume (K Unit), by Country 2025 & 2033
- Figure 61: Asia Pacific ANZ Satellite Imagery Services Market Revenue Share (%), by Country 2025 & 2033
- Figure 62: Asia Pacific ANZ Satellite Imagery Services Market Volume Share (%), by Country 2025 & 2033
List of Tables
- Table 1: Global ANZ Satellite Imagery Services Market Revenue Million Forecast, by Application 2020 & 2033
- Table 2: Global ANZ Satellite Imagery Services Market Volume K Unit Forecast, by Application 2020 & 2033
- Table 3: Global ANZ Satellite Imagery Services Market Revenue Million Forecast, by End-User 2020 & 2033
- Table 4: Global ANZ Satellite Imagery Services Market Volume K Unit Forecast, by End-User 2020 & 2033
- Table 5: Global ANZ Satellite Imagery Services Market Revenue Million Forecast, by Region 2020 & 2033
- Table 6: Global ANZ Satellite Imagery Services Market Volume K Unit Forecast, by Region 2020 & 2033
- Table 7: Global ANZ Satellite Imagery Services Market Revenue Million Forecast, by Application 2020 & 2033
- Table 8: Global ANZ Satellite Imagery Services Market Volume K Unit Forecast, by Application 2020 & 2033
- Table 9: Global ANZ Satellite Imagery Services Market Revenue Million Forecast, by End-User 2020 & 2033
- Table 10: Global ANZ Satellite Imagery Services Market Volume K Unit Forecast, by End-User 2020 & 2033
- Table 11: Global ANZ Satellite Imagery Services Market Revenue Million Forecast, by Country 2020 & 2033
- Table 12: Global ANZ Satellite Imagery Services Market Volume K Unit Forecast, by Country 2020 & 2033
- Table 13: United States ANZ Satellite Imagery Services Market Revenue (Million) Forecast, by Application 2020 & 2033
- Table 14: United States ANZ Satellite Imagery Services Market Volume (K Unit) Forecast, by Application 2020 & 2033
- Table 15: Canada ANZ Satellite Imagery Services Market Revenue (Million) Forecast, by Application 2020 & 2033
- Table 16: Canada ANZ Satellite Imagery Services Market Volume (K Unit) Forecast, by Application 2020 & 2033
- Table 17: Mexico ANZ Satellite Imagery Services Market Revenue (Million) Forecast, by Application 2020 & 2033
- Table 18: Mexico ANZ Satellite Imagery Services Market Volume (K Unit) Forecast, by Application 2020 & 2033
- Table 19: Global ANZ Satellite Imagery Services Market Revenue Million Forecast, by Application 2020 & 2033
- Table 20: Global ANZ Satellite Imagery Services Market Volume K Unit Forecast, by Application 2020 & 2033
- Table 21: Global ANZ Satellite Imagery Services Market Revenue Million Forecast, by End-User 2020 & 2033
- Table 22: Global ANZ Satellite Imagery Services Market Volume K Unit Forecast, by End-User 2020 & 2033
- Table 23: Global ANZ Satellite Imagery Services Market Revenue Million Forecast, by Country 2020 & 2033
- Table 24: Global ANZ Satellite Imagery Services Market Volume K Unit Forecast, by Country 2020 & 2033
- Table 25: Brazil ANZ Satellite Imagery Services Market Revenue (Million) Forecast, by Application 2020 & 2033
- Table 26: Brazil ANZ Satellite Imagery Services Market Volume (K Unit) Forecast, by Application 2020 & 2033
- Table 27: Argentina ANZ Satellite Imagery Services Market Revenue (Million) Forecast, by Application 2020 & 2033
- Table 28: Argentina ANZ Satellite Imagery Services Market Volume (K Unit) Forecast, by Application 2020 & 2033
- Table 29: Rest of South America ANZ Satellite Imagery Services Market Revenue (Million) Forecast, by Application 2020 & 2033
- Table 30: Rest of South America ANZ Satellite Imagery Services Market Volume (K Unit) Forecast, by Application 2020 & 2033
- Table 31: Global ANZ Satellite Imagery Services Market Revenue Million Forecast, by Application 2020 & 2033
- Table 32: Global ANZ Satellite Imagery Services Market Volume K Unit Forecast, by Application 2020 & 2033
- Table 33: Global ANZ Satellite Imagery Services Market Revenue Million Forecast, by End-User 2020 & 2033
- Table 34: Global ANZ Satellite Imagery Services Market Volume K Unit Forecast, by End-User 2020 & 2033
- Table 35: Global ANZ Satellite Imagery Services Market Revenue Million Forecast, by Country 2020 & 2033
- Table 36: Global ANZ Satellite Imagery Services Market Volume K Unit Forecast, by Country 2020 & 2033
- Table 37: United Kingdom ANZ Satellite Imagery Services Market Revenue (Million) Forecast, by Application 2020 & 2033
- Table 38: United Kingdom ANZ Satellite Imagery Services Market Volume (K Unit) Forecast, by Application 2020 & 2033
- Table 39: Germany ANZ Satellite Imagery Services Market Revenue (Million) Forecast, by Application 2020 & 2033
- Table 40: Germany ANZ Satellite Imagery Services Market Volume (K Unit) Forecast, by Application 2020 & 2033
- Table 41: France ANZ Satellite Imagery Services Market Revenue (Million) Forecast, by Application 2020 & 2033
- Table 42: France ANZ Satellite Imagery Services Market Volume (K Unit) Forecast, by Application 2020 & 2033
- Table 43: Italy ANZ Satellite Imagery Services Market Revenue (Million) Forecast, by Application 2020 & 2033
- Table 44: Italy ANZ Satellite Imagery Services Market Volume (K Unit) Forecast, by Application 2020 & 2033
- Table 45: Spain ANZ Satellite Imagery Services Market Revenue (Million) Forecast, by Application 2020 & 2033
- Table 46: Spain ANZ Satellite Imagery Services Market Volume (K Unit) Forecast, by Application 2020 & 2033
- Table 47: Russia ANZ Satellite Imagery Services Market Revenue (Million) Forecast, by Application 2020 & 2033
- Table 48: Russia ANZ Satellite Imagery Services Market Volume (K Unit) Forecast, by Application 2020 & 2033
- Table 49: Benelux ANZ Satellite Imagery Services Market Revenue (Million) Forecast, by Application 2020 & 2033
- Table 50: Benelux ANZ Satellite Imagery Services Market Volume (K Unit) Forecast, by Application 2020 & 2033
- Table 51: Nordics ANZ Satellite Imagery Services Market Revenue (Million) Forecast, by Application 2020 & 2033
- Table 52: Nordics ANZ Satellite Imagery Services Market Volume (K Unit) Forecast, by Application 2020 & 2033
- Table 53: Rest of Europe ANZ Satellite Imagery Services Market Revenue (Million) Forecast, by Application 2020 & 2033
- Table 54: Rest of Europe ANZ Satellite Imagery Services Market Volume (K Unit) Forecast, by Application 2020 & 2033
- Table 55: Global ANZ Satellite Imagery Services Market Revenue Million Forecast, by Application 2020 & 2033
- Table 56: Global ANZ Satellite Imagery Services Market Volume K Unit Forecast, by Application 2020 & 2033
- Table 57: Global ANZ Satellite Imagery Services Market Revenue Million Forecast, by End-User 2020 & 2033
- Table 58: Global ANZ Satellite Imagery Services Market Volume K Unit Forecast, by End-User 2020 & 2033
- Table 59: Global ANZ Satellite Imagery Services Market Revenue Million Forecast, by Country 2020 & 2033
- Table 60: Global ANZ Satellite Imagery Services Market Volume K Unit Forecast, by Country 2020 & 2033
- Table 61: Turkey ANZ Satellite Imagery Services Market Revenue (Million) Forecast, by Application 2020 & 2033
- Table 62: Turkey ANZ Satellite Imagery Services Market Volume (K Unit) Forecast, by Application 2020 & 2033
- Table 63: Israel ANZ Satellite Imagery Services Market Revenue (Million) Forecast, by Application 2020 & 2033
- Table 64: Israel ANZ Satellite Imagery Services Market Volume (K Unit) Forecast, by Application 2020 & 2033
- Table 65: GCC ANZ Satellite Imagery Services Market Revenue (Million) Forecast, by Application 2020 & 2033
- Table 66: GCC ANZ Satellite Imagery Services Market Volume (K Unit) Forecast, by Application 2020 & 2033
- Table 67: North Africa ANZ Satellite Imagery Services Market Revenue (Million) Forecast, by Application 2020 & 2033
- Table 68: North Africa ANZ Satellite Imagery Services Market Volume (K Unit) Forecast, by Application 2020 & 2033
- Table 69: South Africa ANZ Satellite Imagery Services Market Revenue (Million) Forecast, by Application 2020 & 2033
- Table 70: South Africa ANZ Satellite Imagery Services Market Volume (K Unit) Forecast, by Application 2020 & 2033
- Table 71: Rest of Middle East & Africa ANZ Satellite Imagery Services Market Revenue (Million) Forecast, by Application 2020 & 2033
- Table 72: Rest of Middle East & Africa ANZ Satellite Imagery Services Market Volume (K Unit) Forecast, by Application 2020 & 2033
- Table 73: Global ANZ Satellite Imagery Services Market Revenue Million Forecast, by Application 2020 & 2033
- Table 74: Global ANZ Satellite Imagery Services Market Volume K Unit Forecast, by Application 2020 & 2033
- Table 75: Global ANZ Satellite Imagery Services Market Revenue Million Forecast, by End-User 2020 & 2033
- Table 76: Global ANZ Satellite Imagery Services Market Volume K Unit Forecast, by End-User 2020 & 2033
- Table 77: Global ANZ Satellite Imagery Services Market Revenue Million Forecast, by Country 2020 & 2033
- Table 78: Global ANZ Satellite Imagery Services Market Volume K Unit Forecast, by Country 2020 & 2033
- Table 79: China ANZ Satellite Imagery Services Market Revenue (Million) Forecast, by Application 2020 & 2033
- Table 80: China ANZ Satellite Imagery Services Market Volume (K Unit) Forecast, by Application 2020 & 2033
- Table 81: India ANZ Satellite Imagery Services Market Revenue (Million) Forecast, by Application 2020 & 2033
- Table 82: India ANZ Satellite Imagery Services Market Volume (K Unit) Forecast, by Application 2020 & 2033
- Table 83: Japan ANZ Satellite Imagery Services Market Revenue (Million) Forecast, by Application 2020 & 2033
- Table 84: Japan ANZ Satellite Imagery Services Market Volume (K Unit) Forecast, by Application 2020 & 2033
- Table 85: South Korea ANZ Satellite Imagery Services Market Revenue (Million) Forecast, by Application 2020 & 2033
- Table 86: South Korea ANZ Satellite Imagery Services Market Volume (K Unit) Forecast, by Application 2020 & 2033
- Table 87: ASEAN ANZ Satellite Imagery Services Market Revenue (Million) Forecast, by Application 2020 & 2033
- Table 88: ASEAN ANZ Satellite Imagery Services Market Volume (K Unit) Forecast, by Application 2020 & 2033
- Table 89: Oceania ANZ Satellite Imagery Services Market Revenue (Million) Forecast, by Application 2020 & 2033
- Table 90: Oceania ANZ Satellite Imagery Services Market Volume (K Unit) Forecast, by Application 2020 & 2033
- Table 91: Rest of Asia Pacific ANZ Satellite Imagery Services Market Revenue (Million) Forecast, by Application 2020 & 2033
- Table 92: Rest of Asia Pacific ANZ Satellite Imagery Services Market Volume (K Unit) Forecast, by Application 2020 & 2033
Frequently Asked Questions
1. What is the projected Compound Annual Growth Rate (CAGR) of the ANZ Satellite Imagery Services Market?
The projected CAGR is approximately 11.61%.
2. Which companies are prominent players in the ANZ Satellite Imagery Services Market?
Key companies in the market include L3Harris Technologies Inc, Aerometrex Limited, Airbus SE, Outline Global Pty Ltd , Nearmap Australia Pty Ltd, Arlula Pty Ltd, Geoimage Pty Ltd, Toitu Te Whenua Land Information New Zealand, Geospatial Intelligence Pty Ltd, Planet Labs PBC, Western Australian Land Information Authority (Landgate).
3. What are the main segments of the ANZ Satellite Imagery Services Market?
The market segments include Application, End-User.
4. Can you provide details about the market size?
The market size is estimated to be USD 0.13 Million as of 2022.
5. What are some drivers contributing to market growth?
Government Initiatives and Investments to Support the Market Growth; Advancements in satellite technology. including High-resolution imagery. multispectral data. SAR. etc..
6. What are the notable trends driving market growth?
Government Initiatives and Investments to Support the Market Growth.
7. Are there any restraints impacting market growth?
Affordability and Accessibility might restrain the Market Growth; Competition from Alternative Technologies such as Aerial Drones. LiDAR. and UAVs.
8. Can you provide examples of recent developments in the market?
May 2023: Arlula announced the successful completion of its AUD 2.2 million (USD 1.5 million) initial investment round. This significant investment will enable the firm to increase access to Earth Observation (EO) data and imagery, helping people, small companies, and big corporations entirely use space-based data. This significant support demonstrates an interest in and acceptance of Arlula's aim to transform access to EO data and change businesses utilizing this priceless resource.
9. What pricing options are available for accessing the report?
Pricing options include single-user, multi-user, and enterprise licenses priced at USD 3800, USD 4500, and USD 5800 respectively.
10. Is the market size provided in terms of value or volume?
The market size is provided in terms of value, measured in Million and volume, measured in K Unit.
11. Are there any specific market keywords associated with the report?
Yes, the market keyword associated with the report is "ANZ Satellite Imagery Services Market," which aids in identifying and referencing the specific market segment covered.
12. How do I determine which pricing option suits my needs best?
The pricing options vary based on user requirements and access needs. Individual users may opt for single-user licenses, while businesses requiring broader access may choose multi-user or enterprise licenses for cost-effective access to the report.
13. Are there any additional resources or data provided in the ANZ Satellite Imagery Services Market report?
While the report offers comprehensive insights, it's advisable to review the specific contents or supplementary materials provided to ascertain if additional resources or data are available.
14. How can I stay updated on further developments or reports in the ANZ Satellite Imagery Services Market?
To stay informed about further developments, trends, and reports in the ANZ Satellite Imagery Services Market, consider subscribing to industry newsletters, following relevant companies and organizations, or regularly checking reputable industry news sources and publications.
Methodology
Step 1 - Identification of Relevant Samples Size from Population Database


Step 2 - Approaches for Defining Global Market Size (Value, Volume* & Price*)

Note*: In applicable scenarios
Step 3 - Data Sources
Primary Research
- Web Analytics
- Survey Reports
- Research Institute
- Latest Research Reports
- Opinion Leaders
Secondary Research
- Annual Reports
- White Paper
- Latest Press Release
- Industry Association
- Paid Database
- Investor Presentations

Step 4 - Data Triangulation
Involves using different sources of information in order to increase the validity of a study
These sources are likely to be stakeholders in a program - participants, other researchers, program staff, other community members, and so on.
Then we put all data in single framework & apply various statistical tools to find out the dynamic on the market.
During the analysis stage, feedback from the stakeholder groups would be compared to determine areas of agreement as well as areas of divergence