

Key Insights
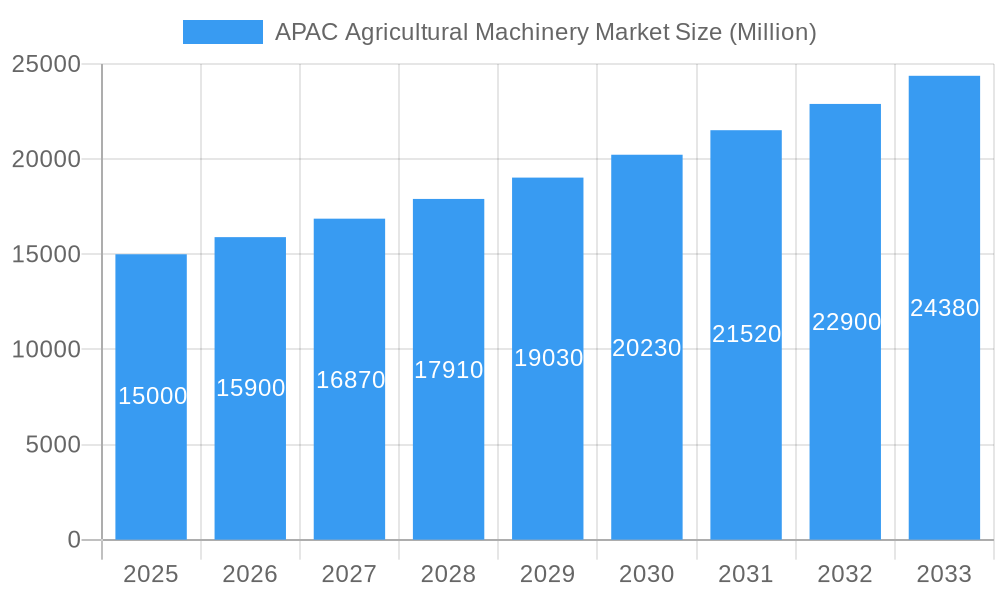
The Asia-Pacific (APAC) agricultural machinery market is poised for substantial growth, projected to reach 90.42 billion by 2033, expanding at a compound annual growth rate (CAGR) of 5.21% from the base year 2025. This expansion is driven by escalating demand for agricultural output to ensure food security for a growing population, coupled with supportive government initiatives promoting agricultural mechanization and the integration of advanced technologies like precision farming and automation. Key markets, particularly India and China, are leading this growth through significant investments in infrastructure and farming modernization. The market is segmented by machinery type, including tractors, planting and harvesting equipment, and irrigation systems. While tractors remain dominant, there is a rising demand for advanced harvesting and irrigation technologies, signaling a shift towards more efficient and technologically driven agricultural practices, further accelerated by the decreasing costs of precision farming technologies such as sensors and GPS. Challenges include fluctuating commodity prices, varied government policies, and the need for improved rural infrastructure.
APAC Agricultural Machinery Market Market Size (In Billion)
Despite these hurdles, the long-term outlook for the APAC agricultural machinery market is optimistic. A growing middle class with increasing disposable incomes is driving demand for higher-quality agricultural produce, necessitating efficient machinery. Continuous investment in agricultural research and development is fostering technological advancements that enhance productivity and efficiency. The adoption of sustainable and climate-smart agriculture practices is also anticipated to spur demand for specialized machinery. Key market players are focusing on product innovation, distribution network expansion, and strategic partnerships to gain market share, fostering further industry innovation.
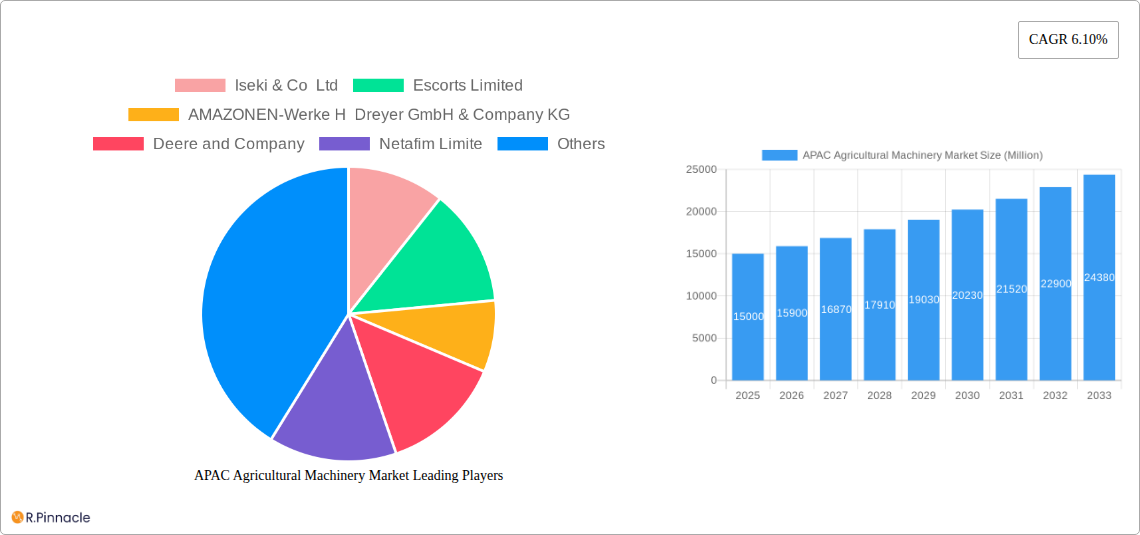
APAC Agricultural Machinery Market Company Market Share
APAC Agricultural Machinery Market Report: 2019-2033
This comprehensive report provides an in-depth analysis of the APAC Agricultural Machinery market, offering invaluable insights for industry professionals, investors, and strategic decision-makers. The study covers the period 2019-2033, with a focus on the forecast period 2025-2033 and a base year of 2025. The report utilizes rigorous research methodologies to deliver accurate market sizing, segment-specific growth projections, and detailed competitive landscape analysis. Discover key trends, challenges, and opportunities shaping this dynamic market.
APAC Agricultural Machinery Market Structure & Innovation Trends
This section analyzes the competitive landscape of the APAC Agricultural Machinery market, examining market concentration, innovation drivers, regulatory frameworks, and recent M&A activities. The market is characterized by a mix of established global players and regional manufacturers. Key players like Deere and Company, Kubota Corporation, Mahindra & Mahindra Ltd, and others, hold significant market share, though the exact figures vary across segments. However, the market is also witnessing increased participation from smaller, specialized firms, particularly in niche segments like precision agriculture technologies.
- Market Concentration: The market displays a moderately concentrated structure, with the top five players accounting for approximately xx% of the total market revenue in 2025. This figure is projected to xx% by 2033.
- Innovation Drivers: Growing demand for increased farm productivity, coupled with government initiatives promoting agricultural modernization, drives innovation. Precision farming technologies, automation, and data analytics are key focus areas.
- Regulatory Frameworks: Government regulations concerning emissions, safety, and sustainable farming practices impact technology adoption and market growth. Variations in these regulations across different APAC countries create a complex regulatory environment.
- Product Substitutes: While direct substitutes are limited, the increasing availability of alternative farming methods and labor-saving technologies influences market dynamics.
- End-User Demographics: The market is significantly influenced by the changing demographics of farmers in the APAC region, with a growing trend towards younger, tech-savvy farmers.
- M&A Activities: The past five years have seen a moderate level of M&A activity, with deal values averaging approximately xx Million annually. These activities primarily focus on expanding product portfolios and geographical reach.
APAC Agricultural Machinery Market Dynamics & Trends
The APAC Agricultural Machinery market is experiencing robust growth, driven by several key factors. Rising agricultural output, increasing disposable incomes, and government support for agricultural development are major contributors. Technological advancements, such as the adoption of precision farming techniques and autonomous machinery, further accelerate market expansion. The market is witnessing a shift towards technologically advanced equipment, with a growing preference for higher horsepower tractors and sophisticated harvesting machinery. The overall market is projected to exhibit a CAGR of xx% during the forecast period (2025-2033), with significant penetration of advanced technologies in key segments. Competitive dynamics are characterized by intense competition among established players and the emergence of new entrants. This competitive landscape fuels innovation and enhances market efficiency. The market penetration of precision farming technologies is expected to reach xx% by 2033, reflecting the increasing adoption of technology-driven solutions.
Dominant Regions & Segments in APAC Agricultural Machinery Market
Within APAC, India and China dominate the agricultural machinery market due to their large agricultural sectors and supportive government policies. These countries represent a significant proportion of the overall market size and are projected to continue their strong growth trajectory.
Leading Segments:
- Product Type: Tractors – This segment holds the largest market share, driven by the high demand for efficient land cultivation.
- By Horsepower: Above 50 HP – This segment shows the fastest growth, reflecting the rising preference for high-capacity machinery.
- By Type: Row Crop Tractor – This type of tractor maintains a high demand due to the prevalence of row-crop farming in several APAC countries.
Key Drivers:
- Government Initiatives: Numerous government programs promoting agricultural modernization and mechanization drive market growth in several APAC nations.
- Infrastructure Development: Improvements in rural infrastructure facilitate better access to agricultural machinery and enhance its utilization.
- Rising Farm Sizes: Consolidation of farms leads to a greater need for high-capacity machinery.
APAC Agricultural Machinery Market Product Innovations
The APAC agricultural machinery market showcases continuous product development, focusing on enhancing efficiency, precision, and sustainability. Recent innovations include automated guided systems, GPS-enabled machinery, and smart sensors for real-time data analysis. These advancements improve operational efficiency, reduce input costs, and optimize resource utilization, aligning with the growing demand for sustainable agricultural practices. The market's competitive landscape encourages the rapid adoption of these technologies, offering significant competitive advantages to early adopters.
Report Scope & Segmentation Analysis
This report segments the APAC agricultural machinery market comprehensively, encompassing various product types (tractors, plowing & cultivating machinery, planting machinery, harvesting machinery, haying machinery, irrigation machinery), horsepower categories (below 20 HP, 21-30 HP, 31-50 HP, above 50 HP), and tractor types (utility, row crop, compact utility, and other types). Each segment's market size, growth projections, and competitive dynamics are detailed within the report, providing a granular understanding of market opportunities. For example, the tractor segment is expected to grow at a CAGR of xx%, while the irrigation machinery segment is projected to expand at xx%.
Key Drivers of APAC Agricultural Machinery Market Growth
Several factors contribute to the APAC agricultural machinery market's growth. These include:
- Technological advancements: Precision farming technologies like GPS-guided tractors and automated harvesting systems significantly boost efficiency.
- Economic growth: Rising disposable incomes increase farmer investment capacity in modern machinery.
- Government support: Policies promoting agricultural mechanization through subsidies and incentives stimulate market growth. For example, India's various agricultural schemes play a major role.
Challenges in the APAC Agricultural Machinery Market Sector
The APAC agricultural machinery market faces several challenges:
- High initial investment costs: The cost of modern machinery presents a barrier for smaller farmers.
- Infrastructure limitations: Poor infrastructure in some regions hinders the efficient distribution and utilization of machinery.
- Skill gaps: A shortage of skilled labor to operate and maintain advanced machinery poses a challenge. This results in underutilization and requires training programs.
Emerging Opportunities in APAC Agricultural Machinery Market
Significant opportunities exist within the APAC agricultural machinery market:
- Precision agriculture technologies: The adoption of advanced technologies presents substantial opportunities for growth.
- Smart farming solutions: Data-driven insights and connected machinery provide opportunities for improved farm management.
- Sustainable farming practices: Eco-friendly equipment and practices cater to growing environmental concerns.
Leading Players in the APAC Agricultural Machinery Market Market
- Iseki & Co Ltd
- Escorts Limited
- AMAZONEN-Werke H Dreyer GmbH & Company KG
- Deere and Company
- Netafim Limite
- CNH Industrial NV
- Kubota Corporation
- Mahindra & Mahindra Ltd
- International tractors limited
- AGCO Corp
- YANMAR Co Ltd
- Yanmar Company Limited
Key Developments in APAC Agricultural Machinery Market Industry
- 2022 Q4: Deere & Company launched a new series of smart tractors with advanced automation features.
- 2023 Q1: Mahindra & Mahindra acquired a stake in a precision agriculture technology startup.
- 2023 Q2: Kubota Corporation invested in research and development for sustainable farming equipment. (Further details on specific developments with dates and impacts on market dynamics would be included in the full report.)
Future Outlook for APAC Agricultural Machinery Market Market
The APAC agricultural machinery market holds immense potential for future growth, driven by the increasing adoption of technology and supportive government policies. The market's expansion will continue to be shaped by factors like rising agricultural production, growing farmer incomes, and ongoing technological innovation. Strategic investments in research and development, focusing on sustainable and efficient solutions, will further strengthen the market's trajectory. The focus on precision agriculture and smart farming technologies is poised to create lucrative opportunities for market players in the coming years.
APAC Agricultural Machinery Market Segmentation
- 1. Production Analysis
- 2. Consumption Analysis
- 3. Import Market Analysis (Value & Volume)
- 4. Export Market Analysis (Value & Volume)
- 5. Price Trend Analysis
APAC Agricultural Machinery Market Segmentation By Geography
-
1. North America
- 1.1. United States
- 1.2. Canada
- 1.3. Mexico
-
2. South America
- 2.1. Brazil
- 2.2. Argentina
- 2.3. Rest of South America
-
3. Europe
- 3.1. United Kingdom
- 3.2. Germany
- 3.3. France
- 3.4. Italy
- 3.5. Spain
- 3.6. Russia
- 3.7. Benelux
- 3.8. Nordics
- 3.9. Rest of Europe
-
4. Middle East & Africa
- 4.1. Turkey
- 4.2. Israel
- 4.3. GCC
- 4.4. North Africa
- 4.5. South Africa
- 4.6. Rest of Middle East & Africa
-
5. Asia Pacific
- 5.1. China
- 5.2. India
- 5.3. Japan
- 5.4. South Korea
- 5.5. ASEAN
- 5.6. Oceania
- 5.7. Rest of Asia Pacific
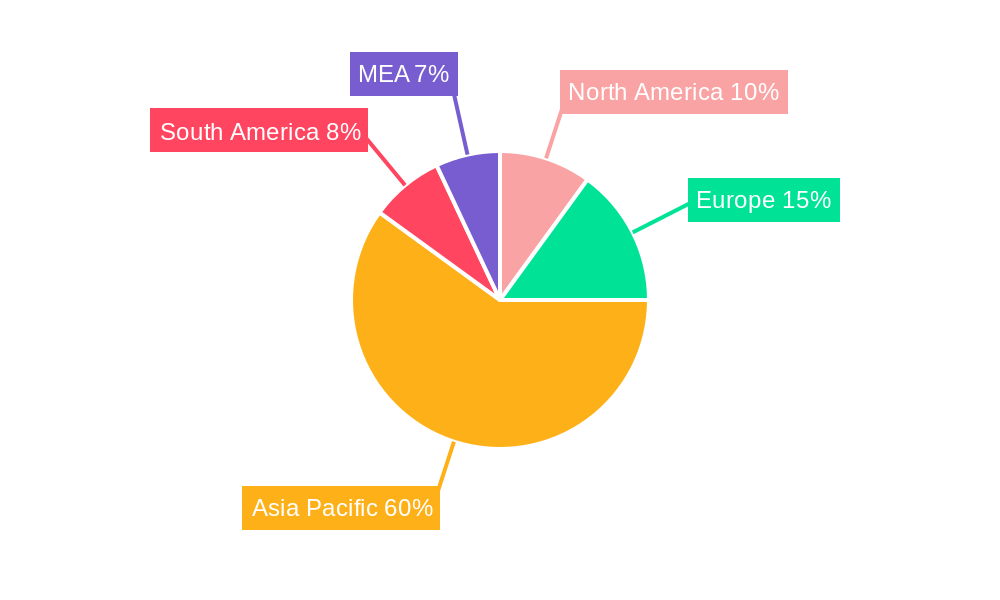
APAC Agricultural Machinery Market Regional Market Share
Geographic Coverage of APAC Agricultural Machinery Market
APAC Agricultural Machinery Market REPORT HIGHLIGHTS
| Aspects | Details |
|---|---|
| Study Period | 2020-2034 |
| Base Year | 2025 |
| Estimated Year | 2026 |
| Forecast Period | 2026-2034 |
| Historical Period | 2020-2025 |
| Growth Rate | CAGR of 5.21% from 2020-2034 |
| Segmentation |
|
Table of Contents
- 1. Introduction
- 1.1. Research Scope
- 1.2. Market Segmentation
- 1.3. Research Objective
- 1.4. Definitions and Assumptions
- 2. Executive Summary
- 2.1. Market Snapshot
- 3. Market Dynamics
- 3.1. Market Drivers
- 3.2. Market Restrains
- 3.3. Market Trends
- 3.4. Market Opportunities
- 4. Market Factor Analysis
- 4.1. Porters Five Forces
- 4.1.1. Bargaining Power of Suppliers
- 4.1.2. Bargaining Power of Buyers
- 4.1.3. Threat of New Entrants
- 4.1.4. Threat of Substitutes
- 4.1.5. Competitive Rivalry
- 4.2. PESTEL analysis
- 4.3. BCG Analysis
- 4.3.1. Stars (High Growth, High Market Share)
- 4.3.2. Cash Cows (Low Growth, High Market Share)
- 4.3.3. Question Mark (High Growth, Low Market Share)
- 4.3.4. Dogs (Low Growth, Low Market Share)
- 4.4. Ansoff Matrix Analysis
- 4.5. Supply Chain Analysis
- 4.6. Regulatory Landscape
- 4.7. Current Market Potential and Opportunity Assessment (TAM–SAM–SOM Framework)
- 4.8. PRI Analyst Note
- 4.1. Porters Five Forces
- 5. Market Analysis, Insights and Forecast 2021-2033
- 5.1. Market Analysis, Insights and Forecast - by Production Analysis
- 5.2. Market Analysis, Insights and Forecast - by Consumption Analysis
- 5.3. Market Analysis, Insights and Forecast - by Import Market Analysis (Value & Volume)
- 5.4. Market Analysis, Insights and Forecast - by Export Market Analysis (Value & Volume)
- 5.5. Market Analysis, Insights and Forecast - by Price Trend Analysis
- 5.6. Market Analysis, Insights and Forecast - by Region
- 5.6.1. North America
- 5.6.2. South America
- 5.6.3. Europe
- 5.6.4. Middle East & Africa
- 5.6.5. Asia Pacific
- 6. Global APAC Agricultural Machinery Market Analysis, Insights and Forecast, 2021-2033
- 6.1. Market Analysis, Insights and Forecast - by Production Analysis
- 6.2. Market Analysis, Insights and Forecast - by Consumption Analysis
- 6.3. Market Analysis, Insights and Forecast - by Import Market Analysis (Value & Volume)
- 6.4. Market Analysis, Insights and Forecast - by Export Market Analysis (Value & Volume)
- 6.5. Market Analysis, Insights and Forecast - by Price Trend Analysis
- 7. North America APAC Agricultural Machinery Market Analysis, Insights and Forecast, 2020-2032
- 7.1. Market Analysis, Insights and Forecast - by Production Analysis
- 7.2. Market Analysis, Insights and Forecast - by Consumption Analysis
- 7.3. Market Analysis, Insights and Forecast - by Import Market Analysis (Value & Volume)
- 7.4. Market Analysis, Insights and Forecast - by Export Market Analysis (Value & Volume)
- 7.5. Market Analysis, Insights and Forecast - by Price Trend Analysis
- 8. South America APAC Agricultural Machinery Market Analysis, Insights and Forecast, 2020-2032
- 8.1. Market Analysis, Insights and Forecast - by Production Analysis
- 8.2. Market Analysis, Insights and Forecast - by Consumption Analysis
- 8.3. Market Analysis, Insights and Forecast - by Import Market Analysis (Value & Volume)
- 8.4. Market Analysis, Insights and Forecast - by Export Market Analysis (Value & Volume)
- 8.5. Market Analysis, Insights and Forecast - by Price Trend Analysis
- 9. Europe APAC Agricultural Machinery Market Analysis, Insights and Forecast, 2020-2032
- 9.1. Market Analysis, Insights and Forecast - by Production Analysis
- 9.2. Market Analysis, Insights and Forecast - by Consumption Analysis
- 9.3. Market Analysis, Insights and Forecast - by Import Market Analysis (Value & Volume)
- 9.4. Market Analysis, Insights and Forecast - by Export Market Analysis (Value & Volume)
- 9.5. Market Analysis, Insights and Forecast - by Price Trend Analysis
- 10. Middle East & Africa APAC Agricultural Machinery Market Analysis, Insights and Forecast, 2020-2032
- 10.1. Market Analysis, Insights and Forecast - by Production Analysis
- 10.2. Market Analysis, Insights and Forecast - by Consumption Analysis
- 10.3. Market Analysis, Insights and Forecast - by Import Market Analysis (Value & Volume)
- 10.4. Market Analysis, Insights and Forecast - by Export Market Analysis (Value & Volume)
- 10.5. Market Analysis, Insights and Forecast - by Price Trend Analysis
- 11. Asia Pacific APAC Agricultural Machinery Market Analysis, Insights and Forecast, 2020-2032
- 11.1. Market Analysis, Insights and Forecast - by Production Analysis
- 11.2. Market Analysis, Insights and Forecast - by Consumption Analysis
- 11.3. Market Analysis, Insights and Forecast - by Import Market Analysis (Value & Volume)
- 11.4. Market Analysis, Insights and Forecast - by Export Market Analysis (Value & Volume)
- 11.5. Market Analysis, Insights and Forecast - by Price Trend Analysis
- 12. Competitive Analysis
- 12.1. Company Profiles
- 12.1.1 Iseki & Co Ltd
- 12.1.1.1. Company Overview
- 12.1.1.2. Products
- 12.1.1.3. Company Financials
- 12.1.1.4. SWOT Analysis
- 12.1.2 Escorts Limited
- 12.1.2.1. Company Overview
- 12.1.2.2. Products
- 12.1.2.3. Company Financials
- 12.1.2.4. SWOT Analysis
- 12.1.3 AMAZONEN-Werke H Dreyer GmbH & Company KG
- 12.1.3.1. Company Overview
- 12.1.3.2. Products
- 12.1.3.3. Company Financials
- 12.1.3.4. SWOT Analysis
- 12.1.4 Deere and Company
- 12.1.4.1. Company Overview
- 12.1.4.2. Products
- 12.1.4.3. Company Financials
- 12.1.4.4. SWOT Analysis
- 12.1.5 Netafim Limite
- 12.1.5.1. Company Overview
- 12.1.5.2. Products
- 12.1.5.3. Company Financials
- 12.1.5.4. SWOT Analysis
- 12.1.6 CNH Industrial NV
- 12.1.6.1. Company Overview
- 12.1.6.2. Products
- 12.1.6.3. Company Financials
- 12.1.6.4. SWOT Analysis
- 12.1.7 Kubota Corporation
- 12.1.7.1. Company Overview
- 12.1.7.2. Products
- 12.1.7.3. Company Financials
- 12.1.7.4. SWOT Analysis
- 12.1.8 Mahindra & Mahindra Ltd
- 12.1.8.1. Company Overview
- 12.1.8.2. Products
- 12.1.8.3. Company Financials
- 12.1.8.4. SWOT Analysis
- 12.1.9 International tractors limited
- 12.1.9.1. Company Overview
- 12.1.9.2. Products
- 12.1.9.3. Company Financials
- 12.1.9.4. SWOT Analysis
- 12.1.10 AGCO Corp
- 12.1.10.1. Company Overview
- 12.1.10.2. Products
- 12.1.10.3. Company Financials
- 12.1.10.4. SWOT Analysis
- 12.1.11 YANMAR Co Ltd
- 12.1.11.1. Company Overview
- 12.1.11.2. Products
- 12.1.11.3. Company Financials
- 12.1.11.4. SWOT Analysis
- 12.1.12 Yanmar Company Limited
- 12.1.12.1. Company Overview
- 12.1.12.2. Products
- 12.1.12.3. Company Financials
- 12.1.12.4. SWOT Analysis
- 12.1.1 Iseki & Co Ltd
- 12.2. Market Entropy
- 12.2.1 Company's Key Areas Served
- 12.2.2 Recent Developments
- 12.3. Company Market Share Analysis 2025
- 12.3.1 Top 5 Companies Market Share Analysis
- 12.3.2 Top 3 Companies Market Share Analysis
- 12.4. List of Potential Customers
- 13. Research Methodology
List of Figures
- Figure 1: Global APAC Agricultural Machinery Market Revenue Breakdown (billion, %) by Region 2025 & 2033
- Figure 2: North America APAC Agricultural Machinery Market Revenue (billion), by Production Analysis 2025 & 2033
- Figure 3: North America APAC Agricultural Machinery Market Revenue Share (%), by Production Analysis 2025 & 2033
- Figure 4: North America APAC Agricultural Machinery Market Revenue (billion), by Consumption Analysis 2025 & 2033
- Figure 5: North America APAC Agricultural Machinery Market Revenue Share (%), by Consumption Analysis 2025 & 2033
- Figure 6: North America APAC Agricultural Machinery Market Revenue (billion), by Import Market Analysis (Value & Volume) 2025 & 2033
- Figure 7: North America APAC Agricultural Machinery Market Revenue Share (%), by Import Market Analysis (Value & Volume) 2025 & 2033
- Figure 8: North America APAC Agricultural Machinery Market Revenue (billion), by Export Market Analysis (Value & Volume) 2025 & 2033
- Figure 9: North America APAC Agricultural Machinery Market Revenue Share (%), by Export Market Analysis (Value & Volume) 2025 & 2033
- Figure 10: North America APAC Agricultural Machinery Market Revenue (billion), by Price Trend Analysis 2025 & 2033
- Figure 11: North America APAC Agricultural Machinery Market Revenue Share (%), by Price Trend Analysis 2025 & 2033
- Figure 12: North America APAC Agricultural Machinery Market Revenue (billion), by Country 2025 & 2033
- Figure 13: North America APAC Agricultural Machinery Market Revenue Share (%), by Country 2025 & 2033
- Figure 14: South America APAC Agricultural Machinery Market Revenue (billion), by Production Analysis 2025 & 2033
- Figure 15: South America APAC Agricultural Machinery Market Revenue Share (%), by Production Analysis 2025 & 2033
- Figure 16: South America APAC Agricultural Machinery Market Revenue (billion), by Consumption Analysis 2025 & 2033
- Figure 17: South America APAC Agricultural Machinery Market Revenue Share (%), by Consumption Analysis 2025 & 2033
- Figure 18: South America APAC Agricultural Machinery Market Revenue (billion), by Import Market Analysis (Value & Volume) 2025 & 2033
- Figure 19: South America APAC Agricultural Machinery Market Revenue Share (%), by Import Market Analysis (Value & Volume) 2025 & 2033
- Figure 20: South America APAC Agricultural Machinery Market Revenue (billion), by Export Market Analysis (Value & Volume) 2025 & 2033
- Figure 21: South America APAC Agricultural Machinery Market Revenue Share (%), by Export Market Analysis (Value & Volume) 2025 & 2033
- Figure 22: South America APAC Agricultural Machinery Market Revenue (billion), by Price Trend Analysis 2025 & 2033
- Figure 23: South America APAC Agricultural Machinery Market Revenue Share (%), by Price Trend Analysis 2025 & 2033
- Figure 24: South America APAC Agricultural Machinery Market Revenue (billion), by Country 2025 & 2033
- Figure 25: South America APAC Agricultural Machinery Market Revenue Share (%), by Country 2025 & 2033
- Figure 26: Europe APAC Agricultural Machinery Market Revenue (billion), by Production Analysis 2025 & 2033
- Figure 27: Europe APAC Agricultural Machinery Market Revenue Share (%), by Production Analysis 2025 & 2033
- Figure 28: Europe APAC Agricultural Machinery Market Revenue (billion), by Consumption Analysis 2025 & 2033
- Figure 29: Europe APAC Agricultural Machinery Market Revenue Share (%), by Consumption Analysis 2025 & 2033
- Figure 30: Europe APAC Agricultural Machinery Market Revenue (billion), by Import Market Analysis (Value & Volume) 2025 & 2033
- Figure 31: Europe APAC Agricultural Machinery Market Revenue Share (%), by Import Market Analysis (Value & Volume) 2025 & 2033
- Figure 32: Europe APAC Agricultural Machinery Market Revenue (billion), by Export Market Analysis (Value & Volume) 2025 & 2033
- Figure 33: Europe APAC Agricultural Machinery Market Revenue Share (%), by Export Market Analysis (Value & Volume) 2025 & 2033
- Figure 34: Europe APAC Agricultural Machinery Market Revenue (billion), by Price Trend Analysis 2025 & 2033
- Figure 35: Europe APAC Agricultural Machinery Market Revenue Share (%), by Price Trend Analysis 2025 & 2033
- Figure 36: Europe APAC Agricultural Machinery Market Revenue (billion), by Country 2025 & 2033
- Figure 37: Europe APAC Agricultural Machinery Market Revenue Share (%), by Country 2025 & 2033
- Figure 38: Middle East & Africa APAC Agricultural Machinery Market Revenue (billion), by Production Analysis 2025 & 2033
- Figure 39: Middle East & Africa APAC Agricultural Machinery Market Revenue Share (%), by Production Analysis 2025 & 2033
- Figure 40: Middle East & Africa APAC Agricultural Machinery Market Revenue (billion), by Consumption Analysis 2025 & 2033
- Figure 41: Middle East & Africa APAC Agricultural Machinery Market Revenue Share (%), by Consumption Analysis 2025 & 2033
- Figure 42: Middle East & Africa APAC Agricultural Machinery Market Revenue (billion), by Import Market Analysis (Value & Volume) 2025 & 2033
- Figure 43: Middle East & Africa APAC Agricultural Machinery Market Revenue Share (%), by Import Market Analysis (Value & Volume) 2025 & 2033
- Figure 44: Middle East & Africa APAC Agricultural Machinery Market Revenue (billion), by Export Market Analysis (Value & Volume) 2025 & 2033
- Figure 45: Middle East & Africa APAC Agricultural Machinery Market Revenue Share (%), by Export Market Analysis (Value & Volume) 2025 & 2033
- Figure 46: Middle East & Africa APAC Agricultural Machinery Market Revenue (billion), by Price Trend Analysis 2025 & 2033
- Figure 47: Middle East & Africa APAC Agricultural Machinery Market Revenue Share (%), by Price Trend Analysis 2025 & 2033
- Figure 48: Middle East & Africa APAC Agricultural Machinery Market Revenue (billion), by Country 2025 & 2033
- Figure 49: Middle East & Africa APAC Agricultural Machinery Market Revenue Share (%), by Country 2025 & 2033
- Figure 50: Asia Pacific APAC Agricultural Machinery Market Revenue (billion), by Production Analysis 2025 & 2033
- Figure 51: Asia Pacific APAC Agricultural Machinery Market Revenue Share (%), by Production Analysis 2025 & 2033
- Figure 52: Asia Pacific APAC Agricultural Machinery Market Revenue (billion), by Consumption Analysis 2025 & 2033
- Figure 53: Asia Pacific APAC Agricultural Machinery Market Revenue Share (%), by Consumption Analysis 2025 & 2033
- Figure 54: Asia Pacific APAC Agricultural Machinery Market Revenue (billion), by Import Market Analysis (Value & Volume) 2025 & 2033
- Figure 55: Asia Pacific APAC Agricultural Machinery Market Revenue Share (%), by Import Market Analysis (Value & Volume) 2025 & 2033
- Figure 56: Asia Pacific APAC Agricultural Machinery Market Revenue (billion), by Export Market Analysis (Value & Volume) 2025 & 2033
- Figure 57: Asia Pacific APAC Agricultural Machinery Market Revenue Share (%), by Export Market Analysis (Value & Volume) 2025 & 2033
- Figure 58: Asia Pacific APAC Agricultural Machinery Market Revenue (billion), by Price Trend Analysis 2025 & 2033
- Figure 59: Asia Pacific APAC Agricultural Machinery Market Revenue Share (%), by Price Trend Analysis 2025 & 2033
- Figure 60: Asia Pacific APAC Agricultural Machinery Market Revenue (billion), by Country 2025 & 2033
- Figure 61: Asia Pacific APAC Agricultural Machinery Market Revenue Share (%), by Country 2025 & 2033
List of Tables
- Table 1: Global APAC Agricultural Machinery Market Revenue billion Forecast, by Production Analysis 2020 & 2033
- Table 2: Global APAC Agricultural Machinery Market Revenue billion Forecast, by Consumption Analysis 2020 & 2033
- Table 3: Global APAC Agricultural Machinery Market Revenue billion Forecast, by Import Market Analysis (Value & Volume) 2020 & 2033
- Table 4: Global APAC Agricultural Machinery Market Revenue billion Forecast, by Export Market Analysis (Value & Volume) 2020 & 2033
- Table 5: Global APAC Agricultural Machinery Market Revenue billion Forecast, by Price Trend Analysis 2020 & 2033
- Table 6: Global APAC Agricultural Machinery Market Revenue billion Forecast, by Region 2020 & 2033
- Table 7: Global APAC Agricultural Machinery Market Revenue billion Forecast, by Production Analysis 2020 & 2033
- Table 8: Global APAC Agricultural Machinery Market Revenue billion Forecast, by Consumption Analysis 2020 & 2033
- Table 9: Global APAC Agricultural Machinery Market Revenue billion Forecast, by Import Market Analysis (Value & Volume) 2020 & 2033
- Table 10: Global APAC Agricultural Machinery Market Revenue billion Forecast, by Export Market Analysis (Value & Volume) 2020 & 2033
- Table 11: Global APAC Agricultural Machinery Market Revenue billion Forecast, by Price Trend Analysis 2020 & 2033
- Table 12: Global APAC Agricultural Machinery Market Revenue billion Forecast, by Country 2020 & 2033
- Table 13: United States APAC Agricultural Machinery Market Revenue (billion) Forecast, by Application 2020 & 2033
- Table 14: Canada APAC Agricultural Machinery Market Revenue (billion) Forecast, by Application 2020 & 2033
- Table 15: Mexico APAC Agricultural Machinery Market Revenue (billion) Forecast, by Application 2020 & 2033
- Table 16: Global APAC Agricultural Machinery Market Revenue billion Forecast, by Production Analysis 2020 & 2033
- Table 17: Global APAC Agricultural Machinery Market Revenue billion Forecast, by Consumption Analysis 2020 & 2033
- Table 18: Global APAC Agricultural Machinery Market Revenue billion Forecast, by Import Market Analysis (Value & Volume) 2020 & 2033
- Table 19: Global APAC Agricultural Machinery Market Revenue billion Forecast, by Export Market Analysis (Value & Volume) 2020 & 2033
- Table 20: Global APAC Agricultural Machinery Market Revenue billion Forecast, by Price Trend Analysis 2020 & 2033
- Table 21: Global APAC Agricultural Machinery Market Revenue billion Forecast, by Country 2020 & 2033
- Table 22: Brazil APAC Agricultural Machinery Market Revenue (billion) Forecast, by Application 2020 & 2033
- Table 23: Argentina APAC Agricultural Machinery Market Revenue (billion) Forecast, by Application 2020 & 2033
- Table 24: Rest of South America APAC Agricultural Machinery Market Revenue (billion) Forecast, by Application 2020 & 2033
- Table 25: Global APAC Agricultural Machinery Market Revenue billion Forecast, by Production Analysis 2020 & 2033
- Table 26: Global APAC Agricultural Machinery Market Revenue billion Forecast, by Consumption Analysis 2020 & 2033
- Table 27: Global APAC Agricultural Machinery Market Revenue billion Forecast, by Import Market Analysis (Value & Volume) 2020 & 2033
- Table 28: Global APAC Agricultural Machinery Market Revenue billion Forecast, by Export Market Analysis (Value & Volume) 2020 & 2033
- Table 29: Global APAC Agricultural Machinery Market Revenue billion Forecast, by Price Trend Analysis 2020 & 2033
- Table 30: Global APAC Agricultural Machinery Market Revenue billion Forecast, by Country 2020 & 2033
- Table 31: United Kingdom APAC Agricultural Machinery Market Revenue (billion) Forecast, by Application 2020 & 2033
- Table 32: Germany APAC Agricultural Machinery Market Revenue (billion) Forecast, by Application 2020 & 2033
- Table 33: France APAC Agricultural Machinery Market Revenue (billion) Forecast, by Application 2020 & 2033
- Table 34: Italy APAC Agricultural Machinery Market Revenue (billion) Forecast, by Application 2020 & 2033
- Table 35: Spain APAC Agricultural Machinery Market Revenue (billion) Forecast, by Application 2020 & 2033
- Table 36: Russia APAC Agricultural Machinery Market Revenue (billion) Forecast, by Application 2020 & 2033
- Table 37: Benelux APAC Agricultural Machinery Market Revenue (billion) Forecast, by Application 2020 & 2033
- Table 38: Nordics APAC Agricultural Machinery Market Revenue (billion) Forecast, by Application 2020 & 2033
- Table 39: Rest of Europe APAC Agricultural Machinery Market Revenue (billion) Forecast, by Application 2020 & 2033
- Table 40: Global APAC Agricultural Machinery Market Revenue billion Forecast, by Production Analysis 2020 & 2033
- Table 41: Global APAC Agricultural Machinery Market Revenue billion Forecast, by Consumption Analysis 2020 & 2033
- Table 42: Global APAC Agricultural Machinery Market Revenue billion Forecast, by Import Market Analysis (Value & Volume) 2020 & 2033
- Table 43: Global APAC Agricultural Machinery Market Revenue billion Forecast, by Export Market Analysis (Value & Volume) 2020 & 2033
- Table 44: Global APAC Agricultural Machinery Market Revenue billion Forecast, by Price Trend Analysis 2020 & 2033
- Table 45: Global APAC Agricultural Machinery Market Revenue billion Forecast, by Country 2020 & 2033
- Table 46: Turkey APAC Agricultural Machinery Market Revenue (billion) Forecast, by Application 2020 & 2033
- Table 47: Israel APAC Agricultural Machinery Market Revenue (billion) Forecast, by Application 2020 & 2033
- Table 48: GCC APAC Agricultural Machinery Market Revenue (billion) Forecast, by Application 2020 & 2033
- Table 49: North Africa APAC Agricultural Machinery Market Revenue (billion) Forecast, by Application 2020 & 2033
- Table 50: South Africa APAC Agricultural Machinery Market Revenue (billion) Forecast, by Application 2020 & 2033
- Table 51: Rest of Middle East & Africa APAC Agricultural Machinery Market Revenue (billion) Forecast, by Application 2020 & 2033
- Table 52: Global APAC Agricultural Machinery Market Revenue billion Forecast, by Production Analysis 2020 & 2033
- Table 53: Global APAC Agricultural Machinery Market Revenue billion Forecast, by Consumption Analysis 2020 & 2033
- Table 54: Global APAC Agricultural Machinery Market Revenue billion Forecast, by Import Market Analysis (Value & Volume) 2020 & 2033
- Table 55: Global APAC Agricultural Machinery Market Revenue billion Forecast, by Export Market Analysis (Value & Volume) 2020 & 2033
- Table 56: Global APAC Agricultural Machinery Market Revenue billion Forecast, by Price Trend Analysis 2020 & 2033
- Table 57: Global APAC Agricultural Machinery Market Revenue billion Forecast, by Country 2020 & 2033
- Table 58: China APAC Agricultural Machinery Market Revenue (billion) Forecast, by Application 2020 & 2033
- Table 59: India APAC Agricultural Machinery Market Revenue (billion) Forecast, by Application 2020 & 2033
- Table 60: Japan APAC Agricultural Machinery Market Revenue (billion) Forecast, by Application 2020 & 2033
- Table 61: South Korea APAC Agricultural Machinery Market Revenue (billion) Forecast, by Application 2020 & 2033
- Table 62: ASEAN APAC Agricultural Machinery Market Revenue (billion) Forecast, by Application 2020 & 2033
- Table 63: Oceania APAC Agricultural Machinery Market Revenue (billion) Forecast, by Application 2020 & 2033
- Table 64: Rest of Asia Pacific APAC Agricultural Machinery Market Revenue (billion) Forecast, by Application 2020 & 2033
Frequently Asked Questions
1. What is the projected Compound Annual Growth Rate (CAGR) of the APAC Agricultural Machinery Market?
The projected CAGR is approximately 5.21%.
2. Which companies are prominent players in the APAC Agricultural Machinery Market?
Key companies in the market include Iseki & Co Ltd, Escorts Limited, AMAZONEN-Werke H Dreyer GmbH & Company KG, Deere and Company, Netafim Limite, CNH Industrial NV, Kubota Corporation, Mahindra & Mahindra Ltd, International tractors limited, AGCO Corp, YANMAR Co Ltd, Yanmar Company Limited.
3. What are the main segments of the APAC Agricultural Machinery Market?
The market segments include Production Analysis, Consumption Analysis, Import Market Analysis (Value & Volume), Export Market Analysis (Value & Volume), Price Trend Analysis.
4. Can you provide details about the market size?
The market size is estimated to be USD 90.42 billion as of 2022.
5. What are some drivers contributing to market growth?
Brazilian Farm Structure and Consolidation of Smaller Farms; Technological Advancements.
6. What are the notable trends driving market growth?
Lack of Farm Labor and Increase in Farm Wages.
7. Are there any restraints impacting market growth?
High Cost of Equipment and Price Sensitivity; Data Privacy Concerns.
8. Can you provide examples of recent developments in the market?
N/A
9. What pricing options are available for accessing the report?
Pricing options include single-user, multi-user, and enterprise licenses priced at USD 4750, USD 5250, and USD 8750 respectively.
10. Is the market size provided in terms of value or volume?
The market size is provided in terms of value, measured in billion.
11. Are there any specific market keywords associated with the report?
Yes, the market keyword associated with the report is "APAC Agricultural Machinery Market," which aids in identifying and referencing the specific market segment covered.
12. How do I determine which pricing option suits my needs best?
The pricing options vary based on user requirements and access needs. Individual users may opt for single-user licenses, while businesses requiring broader access may choose multi-user or enterprise licenses for cost-effective access to the report.
13. Are there any additional resources or data provided in the APAC Agricultural Machinery Market report?
While the report offers comprehensive insights, it's advisable to review the specific contents or supplementary materials provided to ascertain if additional resources or data are available.
14. How can I stay updated on further developments or reports in the APAC Agricultural Machinery Market?
To stay informed about further developments, trends, and reports in the APAC Agricultural Machinery Market, consider subscribing to industry newsletters, following relevant companies and organizations, or regularly checking reputable industry news sources and publications.
Methodology
Step 1 - Identification of Relevant Samples Size from Population Database


Step 2 - Approaches for Defining Global Market Size (Value, Volume* & Price*)

Note*: In applicable scenarios
Step 3 - Data Sources
Primary Research
- Web Analytics
- Survey Reports
- Research Institute
- Latest Research Reports
- Opinion Leaders
Secondary Research
- Annual Reports
- White Paper
- Latest Press Release
- Industry Association
- Paid Database
- Investor Presentations

Step 4 - Data Triangulation
Involves using different sources of information in order to increase the validity of a study
These sources are likely to be stakeholders in a program - participants, other researchers, program staff, other community members, and so on.
Then we put all data in single framework & apply various statistical tools to find out the dynamic on the market.
During the analysis stage, feedback from the stakeholder groups would be compared to determine areas of agreement as well as areas of divergence