

Key Insights
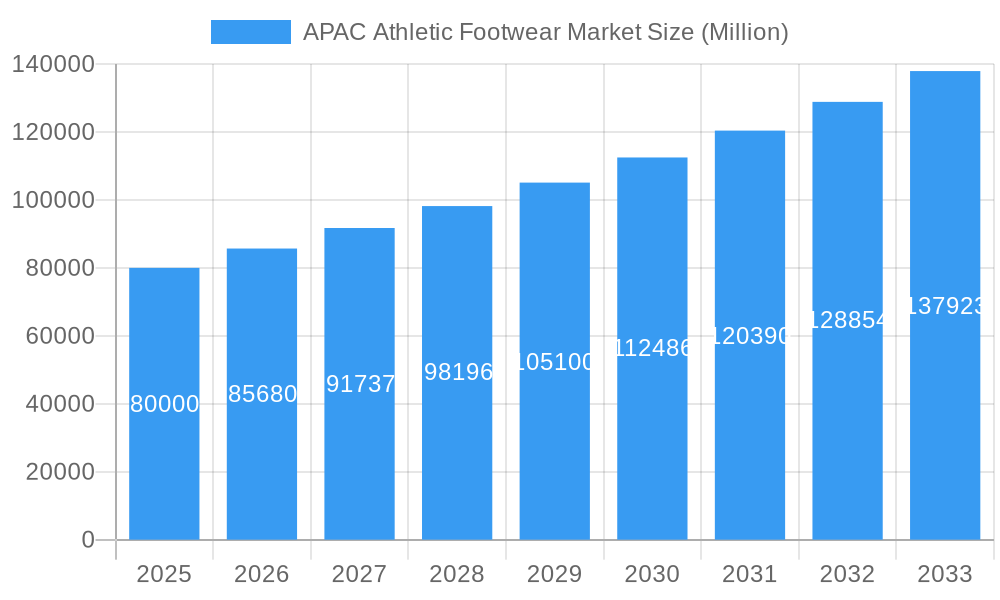
The Asia-Pacific (APAC) athletic footwear market, projected at $194 billion in 2025, is poised for substantial expansion. Expected to grow at a compound annual growth rate (CAGR) of 6.83% from 2025 to 2033, this growth is propelled by increasing disposable incomes in key economies like India and Indonesia. Enhanced health and fitness awareness, alongside a surge in sports participation, are key demand drivers. The proliferation of e-commerce simplifies product access, further stimulating market growth. Specific athletic shoe categories, including running and trekking footwear, are experiencing heightened demand due to the popularity of these activities.
APAC Athletic Footwear Market Market Size (In Billion)
The market is strategically segmented by distribution channels (sports stores, supermarkets, online), product type (running, sports, trekking), and end-user demographics (men, women, children). This segmentation presents diverse opportunities for industry participants. While global leaders such as Nike, Adidas, and Asics maintain considerable market share, emerging local brands are increasingly gaining prominence, fostering a competitive market environment.
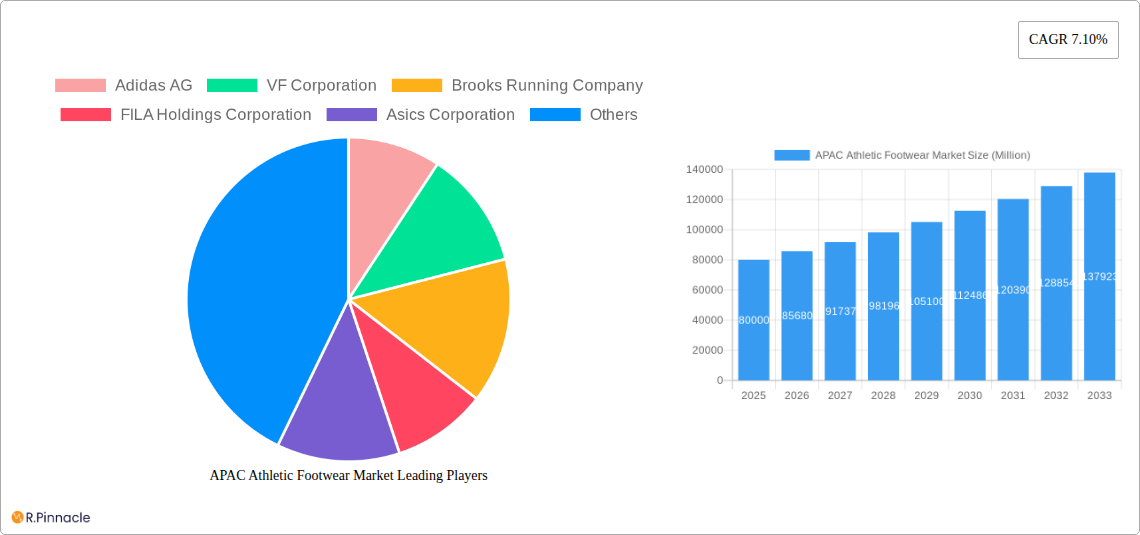
APAC Athletic Footwear Market Company Market Share
Challenges facing the market include raw material price volatility, particularly for synthetic components impacting manufacturing costs. Intense competition from established global brands and nascent local players also contributes to price pressures. Fluctuating exchange rates and regional economic instability can further affect market dynamics. Nevertheless, sustained trends toward healthier lifestyles and rising consumer purchasing power indicate continued growth for the APAC athletic footwear market. Brands that adeptly respond to evolving consumer demands and implement effective distribution strategies, especially online, are well-positioned for success. While major players are expected to retain their dominance, niche brands emphasizing sustainability and innovative product design are anticipated to capture growing market segments.
APAC Athletic Footwear Market Report: 2019-2033
This comprehensive report provides an in-depth analysis of the Asia-Pacific (APAC) athletic footwear market, offering valuable insights for industry professionals, investors, and strategists. Covering the period from 2019 to 2033, with a focus on 2025, this report meticulously examines market dynamics, key players, and future growth potential. The study period spans from 2019-2024 (historical), with 2025 as the base and estimated year, and a forecast period of 2025-2033. The market is segmented by distribution channel, product type, and end-user, providing granular data for informed decision-making. Expected market value is xx Million.
APAC Athletic Footwear Market Structure & Innovation Trends
This section analyzes the competitive landscape of the APAC athletic footwear market, focusing on market concentration, innovation drivers, regulatory frameworks, product substitutes, end-user demographics, and mergers & acquisitions (M&A) activities. The market is characterized by a combination of established global players and emerging local brands. Key players include Adidas AG, VF Corporation, Brooks Running Company, FILA Holdings Corporation, Asics Corporation, Puma SE, Under Armour Inc, Nike Inc, Li-Ning Company Limited, and New Balance Athletics Inc.
Market Concentration: The market exhibits a moderately concentrated structure, with a few dominant players holding significant market share. Nike and Adidas together hold an estimated xx% market share, while other major players account for the remaining xx%. The remaining percentage is shared amongst smaller players and regional brands.
Innovation Drivers: Technological advancements, such as the use of innovative materials (e.g., sustainable materials, responsive cushioning), personalized customization options, and smart shoe technology, are major drivers of innovation.
Regulatory Frameworks: Government regulations related to product safety, environmental protection, and fair trade practices influence market dynamics. These regulations are expected to become stricter in coming years in some markets, increasing manufacturing costs.
Product Substitutes: The market faces competition from alternative footwear options, including casual footwear and sandals. However, the growing popularity of fitness and sports activities counters this trend.
End-User Demographics: The APAC region exhibits a diverse demographic landscape, with significant growth in the young and middle-aged population, driving increased demand for athletic footwear.
M&A Activities: The market has witnessed a number of M&A activities in recent years, with deal values ranging from xx Million to xx Million. These activities are driven by strategic expansion, brand consolidation, and market share acquisition. Examples include (Insert specific M&A deals and values if available, otherwise state "Specific details not available for disclosure").
APAC Athletic Footwear Market Dynamics & Trends
This section explores the market growth drivers, technological disruptions, consumer preferences, and competitive dynamics within the APAC athletic footwear market.
The market is projected to experience substantial growth during the forecast period, driven primarily by factors such as rising disposable incomes, increasing health consciousness, and the growing popularity of various sports and fitness activities across the region. The increasing adoption of e-commerce and online retail channels is also contributing to market expansion. Consumer preferences are shifting towards lightweight, high-performance footwear with advanced technological features, thus increasing demand for specialized athletic shoes. The competitive landscape is intense, with major players investing heavily in product innovation, marketing, and distribution networks to gain market share. The market is expected to grow at a CAGR of xx% during the forecast period 2025-2033, with market penetration increasing by xx% by 2033. Technological disruptions like the integration of smart technology in footwear and the introduction of sustainable materials are influencing consumer preferences and shaping the market. This is coupled with increasing emphasis on personalized experiences through customized shoe designs and fittings. This creates challenges and opportunities for existing players and new entrants in the market.
Dominant Regions & Segments in APAC Athletic Footwear Market
This section identifies the leading regions, countries, and segments within the APAC athletic footwear market.
Leading Regions: China and India are expected to remain the dominant markets due to high population density, expanding middle class, and rising disposable incomes. Other high-growth markets include countries experiencing high economic development and a growing interest in fitness and sports.
- Key Drivers for China: Strong economic growth, growing urban population, increasing government investment in sports infrastructure.
- Key Drivers for India: Rising disposable incomes, increasing health consciousness, and a young and active population.
Dominant Segments:
- By Distribution Channel: Online retail stores are witnessing rapid growth due to increased internet penetration and the convenience of online shopping, making it the fastest growing segment.
- By Type: Running shoes dominate the market, driven by the growing popularity of running and marathon events.
- By End User: Men currently represent the largest segment, but the women's segment is anticipated to witness significant growth, propelled by growing female participation in sports and fitness activities. The children’s market represents a steadily growing segment.
APAC Athletic Footwear Market Product Innovations
Recent years have seen significant innovation in athletic footwear, focusing on enhanced comfort, performance, and sustainability. Key advancements include the integration of smart technology, the use of lightweight and responsive cushioning materials, and the incorporation of sustainable and eco-friendly materials in manufacturing. These innovations cater to the increasing consumer demand for technologically advanced and environmentally conscious products. Specific examples include Puma's Nitro foam technology, Adidas's Ultraboost ULTRA4D, and Under Armour's HOVR Machina 3, which highlight the industry's ongoing commitment to technological advancement and improved performance.
Report Scope & Segmentation Analysis
This report provides a comprehensive segmentation of the APAC athletic footwear market, considering various factors such as distribution channels, product types, and end-users.
Distribution Channels: The market is segmented into sports and athletic goods stores, supermarkets/hypermarkets, online retail stores, and other distribution channels. Online retail is showing the fastest growth, followed by specialized sports stores.
Product Types: The market is segmented by running shoes, sports shoes, trekking/hiking shoes, and other product types. Running shoes currently dominate the market.
End-Users: The market is segmented based on end-users: men, women, and children. The men’s segment is currently the largest, while women’s and children’s segment show the highest projected growth.
Each segment's growth projections, market size, and competitive dynamics are analyzed in detail within the full report.
Key Drivers of APAC Athletic Footwear Market Growth
Several factors contribute to the growth of the APAC athletic footwear market. These include rising disposable incomes across the region, increasing health and fitness awareness, growing participation in sports and fitness activities, and technological advancements in footwear design and materials. Government initiatives promoting sports and fitness further stimulate market growth. The increasing popularity of online shopping also boosts market expansion.
Challenges in the APAP Athletic Footwear Market Sector
Despite significant growth potential, the APAC athletic footwear market faces various challenges. These include intense competition from both established international brands and emerging local players. Supply chain disruptions and fluctuations in raw material prices impact production costs and profitability. Stringent regulatory requirements related to product safety and environmental regulations also pose challenges. Counterfeit products also impact the market by eroding consumer confidence and revenues.
Emerging Opportunities in APAC Athletic Footwear Market
The APAC athletic footwear market presents numerous opportunities for growth. The rising popularity of specialized sports like running and trail running creates demand for niche products. Growing adoption of sustainable and eco-friendly materials presents an opportunity for brands focused on environmental responsibility. Expansion into tier-2 and tier-3 cities, where purchasing power is growing, offers significant untapped potential.
Leading Players in the APAC Athletic Footwear Market Market
Key Developments in APAC Athletic Footwear Market Industry
June 2022: Under Armour Inc. launched its athletic shoes 'HOVR Machina 3' in India. This launch showcases Under Armour’s commitment to the Indian market and its focus on technologically advanced products.
January 2022: Adidas AG launched Ultraboost ULTRA4D shoes in India. This launch highlights Adidas's continuous innovation and adaptation to local market demands.
February 2021: Puma launched five new running shoes featuring its new Nitro foam technology. This demonstrates Puma’s focus on technological innovation to enhance running performance and attract consumers.
Future Outlook for APAC Athletic Footwear Market Market
The APAC athletic footwear market is poised for continued strong growth, driven by increasing health consciousness, rising disposable incomes, and the growing popularity of sports and fitness activities. Technological advancements, particularly in areas such as sustainable materials and smart shoe technology, will continue to shape market trends. The market will also see an increase in customization and personalization options and expansion of e-commerce channels. Strategic partnerships and collaborations among brands are also likely to be key features of the market landscape in the coming years.
APAC Athletic Footwear Market Segmentation
-
1. Type
- 1.1. Running Shoes
- 1.2. Sports Shoes
- 1.3. Trekking/Hiking Shoes
- 1.4. Other Product Types
-
2. End User
- 2.1. Men
- 2.2. Women
- 2.3. Children
-
3. Distrubution Channel
- 3.1. Sports and Athletic Goods Stores
- 3.2. Supermarkets/Hypermarkets
- 3.3. Online Retail Stores
- 3.4. Other Distribution Channels
-
4. Geography
- 4.1. China
- 4.2. Japan
- 4.3. India
- 4.4. Australia
- 4.5. Rest of Asia-Pacific
APAC Athletic Footwear Market Segmentation By Geography
- 1. China
- 2. Japan
- 3. India
- 4. Australia
- 5. Rest of Asia Pacific
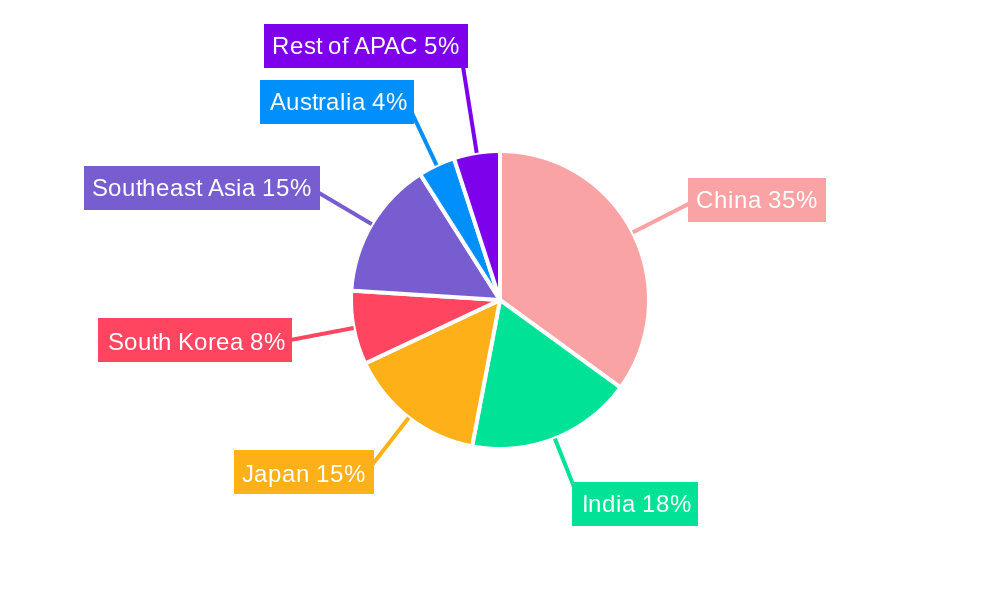
APAC Athletic Footwear Market Regional Market Share
Geographic Coverage of APAC Athletic Footwear Market
APAC Athletic Footwear Market REPORT HIGHLIGHTS
| Aspects | Details |
|---|---|
| Study Period | 2020-2034 |
| Base Year | 2025 |
| Estimated Year | 2026 |
| Forecast Period | 2026-2034 |
| Historical Period | 2020-2025 |
| Growth Rate | CAGR of 6.83% from 2020-2034 |
| Segmentation |
|
Table of Contents
- 1. Introduction
- 1.1. Research Scope
- 1.2. Market Segmentation
- 1.3. Research Objective
- 1.4. Definitions and Assumptions
- 2. Executive Summary
- 2.1. Market Snapshot
- 3. Market Dynamics
- 3.1. Market Drivers
- 3.2. Market Restrains
- 3.3. Market Trends
- 3.4. Market Opportunities
- 4. Market Factor Analysis
- 4.1. Porters Five Forces
- 4.1.1. Bargaining Power of Suppliers
- 4.1.2. Bargaining Power of Buyers
- 4.1.3. Threat of New Entrants
- 4.1.4. Threat of Substitutes
- 4.1.5. Competitive Rivalry
- 4.2. PESTEL analysis
- 4.3. BCG Analysis
- 4.3.1. Stars (High Growth, High Market Share)
- 4.3.2. Cash Cows (Low Growth, High Market Share)
- 4.3.3. Question Mark (High Growth, Low Market Share)
- 4.3.4. Dogs (Low Growth, Low Market Share)
- 4.4. Ansoff Matrix Analysis
- 4.5. Supply Chain Analysis
- 4.6. Regulatory Landscape
- 4.7. Current Market Potential and Opportunity Assessment (TAM–SAM–SOM Framework)
- 4.8. PRI Analyst Note
- 4.1. Porters Five Forces
- 5. Market Analysis, Insights and Forecast 2021-2033
- 5.1. Market Analysis, Insights and Forecast - by Type
- 5.1.1. Running Shoes
- 5.1.2. Sports Shoes
- 5.1.3. Trekking/Hiking Shoes
- 5.1.4. Other Product Types
- 5.2. Market Analysis, Insights and Forecast - by End User
- 5.2.1. Men
- 5.2.2. Women
- 5.2.3. Children
- 5.3. Market Analysis, Insights and Forecast - by Distrubution Channel
- 5.3.1. Sports and Athletic Goods Stores
- 5.3.2. Supermarkets/Hypermarkets
- 5.3.3. Online Retail Stores
- 5.3.4. Other Distribution Channels
- 5.4. Market Analysis, Insights and Forecast - by Geography
- 5.4.1. China
- 5.4.2. Japan
- 5.4.3. India
- 5.4.4. Australia
- 5.4.5. Rest of Asia-Pacific
- 5.5. Market Analysis, Insights and Forecast - by Region
- 5.5.1. China
- 5.5.2. Japan
- 5.5.3. India
- 5.5.4. Australia
- 5.5.5. Rest of Asia Pacific
- 5.1. Market Analysis, Insights and Forecast - by Type
- 6. Global APAC Athletic Footwear Market Analysis, Insights and Forecast, 2021-2033
- 6.1. Market Analysis, Insights and Forecast - by Type
- 6.1.1. Running Shoes
- 6.1.2. Sports Shoes
- 6.1.3. Trekking/Hiking Shoes
- 6.1.4. Other Product Types
- 6.2. Market Analysis, Insights and Forecast - by End User
- 6.2.1. Men
- 6.2.2. Women
- 6.2.3. Children
- 6.3. Market Analysis, Insights and Forecast - by Distrubution Channel
- 6.3.1. Sports and Athletic Goods Stores
- 6.3.2. Supermarkets/Hypermarkets
- 6.3.3. Online Retail Stores
- 6.3.4. Other Distribution Channels
- 6.4. Market Analysis, Insights and Forecast - by Geography
- 6.4.1. China
- 6.4.2. Japan
- 6.4.3. India
- 6.4.4. Australia
- 6.4.5. Rest of Asia-Pacific
- 6.1. Market Analysis, Insights and Forecast - by Type
- 7. China APAC Athletic Footwear Market Analysis, Insights and Forecast, 2020-2032
- 7.1. Market Analysis, Insights and Forecast - by Type
- 7.1.1. Running Shoes
- 7.1.2. Sports Shoes
- 7.1.3. Trekking/Hiking Shoes
- 7.1.4. Other Product Types
- 7.2. Market Analysis, Insights and Forecast - by End User
- 7.2.1. Men
- 7.2.2. Women
- 7.2.3. Children
- 7.3. Market Analysis, Insights and Forecast - by Distrubution Channel
- 7.3.1. Sports and Athletic Goods Stores
- 7.3.2. Supermarkets/Hypermarkets
- 7.3.3. Online Retail Stores
- 7.3.4. Other Distribution Channels
- 7.4. Market Analysis, Insights and Forecast - by Geography
- 7.4.1. China
- 7.4.2. Japan
- 7.4.3. India
- 7.4.4. Australia
- 7.4.5. Rest of Asia-Pacific
- 7.1. Market Analysis, Insights and Forecast - by Type
- 8. Japan APAC Athletic Footwear Market Analysis, Insights and Forecast, 2020-2032
- 8.1. Market Analysis, Insights and Forecast - by Type
- 8.1.1. Running Shoes
- 8.1.2. Sports Shoes
- 8.1.3. Trekking/Hiking Shoes
- 8.1.4. Other Product Types
- 8.2. Market Analysis, Insights and Forecast - by End User
- 8.2.1. Men
- 8.2.2. Women
- 8.2.3. Children
- 8.3. Market Analysis, Insights and Forecast - by Distrubution Channel
- 8.3.1. Sports and Athletic Goods Stores
- 8.3.2. Supermarkets/Hypermarkets
- 8.3.3. Online Retail Stores
- 8.3.4. Other Distribution Channels
- 8.4. Market Analysis, Insights and Forecast - by Geography
- 8.4.1. China
- 8.4.2. Japan
- 8.4.3. India
- 8.4.4. Australia
- 8.4.5. Rest of Asia-Pacific
- 8.1. Market Analysis, Insights and Forecast - by Type
- 9. India APAC Athletic Footwear Market Analysis, Insights and Forecast, 2020-2032
- 9.1. Market Analysis, Insights and Forecast - by Type
- 9.1.1. Running Shoes
- 9.1.2. Sports Shoes
- 9.1.3. Trekking/Hiking Shoes
- 9.1.4. Other Product Types
- 9.2. Market Analysis, Insights and Forecast - by End User
- 9.2.1. Men
- 9.2.2. Women
- 9.2.3. Children
- 9.3. Market Analysis, Insights and Forecast - by Distrubution Channel
- 9.3.1. Sports and Athletic Goods Stores
- 9.3.2. Supermarkets/Hypermarkets
- 9.3.3. Online Retail Stores
- 9.3.4. Other Distribution Channels
- 9.4. Market Analysis, Insights and Forecast - by Geography
- 9.4.1. China
- 9.4.2. Japan
- 9.4.3. India
- 9.4.4. Australia
- 9.4.5. Rest of Asia-Pacific
- 9.1. Market Analysis, Insights and Forecast - by Type
- 10. Australia APAC Athletic Footwear Market Analysis, Insights and Forecast, 2020-2032
- 10.1. Market Analysis, Insights and Forecast - by Type
- 10.1.1. Running Shoes
- 10.1.2. Sports Shoes
- 10.1.3. Trekking/Hiking Shoes
- 10.1.4. Other Product Types
- 10.2. Market Analysis, Insights and Forecast - by End User
- 10.2.1. Men
- 10.2.2. Women
- 10.2.3. Children
- 10.3. Market Analysis, Insights and Forecast - by Distrubution Channel
- 10.3.1. Sports and Athletic Goods Stores
- 10.3.2. Supermarkets/Hypermarkets
- 10.3.3. Online Retail Stores
- 10.3.4. Other Distribution Channels
- 10.4. Market Analysis, Insights and Forecast - by Geography
- 10.4.1. China
- 10.4.2. Japan
- 10.4.3. India
- 10.4.4. Australia
- 10.4.5. Rest of Asia-Pacific
- 10.1. Market Analysis, Insights and Forecast - by Type
- 11. Rest of Asia Pacific APAC Athletic Footwear Market Analysis, Insights and Forecast, 2020-2032
- 11.1. Market Analysis, Insights and Forecast - by Type
- 11.1.1. Running Shoes
- 11.1.2. Sports Shoes
- 11.1.3. Trekking/Hiking Shoes
- 11.1.4. Other Product Types
- 11.2. Market Analysis, Insights and Forecast - by End User
- 11.2.1. Men
- 11.2.2. Women
- 11.2.3. Children
- 11.3. Market Analysis, Insights and Forecast - by Distrubution Channel
- 11.3.1. Sports and Athletic Goods Stores
- 11.3.2. Supermarkets/Hypermarkets
- 11.3.3. Online Retail Stores
- 11.3.4. Other Distribution Channels
- 11.4. Market Analysis, Insights and Forecast - by Geography
- 11.4.1. China
- 11.4.2. Japan
- 11.4.3. India
- 11.4.4. Australia
- 11.4.5. Rest of Asia-Pacific
- 11.1. Market Analysis, Insights and Forecast - by Type
- 12. Competitive Analysis
- 12.1. Company Profiles
- 12.1.1 Adidas AG
- 12.1.1.1. Company Overview
- 12.1.1.2. Products
- 12.1.1.3. Company Financials
- 12.1.1.4. SWOT Analysis
- 12.1.2 VF Corporation
- 12.1.2.1. Company Overview
- 12.1.2.2. Products
- 12.1.2.3. Company Financials
- 12.1.2.4. SWOT Analysis
- 12.1.3 Brooks Running Company
- 12.1.3.1. Company Overview
- 12.1.3.2. Products
- 12.1.3.3. Company Financials
- 12.1.3.4. SWOT Analysis
- 12.1.4 FILA Holdings Corporation
- 12.1.4.1. Company Overview
- 12.1.4.2. Products
- 12.1.4.3. Company Financials
- 12.1.4.4. SWOT Analysis
- 12.1.5 Asics Corporation
- 12.1.5.1. Company Overview
- 12.1.5.2. Products
- 12.1.5.3. Company Financials
- 12.1.5.4. SWOT Analysis
- 12.1.6 Puma SE
- 12.1.6.1. Company Overview
- 12.1.6.2. Products
- 12.1.6.3. Company Financials
- 12.1.6.4. SWOT Analysis
- 12.1.7 Under Armour Inc
- 12.1.7.1. Company Overview
- 12.1.7.2. Products
- 12.1.7.3. Company Financials
- 12.1.7.4. SWOT Analysis
- 12.1.8 Nike Inc
- 12.1.8.1. Company Overview
- 12.1.8.2. Products
- 12.1.8.3. Company Financials
- 12.1.8.4. SWOT Analysis
- 12.1.9 Li-Ning Company Limited
- 12.1.9.1. Company Overview
- 12.1.9.2. Products
- 12.1.9.3. Company Financials
- 12.1.9.4. SWOT Analysis
- 12.1.10 New Balance Athletics Inc
- 12.1.10.1. Company Overview
- 12.1.10.2. Products
- 12.1.10.3. Company Financials
- 12.1.10.4. SWOT Analysis
- 12.1.1 Adidas AG
- 12.2. Market Entropy
- 12.2.1 Company's Key Areas Served
- 12.2.2 Recent Developments
- 12.3. Company Market Share Analysis 2025
- 12.3.1 Top 5 Companies Market Share Analysis
- 12.3.2 Top 3 Companies Market Share Analysis
- 12.4. List of Potential Customers
- 13. Research Methodology
List of Figures
- Figure 1: Global APAC Athletic Footwear Market Revenue Breakdown (billion, %) by Region 2025 & 2033
- Figure 2: Global APAC Athletic Footwear Market Volume Breakdown (K Units, %) by Region 2025 & 2033
- Figure 3: China APAC Athletic Footwear Market Revenue (billion), by Type 2025 & 2033
- Figure 4: China APAC Athletic Footwear Market Volume (K Units), by Type 2025 & 2033
- Figure 5: China APAC Athletic Footwear Market Revenue Share (%), by Type 2025 & 2033
- Figure 6: China APAC Athletic Footwear Market Volume Share (%), by Type 2025 & 2033
- Figure 7: China APAC Athletic Footwear Market Revenue (billion), by End User 2025 & 2033
- Figure 8: China APAC Athletic Footwear Market Volume (K Units), by End User 2025 & 2033
- Figure 9: China APAC Athletic Footwear Market Revenue Share (%), by End User 2025 & 2033
- Figure 10: China APAC Athletic Footwear Market Volume Share (%), by End User 2025 & 2033
- Figure 11: China APAC Athletic Footwear Market Revenue (billion), by Distrubution Channel 2025 & 2033
- Figure 12: China APAC Athletic Footwear Market Volume (K Units), by Distrubution Channel 2025 & 2033
- Figure 13: China APAC Athletic Footwear Market Revenue Share (%), by Distrubution Channel 2025 & 2033
- Figure 14: China APAC Athletic Footwear Market Volume Share (%), by Distrubution Channel 2025 & 2033
- Figure 15: China APAC Athletic Footwear Market Revenue (billion), by Geography 2025 & 2033
- Figure 16: China APAC Athletic Footwear Market Volume (K Units), by Geography 2025 & 2033
- Figure 17: China APAC Athletic Footwear Market Revenue Share (%), by Geography 2025 & 2033
- Figure 18: China APAC Athletic Footwear Market Volume Share (%), by Geography 2025 & 2033
- Figure 19: China APAC Athletic Footwear Market Revenue (billion), by Country 2025 & 2033
- Figure 20: China APAC Athletic Footwear Market Volume (K Units), by Country 2025 & 2033
- Figure 21: China APAC Athletic Footwear Market Revenue Share (%), by Country 2025 & 2033
- Figure 22: China APAC Athletic Footwear Market Volume Share (%), by Country 2025 & 2033
- Figure 23: Japan APAC Athletic Footwear Market Revenue (billion), by Type 2025 & 2033
- Figure 24: Japan APAC Athletic Footwear Market Volume (K Units), by Type 2025 & 2033
- Figure 25: Japan APAC Athletic Footwear Market Revenue Share (%), by Type 2025 & 2033
- Figure 26: Japan APAC Athletic Footwear Market Volume Share (%), by Type 2025 & 2033
- Figure 27: Japan APAC Athletic Footwear Market Revenue (billion), by End User 2025 & 2033
- Figure 28: Japan APAC Athletic Footwear Market Volume (K Units), by End User 2025 & 2033
- Figure 29: Japan APAC Athletic Footwear Market Revenue Share (%), by End User 2025 & 2033
- Figure 30: Japan APAC Athletic Footwear Market Volume Share (%), by End User 2025 & 2033
- Figure 31: Japan APAC Athletic Footwear Market Revenue (billion), by Distrubution Channel 2025 & 2033
- Figure 32: Japan APAC Athletic Footwear Market Volume (K Units), by Distrubution Channel 2025 & 2033
- Figure 33: Japan APAC Athletic Footwear Market Revenue Share (%), by Distrubution Channel 2025 & 2033
- Figure 34: Japan APAC Athletic Footwear Market Volume Share (%), by Distrubution Channel 2025 & 2033
- Figure 35: Japan APAC Athletic Footwear Market Revenue (billion), by Geography 2025 & 2033
- Figure 36: Japan APAC Athletic Footwear Market Volume (K Units), by Geography 2025 & 2033
- Figure 37: Japan APAC Athletic Footwear Market Revenue Share (%), by Geography 2025 & 2033
- Figure 38: Japan APAC Athletic Footwear Market Volume Share (%), by Geography 2025 & 2033
- Figure 39: Japan APAC Athletic Footwear Market Revenue (billion), by Country 2025 & 2033
- Figure 40: Japan APAC Athletic Footwear Market Volume (K Units), by Country 2025 & 2033
- Figure 41: Japan APAC Athletic Footwear Market Revenue Share (%), by Country 2025 & 2033
- Figure 42: Japan APAC Athletic Footwear Market Volume Share (%), by Country 2025 & 2033
- Figure 43: India APAC Athletic Footwear Market Revenue (billion), by Type 2025 & 2033
- Figure 44: India APAC Athletic Footwear Market Volume (K Units), by Type 2025 & 2033
- Figure 45: India APAC Athletic Footwear Market Revenue Share (%), by Type 2025 & 2033
- Figure 46: India APAC Athletic Footwear Market Volume Share (%), by Type 2025 & 2033
- Figure 47: India APAC Athletic Footwear Market Revenue (billion), by End User 2025 & 2033
- Figure 48: India APAC Athletic Footwear Market Volume (K Units), by End User 2025 & 2033
- Figure 49: India APAC Athletic Footwear Market Revenue Share (%), by End User 2025 & 2033
- Figure 50: India APAC Athletic Footwear Market Volume Share (%), by End User 2025 & 2033
- Figure 51: India APAC Athletic Footwear Market Revenue (billion), by Distrubution Channel 2025 & 2033
- Figure 52: India APAC Athletic Footwear Market Volume (K Units), by Distrubution Channel 2025 & 2033
- Figure 53: India APAC Athletic Footwear Market Revenue Share (%), by Distrubution Channel 2025 & 2033
- Figure 54: India APAC Athletic Footwear Market Volume Share (%), by Distrubution Channel 2025 & 2033
- Figure 55: India APAC Athletic Footwear Market Revenue (billion), by Geography 2025 & 2033
- Figure 56: India APAC Athletic Footwear Market Volume (K Units), by Geography 2025 & 2033
- Figure 57: India APAC Athletic Footwear Market Revenue Share (%), by Geography 2025 & 2033
- Figure 58: India APAC Athletic Footwear Market Volume Share (%), by Geography 2025 & 2033
- Figure 59: India APAC Athletic Footwear Market Revenue (billion), by Country 2025 & 2033
- Figure 60: India APAC Athletic Footwear Market Volume (K Units), by Country 2025 & 2033
- Figure 61: India APAC Athletic Footwear Market Revenue Share (%), by Country 2025 & 2033
- Figure 62: India APAC Athletic Footwear Market Volume Share (%), by Country 2025 & 2033
- Figure 63: Australia APAC Athletic Footwear Market Revenue (billion), by Type 2025 & 2033
- Figure 64: Australia APAC Athletic Footwear Market Volume (K Units), by Type 2025 & 2033
- Figure 65: Australia APAC Athletic Footwear Market Revenue Share (%), by Type 2025 & 2033
- Figure 66: Australia APAC Athletic Footwear Market Volume Share (%), by Type 2025 & 2033
- Figure 67: Australia APAC Athletic Footwear Market Revenue (billion), by End User 2025 & 2033
- Figure 68: Australia APAC Athletic Footwear Market Volume (K Units), by End User 2025 & 2033
- Figure 69: Australia APAC Athletic Footwear Market Revenue Share (%), by End User 2025 & 2033
- Figure 70: Australia APAC Athletic Footwear Market Volume Share (%), by End User 2025 & 2033
- Figure 71: Australia APAC Athletic Footwear Market Revenue (billion), by Distrubution Channel 2025 & 2033
- Figure 72: Australia APAC Athletic Footwear Market Volume (K Units), by Distrubution Channel 2025 & 2033
- Figure 73: Australia APAC Athletic Footwear Market Revenue Share (%), by Distrubution Channel 2025 & 2033
- Figure 74: Australia APAC Athletic Footwear Market Volume Share (%), by Distrubution Channel 2025 & 2033
- Figure 75: Australia APAC Athletic Footwear Market Revenue (billion), by Geography 2025 & 2033
- Figure 76: Australia APAC Athletic Footwear Market Volume (K Units), by Geography 2025 & 2033
- Figure 77: Australia APAC Athletic Footwear Market Revenue Share (%), by Geography 2025 & 2033
- Figure 78: Australia APAC Athletic Footwear Market Volume Share (%), by Geography 2025 & 2033
- Figure 79: Australia APAC Athletic Footwear Market Revenue (billion), by Country 2025 & 2033
- Figure 80: Australia APAC Athletic Footwear Market Volume (K Units), by Country 2025 & 2033
- Figure 81: Australia APAC Athletic Footwear Market Revenue Share (%), by Country 2025 & 2033
- Figure 82: Australia APAC Athletic Footwear Market Volume Share (%), by Country 2025 & 2033
- Figure 83: Rest of Asia Pacific APAC Athletic Footwear Market Revenue (billion), by Type 2025 & 2033
- Figure 84: Rest of Asia Pacific APAC Athletic Footwear Market Volume (K Units), by Type 2025 & 2033
- Figure 85: Rest of Asia Pacific APAC Athletic Footwear Market Revenue Share (%), by Type 2025 & 2033
- Figure 86: Rest of Asia Pacific APAC Athletic Footwear Market Volume Share (%), by Type 2025 & 2033
- Figure 87: Rest of Asia Pacific APAC Athletic Footwear Market Revenue (billion), by End User 2025 & 2033
- Figure 88: Rest of Asia Pacific APAC Athletic Footwear Market Volume (K Units), by End User 2025 & 2033
- Figure 89: Rest of Asia Pacific APAC Athletic Footwear Market Revenue Share (%), by End User 2025 & 2033
- Figure 90: Rest of Asia Pacific APAC Athletic Footwear Market Volume Share (%), by End User 2025 & 2033
- Figure 91: Rest of Asia Pacific APAC Athletic Footwear Market Revenue (billion), by Distrubution Channel 2025 & 2033
- Figure 92: Rest of Asia Pacific APAC Athletic Footwear Market Volume (K Units), by Distrubution Channel 2025 & 2033
- Figure 93: Rest of Asia Pacific APAC Athletic Footwear Market Revenue Share (%), by Distrubution Channel 2025 & 2033
- Figure 94: Rest of Asia Pacific APAC Athletic Footwear Market Volume Share (%), by Distrubution Channel 2025 & 2033
- Figure 95: Rest of Asia Pacific APAC Athletic Footwear Market Revenue (billion), by Geography 2025 & 2033
- Figure 96: Rest of Asia Pacific APAC Athletic Footwear Market Volume (K Units), by Geography 2025 & 2033
- Figure 97: Rest of Asia Pacific APAC Athletic Footwear Market Revenue Share (%), by Geography 2025 & 2033
- Figure 98: Rest of Asia Pacific APAC Athletic Footwear Market Volume Share (%), by Geography 2025 & 2033
- Figure 99: Rest of Asia Pacific APAC Athletic Footwear Market Revenue (billion), by Country 2025 & 2033
- Figure 100: Rest of Asia Pacific APAC Athletic Footwear Market Volume (K Units), by Country 2025 & 2033
- Figure 101: Rest of Asia Pacific APAC Athletic Footwear Market Revenue Share (%), by Country 2025 & 2033
- Figure 102: Rest of Asia Pacific APAC Athletic Footwear Market Volume Share (%), by Country 2025 & 2033
List of Tables
- Table 1: Global APAC Athletic Footwear Market Revenue billion Forecast, by Type 2020 & 2033
- Table 2: Global APAC Athletic Footwear Market Volume K Units Forecast, by Type 2020 & 2033
- Table 3: Global APAC Athletic Footwear Market Revenue billion Forecast, by End User 2020 & 2033
- Table 4: Global APAC Athletic Footwear Market Volume K Units Forecast, by End User 2020 & 2033
- Table 5: Global APAC Athletic Footwear Market Revenue billion Forecast, by Distrubution Channel 2020 & 2033
- Table 6: Global APAC Athletic Footwear Market Volume K Units Forecast, by Distrubution Channel 2020 & 2033
- Table 7: Global APAC Athletic Footwear Market Revenue billion Forecast, by Geography 2020 & 2033
- Table 8: Global APAC Athletic Footwear Market Volume K Units Forecast, by Geography 2020 & 2033
- Table 9: Global APAC Athletic Footwear Market Revenue billion Forecast, by Region 2020 & 2033
- Table 10: Global APAC Athletic Footwear Market Volume K Units Forecast, by Region 2020 & 2033
- Table 11: Global APAC Athletic Footwear Market Revenue billion Forecast, by Type 2020 & 2033
- Table 12: Global APAC Athletic Footwear Market Volume K Units Forecast, by Type 2020 & 2033
- Table 13: Global APAC Athletic Footwear Market Revenue billion Forecast, by End User 2020 & 2033
- Table 14: Global APAC Athletic Footwear Market Volume K Units Forecast, by End User 2020 & 2033
- Table 15: Global APAC Athletic Footwear Market Revenue billion Forecast, by Distrubution Channel 2020 & 2033
- Table 16: Global APAC Athletic Footwear Market Volume K Units Forecast, by Distrubution Channel 2020 & 2033
- Table 17: Global APAC Athletic Footwear Market Revenue billion Forecast, by Geography 2020 & 2033
- Table 18: Global APAC Athletic Footwear Market Volume K Units Forecast, by Geography 2020 & 2033
- Table 19: Global APAC Athletic Footwear Market Revenue billion Forecast, by Country 2020 & 2033
- Table 20: Global APAC Athletic Footwear Market Volume K Units Forecast, by Country 2020 & 2033
- Table 21: Global APAC Athletic Footwear Market Revenue billion Forecast, by Type 2020 & 2033
- Table 22: Global APAC Athletic Footwear Market Volume K Units Forecast, by Type 2020 & 2033
- Table 23: Global APAC Athletic Footwear Market Revenue billion Forecast, by End User 2020 & 2033
- Table 24: Global APAC Athletic Footwear Market Volume K Units Forecast, by End User 2020 & 2033
- Table 25: Global APAC Athletic Footwear Market Revenue billion Forecast, by Distrubution Channel 2020 & 2033
- Table 26: Global APAC Athletic Footwear Market Volume K Units Forecast, by Distrubution Channel 2020 & 2033
- Table 27: Global APAC Athletic Footwear Market Revenue billion Forecast, by Geography 2020 & 2033
- Table 28: Global APAC Athletic Footwear Market Volume K Units Forecast, by Geography 2020 & 2033
- Table 29: Global APAC Athletic Footwear Market Revenue billion Forecast, by Country 2020 & 2033
- Table 30: Global APAC Athletic Footwear Market Volume K Units Forecast, by Country 2020 & 2033
- Table 31: Global APAC Athletic Footwear Market Revenue billion Forecast, by Type 2020 & 2033
- Table 32: Global APAC Athletic Footwear Market Volume K Units Forecast, by Type 2020 & 2033
- Table 33: Global APAC Athletic Footwear Market Revenue billion Forecast, by End User 2020 & 2033
- Table 34: Global APAC Athletic Footwear Market Volume K Units Forecast, by End User 2020 & 2033
- Table 35: Global APAC Athletic Footwear Market Revenue billion Forecast, by Distrubution Channel 2020 & 2033
- Table 36: Global APAC Athletic Footwear Market Volume K Units Forecast, by Distrubution Channel 2020 & 2033
- Table 37: Global APAC Athletic Footwear Market Revenue billion Forecast, by Geography 2020 & 2033
- Table 38: Global APAC Athletic Footwear Market Volume K Units Forecast, by Geography 2020 & 2033
- Table 39: Global APAC Athletic Footwear Market Revenue billion Forecast, by Country 2020 & 2033
- Table 40: Global APAC Athletic Footwear Market Volume K Units Forecast, by Country 2020 & 2033
- Table 41: Global APAC Athletic Footwear Market Revenue billion Forecast, by Type 2020 & 2033
- Table 42: Global APAC Athletic Footwear Market Volume K Units Forecast, by Type 2020 & 2033
- Table 43: Global APAC Athletic Footwear Market Revenue billion Forecast, by End User 2020 & 2033
- Table 44: Global APAC Athletic Footwear Market Volume K Units Forecast, by End User 2020 & 2033
- Table 45: Global APAC Athletic Footwear Market Revenue billion Forecast, by Distrubution Channel 2020 & 2033
- Table 46: Global APAC Athletic Footwear Market Volume K Units Forecast, by Distrubution Channel 2020 & 2033
- Table 47: Global APAC Athletic Footwear Market Revenue billion Forecast, by Geography 2020 & 2033
- Table 48: Global APAC Athletic Footwear Market Volume K Units Forecast, by Geography 2020 & 2033
- Table 49: Global APAC Athletic Footwear Market Revenue billion Forecast, by Country 2020 & 2033
- Table 50: Global APAC Athletic Footwear Market Volume K Units Forecast, by Country 2020 & 2033
- Table 51: Global APAC Athletic Footwear Market Revenue billion Forecast, by Type 2020 & 2033
- Table 52: Global APAC Athletic Footwear Market Volume K Units Forecast, by Type 2020 & 2033
- Table 53: Global APAC Athletic Footwear Market Revenue billion Forecast, by End User 2020 & 2033
- Table 54: Global APAC Athletic Footwear Market Volume K Units Forecast, by End User 2020 & 2033
- Table 55: Global APAC Athletic Footwear Market Revenue billion Forecast, by Distrubution Channel 2020 & 2033
- Table 56: Global APAC Athletic Footwear Market Volume K Units Forecast, by Distrubution Channel 2020 & 2033
- Table 57: Global APAC Athletic Footwear Market Revenue billion Forecast, by Geography 2020 & 2033
- Table 58: Global APAC Athletic Footwear Market Volume K Units Forecast, by Geography 2020 & 2033
- Table 59: Global APAC Athletic Footwear Market Revenue billion Forecast, by Country 2020 & 2033
- Table 60: Global APAC Athletic Footwear Market Volume K Units Forecast, by Country 2020 & 2033
Frequently Asked Questions
1. What is the projected Compound Annual Growth Rate (CAGR) of the APAC Athletic Footwear Market?
The projected CAGR is approximately 6.83%.
2. Which companies are prominent players in the APAC Athletic Footwear Market?
Key companies in the market include Adidas AG, VF Corporation, Brooks Running Company, FILA Holdings Corporation, Asics Corporation, Puma SE, Under Armour Inc, Nike Inc, Li-Ning Company Limited, New Balance Athletics Inc.
3. What are the main segments of the APAC Athletic Footwear Market?
The market segments include Type, End User, Distrubution Channel, Geography.
4. Can you provide details about the market size?
The market size is estimated to be USD 194 billion as of 2022.
5. What are some drivers contributing to market growth?
Increased Sports Participation and Flourishing Demand for Sports Apparel; Rising Innovation in Athleisure Products.
6. What are the notable trends driving market growth?
Rising Sports Participation Rate with Inclination Toward Healthy Lifestyle.
7. Are there any restraints impacting market growth?
Penetration of Counterfeit Products.
8. Can you provide examples of recent developments in the market?
In June 2022, Under Armour Inc launched its athletic shoes 'HOVR Machina 3' in India. The third edition of the UA HOVRTM Machina running shoes, the HOVR Machina 3, has now been released by the company in India after being thoroughly tested and certified by UA Athletes. With a price of INR 14,999, this shoe continues to satisfy consumer needs by offering the most recent in technology and innovation.
9. What pricing options are available for accessing the report?
Pricing options include single-user, multi-user, and enterprise licenses priced at USD 4750, USD 5250, and USD 8750 respectively.
10. Is the market size provided in terms of value or volume?
The market size is provided in terms of value, measured in billion and volume, measured in K Units.
11. Are there any specific market keywords associated with the report?
Yes, the market keyword associated with the report is "APAC Athletic Footwear Market," which aids in identifying and referencing the specific market segment covered.
12. How do I determine which pricing option suits my needs best?
The pricing options vary based on user requirements and access needs. Individual users may opt for single-user licenses, while businesses requiring broader access may choose multi-user or enterprise licenses for cost-effective access to the report.
13. Are there any additional resources or data provided in the APAC Athletic Footwear Market report?
While the report offers comprehensive insights, it's advisable to review the specific contents or supplementary materials provided to ascertain if additional resources or data are available.
14. How can I stay updated on further developments or reports in the APAC Athletic Footwear Market?
To stay informed about further developments, trends, and reports in the APAC Athletic Footwear Market, consider subscribing to industry newsletters, following relevant companies and organizations, or regularly checking reputable industry news sources and publications.
Methodology
Step 1 - Identification of Relevant Samples Size from Population Database


Step 2 - Approaches for Defining Global Market Size (Value, Volume* & Price*)

Note*: In applicable scenarios
Step 3 - Data Sources
Primary Research
- Web Analytics
- Survey Reports
- Research Institute
- Latest Research Reports
- Opinion Leaders
Secondary Research
- Annual Reports
- White Paper
- Latest Press Release
- Industry Association
- Paid Database
- Investor Presentations

Step 4 - Data Triangulation
Involves using different sources of information in order to increase the validity of a study
These sources are likely to be stakeholders in a program - participants, other researchers, program staff, other community members, and so on.
Then we put all data in single framework & apply various statistical tools to find out the dynamic on the market.
During the analysis stage, feedback from the stakeholder groups would be compared to determine areas of agreement as well as areas of divergence