

Key Insights
The Asia-Pacific (APAC) road freight market, valued at approximately 68827.8 million in its base year of 2024, is poised for substantial expansion. Projections indicate a Compound Annual Growth Rate (CAGR) of 5.3% from 2024 to 2033. This growth is propelled by several key drivers. The rapid expansion of e-commerce across major APAC economies, including China, India, and Indonesia, is significantly increasing demand for efficient last-mile delivery, thereby boosting the less-than-truckload (LTL) segment. Concurrently, robust growth in manufacturing and industrial sectors throughout the region, notably in Vietnam and Thailand, is driving the need for full-truckload (FTL) services to transport raw materials and finished goods. Furthermore, government-led infrastructure development initiatives, encompassing road networks and logistics hubs, are enhancing transportation efficiency and speed, contributing to overall market growth. The increasing demand for temperature-controlled transport, driven by the expanding food and pharmaceutical industries, also plays a crucial role in market expansion. While challenges such as volatile fuel prices and driver shortages persist, the positive economic outlook and rising consumption levels in APAC are expected to counterbalance these restraints. The market's segmentation by distance (long-haul, short-haul), goods type (fluid, solid), temperature requirements, and end-user industries (manufacturing, agriculture, etc.) offers diverse opportunities for specialization and niche market capture.
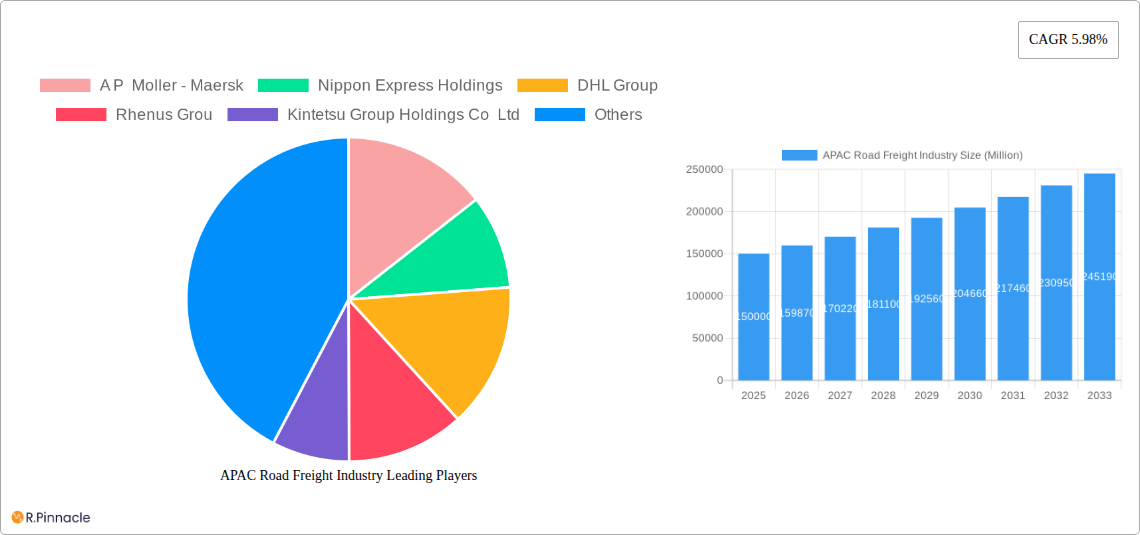
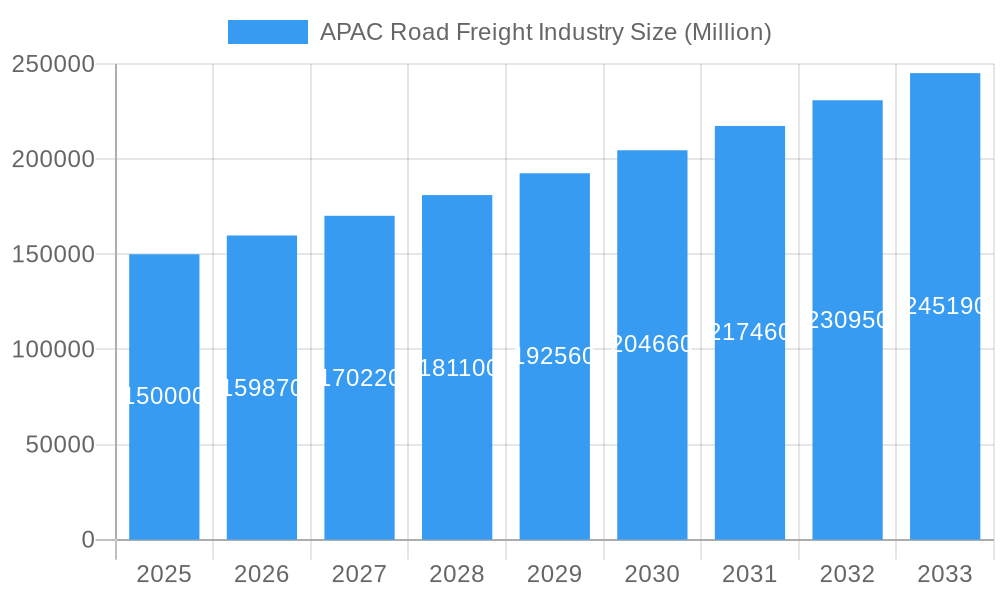
APAC Road Freight Industry Market Size (In Billion)
The competitive landscape features established global logistics providers such as Maersk, DHL, and Nippon Express, alongside dynamic regional players catering to localized demands. The increasing integration of technology, including route optimization software and telematics, is enhancing operational efficiency and supply chain transparency. Moreover, a growing emphasis on sustainability is prompting the adoption of eco-friendly transportation solutions, representing a new avenue for growth. Future expansion will be contingent upon continued infrastructure development, technological advancements, and the agility of companies in adapting to evolving consumer needs and regulatory frameworks across the diverse APAC markets. The road freight industry in APAC is on a clear trajectory towards significant growth, underpinned by the region's economic vitality and evolving logistics requirements.
APAC Road Freight Industry Company Market Share
APAC Road Freight Industry: Market Analysis & Future Outlook (2019-2033)
This comprehensive report provides an in-depth analysis of the Asia-Pacific (APAC) road freight industry, covering market size, segmentation, key players, growth drivers, challenges, and future outlook. The study period spans 2019-2033, with 2025 as the base year. This report is essential for industry professionals, investors, and strategic decision-makers seeking to understand and capitalize on the opportunities within this dynamic market. The report leverages extensive data and analysis to offer actionable insights, helping you navigate the complexities of the APAC road freight landscape.
APAC Road Freight Industry Market Structure & Innovation Trends
The APAC road freight market is characterized by a mix of large multinational corporations and smaller regional players. Market concentration is moderate, with the top five players – A P Moller - Maersk, Nippon Express Holdings, DHL Group, Rhenus Group, and Kintetsu Group Holdings Co Ltd – holding an estimated xx% market share in 2025. However, the market remains fragmented, particularly in developing economies. Innovation is driven by the need for greater efficiency, sustainability, and technological integration. Regulatory frameworks vary across countries, impacting operational costs and compliance. Product substitutes, such as rail and air freight, exert competitive pressure, particularly for long-haul routes. End-user demographics are diverse, with significant contributions from manufacturing, wholesale & retail, and construction sectors. M&A activity has been significant in recent years, with deal values exceeding $xx Million in the last five years, primarily focused on expanding geographic reach and service offerings.
- Market Leaders (2025 Est.): A P Moller - Maersk, Nippon Express Holdings, DHL Group, Rhenus Group, Kintetsu Group Holdings Co Ltd
- M&A Activity (2019-2024): Total deal value exceeding $xx Million
- Key Innovation Drivers: Digitalization, automation, sustainable transportation solutions.
APAC Road Freight Industry Market Dynamics & Trends
The APAC road freight market is experiencing robust growth, driven by factors including increasing e-commerce penetration, expanding manufacturing activities, and growing intra-regional trade. The market exhibits a Compound Annual Growth Rate (CAGR) of xx% during the forecast period (2025-2033). Technological disruptions, such as the adoption of telematics, GPS tracking, and route optimization software, are significantly improving efficiency and reducing operational costs. Consumer preferences are increasingly shifting towards faster and more reliable delivery options, fueling demand for express and specialized freight services. The competitive landscape is characterized by intense rivalry among established players and the emergence of new entrants, leading to pricing pressure and a focus on differentiation through service quality and technology. Market penetration of technological solutions is accelerating at a rate of xx% annually, further fueling the growth.
Dominant Regions & Segments in APAC Road Freight Industry
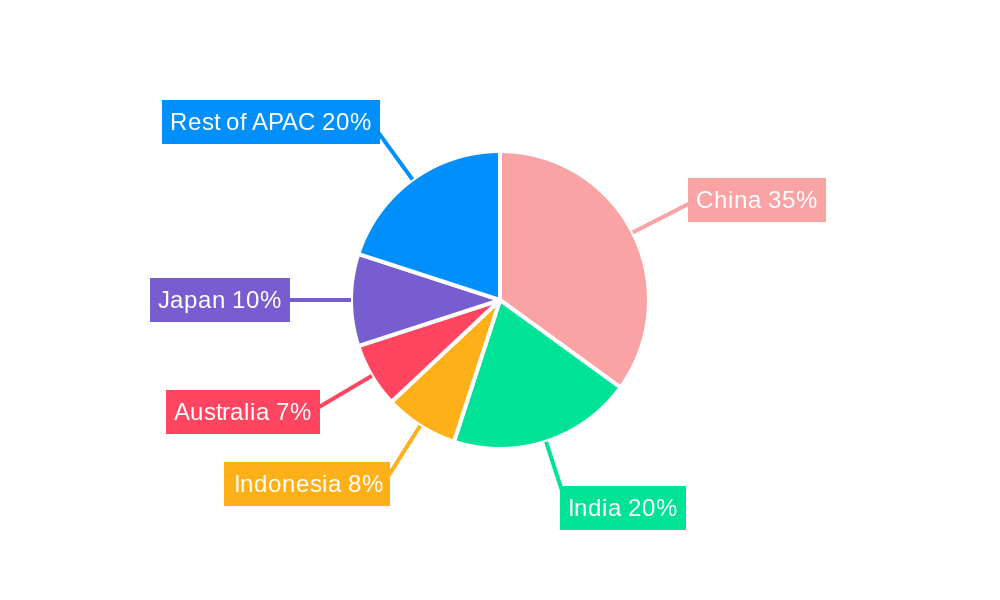
China remains the dominant market within the APAC region, accounting for approximately xx% of the total market value in 2025. This is primarily due to its massive manufacturing base, robust infrastructure, and high economic activity. Other key markets include India, Japan, and Southeast Asian countries (Indonesia, Thailand, Vietnam, Malaysia).
- Dominant Region: China
- Leading Segments:
- Distance: Short Haul (higher volume, more fragmented)
- Goods Configuration: Solid Goods (higher value, more diverse)
- Temperature Control: Non-Temperature Controlled (larger market share)
- End-User Industry: Manufacturing (largest volume), Wholesale and Retail Trade
- Destination: Domestic (larger market share than international)
- Truckload Specification: Less than Truckload (LTL) (higher volume)
- Containerization: Non-Containerized (larger volume)
Key drivers for the dominance of specific segments include: favorable economic policies, growing e-commerce, industrial expansion, and infrastructure development in specific countries. The dominance of China is further reinforced by government initiatives supporting logistics infrastructure development and promoting economic growth.
APAC Road Freight Industry Product Innovations
Recent product innovations focus on enhancing efficiency, sustainability, and safety. This includes the integration of telematics and IoT devices for real-time tracking and management, the adoption of electric and alternative fuel vehicles to reduce carbon emissions, and the development of advanced driver-assistance systems (ADAS) to improve safety. These innovations are improving service quality, optimizing logistics, reducing costs, and fostering environmental responsibility, aligning with market demands for a more sustainable and efficient supply chain.
Report Scope & Segmentation Analysis
This report segments the APAC road freight market by distance (long haul, short haul), goods configuration (fluid, solid), temperature control (temperature controlled, non-temperature controlled), country (Australia, China, India, Indonesia, Japan, Malaysia, Thailand, Vietnam, Rest of Asia Pacific), end-user industry (Agriculture, Fishing, and Forestry, Construction, Manufacturing, Oil and Gas, Mining and Quarrying, Wholesale and Retail Trade, Others), destination (domestic, international), truckload specification (FTL, LTL), and containerization (containerized, non-containerized). Each segment's growth projections, market size, and competitive dynamics are analyzed in detail. For example, the LTL segment is expected to exhibit a CAGR of xx% due to the growth of e-commerce, while the temperature-controlled segment will see xx% CAGR due to the increasing demand for perishable goods.
Key Drivers of APAC Road Freight Industry Growth
Growth in the APAC road freight industry is propelled by several key factors: expanding e-commerce, increasing manufacturing output, infrastructure development (especially in Southeast Asia), supportive government policies promoting logistics efficiency, and the rising adoption of technology for route optimization and fleet management. The continuous expansion of the middle class and rising disposable incomes further contribute to the sector's growth, driving demand for faster and more reliable delivery services.
Challenges in the APAP Road Freight Industry Sector
The APAC road freight industry faces several challenges, including: stringent regulatory compliance requirements across diverse jurisdictions, infrastructure limitations (particularly road congestion in major cities), driver shortages, rising fuel costs, and intense competition. These factors collectively contribute to increased operational costs and pressure on profit margins. For instance, driver shortages are estimated to impact xx% of delivery schedules annually, resulting in significant delays and increased expenses.
Emerging Opportunities in APAC Road Freight Industry
Emerging opportunities include the growth of last-mile delivery solutions, increased demand for specialized transportation services (e.g., temperature-controlled), adoption of sustainable transportation technologies (electric vehicles, alternative fuels), and the expansion into underserved markets within the region. These trends present significant potential for growth and innovation within the APAC road freight industry. The rise of cross-border e-commerce also presents a major opportunity.
Leading Players in the APAC Road Freight Industry Market
- A P Moller - Maersk
- Nippon Express Holdings
- DHL Group
- Rhenus Group
- Kintetsu Group Holdings Co Ltd
- C H Robinson
- Expeditors International of Washington Inc
- CMA CGM Group
Key Developments in APAC Road Freight Industry
- January 2024: DHL Express deploys a final Boeing 777 freighter at its South Asia Hub, significantly boosting inter-continental connectivity. This strengthens DHL's position in the international express shipping market.
- November 2023: DHL Express launches its expanded Central Asia Hub in Hong Kong, representing a EUR 562 Million investment – the largest by DHL in APAC – highlighting the growing importance of the region.
- October 2023: Volvo, Renault, and CMA CGM form a joint venture to develop electric vans, showcasing a significant move towards sustainable transportation within the logistics sector.
Future Outlook for APAC Road Freight Industry Market
The APAC road freight market is poised for continued strong growth, driven by sustained economic expansion, e-commerce growth, technological advancements, and infrastructure development. Strategic opportunities exist for companies that can leverage technology to enhance efficiency, adopt sustainable practices, and offer innovative solutions to meet evolving customer needs. The focus on digitalization and sustainability will be crucial for future success in this competitive market.
APAC Road Freight Industry Segmentation
-
1. End User Industry
- 1.1. Agriculture, Fishing, and Forestry
- 1.2. Construction
- 1.3. Manufacturing
- 1.4. Oil and Gas, Mining and Quarrying
- 1.5. Wholesale and Retail Trade
- 1.6. Others
-
2. Destination
- 2.1. Domestic
- 2.2. International
-
3. Truckload Specification
- 3.1. Full-Truck-Load (FTL)
- 3.2. Less than-Truck-Load (LTL)
-
4. Containerization
- 4.1. Containerized
- 4.2. Non-Containerized
-
5. Distance
- 5.1. Long Haul
- 5.2. Short Haul
-
6. Goods Configuration
- 6.1. Fluid Goods
- 6.2. Solid Goods
-
7. Temperature Control
- 7.1. Non-Temperature Controlled
APAC Road Freight Industry Segmentation By Geography
-
1. North America
- 1.1. United States
- 1.2. Canada
- 1.3. Mexico
-
2. South America
- 2.1. Brazil
- 2.2. Argentina
- 2.3. Rest of South America
-
3. Europe
- 3.1. United Kingdom
- 3.2. Germany
- 3.3. France
- 3.4. Italy
- 3.5. Spain
- 3.6. Russia
- 3.7. Benelux
- 3.8. Nordics
- 3.9. Rest of Europe
-
4. Middle East & Africa
- 4.1. Turkey
- 4.2. Israel
- 4.3. GCC
- 4.4. North Africa
- 4.5. South Africa
- 4.6. Rest of Middle East & Africa
-
5. Asia Pacific
- 5.1. China
- 5.2. India
- 5.3. Japan
- 5.4. South Korea
- 5.5. ASEAN
- 5.6. Oceania
- 5.7. Rest of Asia Pacific
APAC Road Freight Industry Regional Market Share
Geographic Coverage of APAC Road Freight Industry
APAC Road Freight Industry REPORT HIGHLIGHTS
| Aspects | Details |
|---|---|
| Study Period | 2020-2034 |
| Base Year | 2025 |
| Estimated Year | 2026 |
| Forecast Period | 2026-2034 |
| Historical Period | 2020-2025 |
| Growth Rate | CAGR of 5.3% from 2020-2034 |
| Segmentation |
|
Table of Contents
- 1. Introduction
- 1.1. Research Scope
- 1.2. Market Segmentation
- 1.3. Research Objective
- 1.4. Definitions and Assumptions
- 2. Executive Summary
- 2.1. Market Snapshot
- 3. Market Dynamics
- 3.1. Market Drivers
- 3.2. Market Restrains
- 3.3. Market Trends
- 3.4. Market Opportunities
- 4. Market Factor Analysis
- 4.1. Porters Five Forces
- 4.1.1. Bargaining Power of Suppliers
- 4.1.2. Bargaining Power of Buyers
- 4.1.3. Threat of New Entrants
- 4.1.4. Threat of Substitutes
- 4.1.5. Competitive Rivalry
- 4.2. PESTEL analysis
- 4.3. BCG Analysis
- 4.3.1. Stars (High Growth, High Market Share)
- 4.3.2. Cash Cows (Low Growth, High Market Share)
- 4.3.3. Question Mark (High Growth, Low Market Share)
- 4.3.4. Dogs (Low Growth, Low Market Share)
- 4.4. Ansoff Matrix Analysis
- 4.5. Supply Chain Analysis
- 4.6. Regulatory Landscape
- 4.7. Current Market Potential and Opportunity Assessment (TAM–SAM–SOM Framework)
- 4.8. PRI Analyst Note
- 4.1. Porters Five Forces
- 5. Market Analysis, Insights and Forecast 2021-2033
- 5.1. Market Analysis, Insights and Forecast - by End User Industry
- 5.1.1. Agriculture, Fishing, and Forestry
- 5.1.2. Construction
- 5.1.3. Manufacturing
- 5.1.4. Oil and Gas, Mining and Quarrying
- 5.1.5. Wholesale and Retail Trade
- 5.1.6. Others
- 5.2. Market Analysis, Insights and Forecast - by Destination
- 5.2.1. Domestic
- 5.2.2. International
- 5.3. Market Analysis, Insights and Forecast - by Truckload Specification
- 5.3.1. Full-Truck-Load (FTL)
- 5.3.2. Less than-Truck-Load (LTL)
- 5.4. Market Analysis, Insights and Forecast - by Containerization
- 5.4.1. Containerized
- 5.4.2. Non-Containerized
- 5.5. Market Analysis, Insights and Forecast - by Distance
- 5.5.1. Long Haul
- 5.5.2. Short Haul
- 5.6. Market Analysis, Insights and Forecast - by Goods Configuration
- 5.6.1. Fluid Goods
- 5.6.2. Solid Goods
- 5.7. Market Analysis, Insights and Forecast - by Temperature Control
- 5.7.1. Non-Temperature Controlled
- 5.8. Market Analysis, Insights and Forecast - by Region
- 5.8.1. North America
- 5.8.2. South America
- 5.8.3. Europe
- 5.8.4. Middle East & Africa
- 5.8.5. Asia Pacific
- 5.1. Market Analysis, Insights and Forecast - by End User Industry
- 6. Global APAC Road Freight Industry Analysis, Insights and Forecast, 2021-2033
- 6.1. Market Analysis, Insights and Forecast - by End User Industry
- 6.1.1. Agriculture, Fishing, and Forestry
- 6.1.2. Construction
- 6.1.3. Manufacturing
- 6.1.4. Oil and Gas, Mining and Quarrying
- 6.1.5. Wholesale and Retail Trade
- 6.1.6. Others
- 6.2. Market Analysis, Insights and Forecast - by Destination
- 6.2.1. Domestic
- 6.2.2. International
- 6.3. Market Analysis, Insights and Forecast - by Truckload Specification
- 6.3.1. Full-Truck-Load (FTL)
- 6.3.2. Less than-Truck-Load (LTL)
- 6.4. Market Analysis, Insights and Forecast - by Containerization
- 6.4.1. Containerized
- 6.4.2. Non-Containerized
- 6.5. Market Analysis, Insights and Forecast - by Distance
- 6.5.1. Long Haul
- 6.5.2. Short Haul
- 6.6. Market Analysis, Insights and Forecast - by Goods Configuration
- 6.6.1. Fluid Goods
- 6.6.2. Solid Goods
- 6.7. Market Analysis, Insights and Forecast - by Temperature Control
- 6.7.1. Non-Temperature Controlled
- 6.1. Market Analysis, Insights and Forecast - by End User Industry
- 7. North America APAC Road Freight Industry Analysis, Insights and Forecast, 2020-2032
- 7.1. Market Analysis, Insights and Forecast - by End User Industry
- 7.1.1. Agriculture, Fishing, and Forestry
- 7.1.2. Construction
- 7.1.3. Manufacturing
- 7.1.4. Oil and Gas, Mining and Quarrying
- 7.1.5. Wholesale and Retail Trade
- 7.1.6. Others
- 7.2. Market Analysis, Insights and Forecast - by Destination
- 7.2.1. Domestic
- 7.2.2. International
- 7.3. Market Analysis, Insights and Forecast - by Truckload Specification
- 7.3.1. Full-Truck-Load (FTL)
- 7.3.2. Less than-Truck-Load (LTL)
- 7.4. Market Analysis, Insights and Forecast - by Containerization
- 7.4.1. Containerized
- 7.4.2. Non-Containerized
- 7.5. Market Analysis, Insights and Forecast - by Distance
- 7.5.1. Long Haul
- 7.5.2. Short Haul
- 7.6. Market Analysis, Insights and Forecast - by Goods Configuration
- 7.6.1. Fluid Goods
- 7.6.2. Solid Goods
- 7.7. Market Analysis, Insights and Forecast - by Temperature Control
- 7.7.1. Non-Temperature Controlled
- 7.1. Market Analysis, Insights and Forecast - by End User Industry
- 8. South America APAC Road Freight Industry Analysis, Insights and Forecast, 2020-2032
- 8.1. Market Analysis, Insights and Forecast - by End User Industry
- 8.1.1. Agriculture, Fishing, and Forestry
- 8.1.2. Construction
- 8.1.3. Manufacturing
- 8.1.4. Oil and Gas, Mining and Quarrying
- 8.1.5. Wholesale and Retail Trade
- 8.1.6. Others
- 8.2. Market Analysis, Insights and Forecast - by Destination
- 8.2.1. Domestic
- 8.2.2. International
- 8.3. Market Analysis, Insights and Forecast - by Truckload Specification
- 8.3.1. Full-Truck-Load (FTL)
- 8.3.2. Less than-Truck-Load (LTL)
- 8.4. Market Analysis, Insights and Forecast - by Containerization
- 8.4.1. Containerized
- 8.4.2. Non-Containerized
- 8.5. Market Analysis, Insights and Forecast - by Distance
- 8.5.1. Long Haul
- 8.5.2. Short Haul
- 8.6. Market Analysis, Insights and Forecast - by Goods Configuration
- 8.6.1. Fluid Goods
- 8.6.2. Solid Goods
- 8.7. Market Analysis, Insights and Forecast - by Temperature Control
- 8.7.1. Non-Temperature Controlled
- 8.1. Market Analysis, Insights and Forecast - by End User Industry
- 9. Europe APAC Road Freight Industry Analysis, Insights and Forecast, 2020-2032
- 9.1. Market Analysis, Insights and Forecast - by End User Industry
- 9.1.1. Agriculture, Fishing, and Forestry
- 9.1.2. Construction
- 9.1.3. Manufacturing
- 9.1.4. Oil and Gas, Mining and Quarrying
- 9.1.5. Wholesale and Retail Trade
- 9.1.6. Others
- 9.2. Market Analysis, Insights and Forecast - by Destination
- 9.2.1. Domestic
- 9.2.2. International
- 9.3. Market Analysis, Insights and Forecast - by Truckload Specification
- 9.3.1. Full-Truck-Load (FTL)
- 9.3.2. Less than-Truck-Load (LTL)
- 9.4. Market Analysis, Insights and Forecast - by Containerization
- 9.4.1. Containerized
- 9.4.2. Non-Containerized
- 9.5. Market Analysis, Insights and Forecast - by Distance
- 9.5.1. Long Haul
- 9.5.2. Short Haul
- 9.6. Market Analysis, Insights and Forecast - by Goods Configuration
- 9.6.1. Fluid Goods
- 9.6.2. Solid Goods
- 9.7. Market Analysis, Insights and Forecast - by Temperature Control
- 9.7.1. Non-Temperature Controlled
- 9.1. Market Analysis, Insights and Forecast - by End User Industry
- 10. Middle East & Africa APAC Road Freight Industry Analysis, Insights and Forecast, 2020-2032
- 10.1. Market Analysis, Insights and Forecast - by End User Industry
- 10.1.1. Agriculture, Fishing, and Forestry
- 10.1.2. Construction
- 10.1.3. Manufacturing
- 10.1.4. Oil and Gas, Mining and Quarrying
- 10.1.5. Wholesale and Retail Trade
- 10.1.6. Others
- 10.2. Market Analysis, Insights and Forecast - by Destination
- 10.2.1. Domestic
- 10.2.2. International
- 10.3. Market Analysis, Insights and Forecast - by Truckload Specification
- 10.3.1. Full-Truck-Load (FTL)
- 10.3.2. Less than-Truck-Load (LTL)
- 10.4. Market Analysis, Insights and Forecast - by Containerization
- 10.4.1. Containerized
- 10.4.2. Non-Containerized
- 10.5. Market Analysis, Insights and Forecast - by Distance
- 10.5.1. Long Haul
- 10.5.2. Short Haul
- 10.6. Market Analysis, Insights and Forecast - by Goods Configuration
- 10.6.1. Fluid Goods
- 10.6.2. Solid Goods
- 10.7. Market Analysis, Insights and Forecast - by Temperature Control
- 10.7.1. Non-Temperature Controlled
- 10.1. Market Analysis, Insights and Forecast - by End User Industry
- 11. Asia Pacific APAC Road Freight Industry Analysis, Insights and Forecast, 2020-2032
- 11.1. Market Analysis, Insights and Forecast - by End User Industry
- 11.1.1. Agriculture, Fishing, and Forestry
- 11.1.2. Construction
- 11.1.3. Manufacturing
- 11.1.4. Oil and Gas, Mining and Quarrying
- 11.1.5. Wholesale and Retail Trade
- 11.1.6. Others
- 11.2. Market Analysis, Insights and Forecast - by Destination
- 11.2.1. Domestic
- 11.2.2. International
- 11.3. Market Analysis, Insights and Forecast - by Truckload Specification
- 11.3.1. Full-Truck-Load (FTL)
- 11.3.2. Less than-Truck-Load (LTL)
- 11.4. Market Analysis, Insights and Forecast - by Containerization
- 11.4.1. Containerized
- 11.4.2. Non-Containerized
- 11.5. Market Analysis, Insights and Forecast - by Distance
- 11.5.1. Long Haul
- 11.5.2. Short Haul
- 11.6. Market Analysis, Insights and Forecast - by Goods Configuration
- 11.6.1. Fluid Goods
- 11.6.2. Solid Goods
- 11.7. Market Analysis, Insights and Forecast - by Temperature Control
- 11.7.1. Non-Temperature Controlled
- 11.1. Market Analysis, Insights and Forecast - by End User Industry
- 12. Competitive Analysis
- 12.1. Company Profiles
- 12.1.1 A P Moller - Maersk
- 12.1.1.1. Company Overview
- 12.1.1.2. Products
- 12.1.1.3. Company Financials
- 12.1.1.4. SWOT Analysis
- 12.1.2 Nippon Express Holdings
- 12.1.2.1. Company Overview
- 12.1.2.2. Products
- 12.1.2.3. Company Financials
- 12.1.2.4. SWOT Analysis
- 12.1.3 DHL Group
- 12.1.3.1. Company Overview
- 12.1.3.2. Products
- 12.1.3.3. Company Financials
- 12.1.3.4. SWOT Analysis
- 12.1.4 Rhenus Grou
- 12.1.4.1. Company Overview
- 12.1.4.2. Products
- 12.1.4.3. Company Financials
- 12.1.4.4. SWOT Analysis
- 12.1.5 Kintetsu Group Holdings Co Ltd
- 12.1.5.1. Company Overview
- 12.1.5.2. Products
- 12.1.5.3. Company Financials
- 12.1.5.4. SWOT Analysis
- 12.1.6 C H Robinson
- 12.1.6.1. Company Overview
- 12.1.6.2. Products
- 12.1.6.3. Company Financials
- 12.1.6.4. SWOT Analysis
- 12.1.7 Expeditors International of Washington Inc
- 12.1.7.1. Company Overview
- 12.1.7.2. Products
- 12.1.7.3. Company Financials
- 12.1.7.4. SWOT Analysis
- 12.1.8 CMA CGM Group
- 12.1.8.1. Company Overview
- 12.1.8.2. Products
- 12.1.8.3. Company Financials
- 12.1.8.4. SWOT Analysis
- 12.1.1 A P Moller - Maersk
- 12.2. Market Entropy
- 12.2.1 Company's Key Areas Served
- 12.2.2 Recent Developments
- 12.3. Company Market Share Analysis 2025
- 12.3.1 Top 5 Companies Market Share Analysis
- 12.3.2 Top 3 Companies Market Share Analysis
- 12.4. List of Potential Customers
- 13. Research Methodology
List of Figures
- Figure 1: Global APAC Road Freight Industry Revenue Breakdown (million, %) by Region 2025 & 2033
- Figure 2: North America APAC Road Freight Industry Revenue (million), by End User Industry 2025 & 2033
- Figure 3: North America APAC Road Freight Industry Revenue Share (%), by End User Industry 2025 & 2033
- Figure 4: North America APAC Road Freight Industry Revenue (million), by Destination 2025 & 2033
- Figure 5: North America APAC Road Freight Industry Revenue Share (%), by Destination 2025 & 2033
- Figure 6: North America APAC Road Freight Industry Revenue (million), by Truckload Specification 2025 & 2033
- Figure 7: North America APAC Road Freight Industry Revenue Share (%), by Truckload Specification 2025 & 2033
- Figure 8: North America APAC Road Freight Industry Revenue (million), by Containerization 2025 & 2033
- Figure 9: North America APAC Road Freight Industry Revenue Share (%), by Containerization 2025 & 2033
- Figure 10: North America APAC Road Freight Industry Revenue (million), by Distance 2025 & 2033
- Figure 11: North America APAC Road Freight Industry Revenue Share (%), by Distance 2025 & 2033
- Figure 12: North America APAC Road Freight Industry Revenue (million), by Goods Configuration 2025 & 2033
- Figure 13: North America APAC Road Freight Industry Revenue Share (%), by Goods Configuration 2025 & 2033
- Figure 14: North America APAC Road Freight Industry Revenue (million), by Temperature Control 2025 & 2033
- Figure 15: North America APAC Road Freight Industry Revenue Share (%), by Temperature Control 2025 & 2033
- Figure 16: North America APAC Road Freight Industry Revenue (million), by Country 2025 & 2033
- Figure 17: North America APAC Road Freight Industry Revenue Share (%), by Country 2025 & 2033
- Figure 18: South America APAC Road Freight Industry Revenue (million), by End User Industry 2025 & 2033
- Figure 19: South America APAC Road Freight Industry Revenue Share (%), by End User Industry 2025 & 2033
- Figure 20: South America APAC Road Freight Industry Revenue (million), by Destination 2025 & 2033
- Figure 21: South America APAC Road Freight Industry Revenue Share (%), by Destination 2025 & 2033
- Figure 22: South America APAC Road Freight Industry Revenue (million), by Truckload Specification 2025 & 2033
- Figure 23: South America APAC Road Freight Industry Revenue Share (%), by Truckload Specification 2025 & 2033
- Figure 24: South America APAC Road Freight Industry Revenue (million), by Containerization 2025 & 2033
- Figure 25: South America APAC Road Freight Industry Revenue Share (%), by Containerization 2025 & 2033
- Figure 26: South America APAC Road Freight Industry Revenue (million), by Distance 2025 & 2033
- Figure 27: South America APAC Road Freight Industry Revenue Share (%), by Distance 2025 & 2033
- Figure 28: South America APAC Road Freight Industry Revenue (million), by Goods Configuration 2025 & 2033
- Figure 29: South America APAC Road Freight Industry Revenue Share (%), by Goods Configuration 2025 & 2033
- Figure 30: South America APAC Road Freight Industry Revenue (million), by Temperature Control 2025 & 2033
- Figure 31: South America APAC Road Freight Industry Revenue Share (%), by Temperature Control 2025 & 2033
- Figure 32: South America APAC Road Freight Industry Revenue (million), by Country 2025 & 2033
- Figure 33: South America APAC Road Freight Industry Revenue Share (%), by Country 2025 & 2033
- Figure 34: Europe APAC Road Freight Industry Revenue (million), by End User Industry 2025 & 2033
- Figure 35: Europe APAC Road Freight Industry Revenue Share (%), by End User Industry 2025 & 2033
- Figure 36: Europe APAC Road Freight Industry Revenue (million), by Destination 2025 & 2033
- Figure 37: Europe APAC Road Freight Industry Revenue Share (%), by Destination 2025 & 2033
- Figure 38: Europe APAC Road Freight Industry Revenue (million), by Truckload Specification 2025 & 2033
- Figure 39: Europe APAC Road Freight Industry Revenue Share (%), by Truckload Specification 2025 & 2033
- Figure 40: Europe APAC Road Freight Industry Revenue (million), by Containerization 2025 & 2033
- Figure 41: Europe APAC Road Freight Industry Revenue Share (%), by Containerization 2025 & 2033
- Figure 42: Europe APAC Road Freight Industry Revenue (million), by Distance 2025 & 2033
- Figure 43: Europe APAC Road Freight Industry Revenue Share (%), by Distance 2025 & 2033
- Figure 44: Europe APAC Road Freight Industry Revenue (million), by Goods Configuration 2025 & 2033
- Figure 45: Europe APAC Road Freight Industry Revenue Share (%), by Goods Configuration 2025 & 2033
- Figure 46: Europe APAC Road Freight Industry Revenue (million), by Temperature Control 2025 & 2033
- Figure 47: Europe APAC Road Freight Industry Revenue Share (%), by Temperature Control 2025 & 2033
- Figure 48: Europe APAC Road Freight Industry Revenue (million), by Country 2025 & 2033
- Figure 49: Europe APAC Road Freight Industry Revenue Share (%), by Country 2025 & 2033
- Figure 50: Middle East & Africa APAC Road Freight Industry Revenue (million), by End User Industry 2025 & 2033
- Figure 51: Middle East & Africa APAC Road Freight Industry Revenue Share (%), by End User Industry 2025 & 2033
- Figure 52: Middle East & Africa APAC Road Freight Industry Revenue (million), by Destination 2025 & 2033
- Figure 53: Middle East & Africa APAC Road Freight Industry Revenue Share (%), by Destination 2025 & 2033
- Figure 54: Middle East & Africa APAC Road Freight Industry Revenue (million), by Truckload Specification 2025 & 2033
- Figure 55: Middle East & Africa APAC Road Freight Industry Revenue Share (%), by Truckload Specification 2025 & 2033
- Figure 56: Middle East & Africa APAC Road Freight Industry Revenue (million), by Containerization 2025 & 2033
- Figure 57: Middle East & Africa APAC Road Freight Industry Revenue Share (%), by Containerization 2025 & 2033
- Figure 58: Middle East & Africa APAC Road Freight Industry Revenue (million), by Distance 2025 & 2033
- Figure 59: Middle East & Africa APAC Road Freight Industry Revenue Share (%), by Distance 2025 & 2033
- Figure 60: Middle East & Africa APAC Road Freight Industry Revenue (million), by Goods Configuration 2025 & 2033
- Figure 61: Middle East & Africa APAC Road Freight Industry Revenue Share (%), by Goods Configuration 2025 & 2033
- Figure 62: Middle East & Africa APAC Road Freight Industry Revenue (million), by Temperature Control 2025 & 2033
- Figure 63: Middle East & Africa APAC Road Freight Industry Revenue Share (%), by Temperature Control 2025 & 2033
- Figure 64: Middle East & Africa APAC Road Freight Industry Revenue (million), by Country 2025 & 2033
- Figure 65: Middle East & Africa APAC Road Freight Industry Revenue Share (%), by Country 2025 & 2033
- Figure 66: Asia Pacific APAC Road Freight Industry Revenue (million), by End User Industry 2025 & 2033
- Figure 67: Asia Pacific APAC Road Freight Industry Revenue Share (%), by End User Industry 2025 & 2033
- Figure 68: Asia Pacific APAC Road Freight Industry Revenue (million), by Destination 2025 & 2033
- Figure 69: Asia Pacific APAC Road Freight Industry Revenue Share (%), by Destination 2025 & 2033
- Figure 70: Asia Pacific APAC Road Freight Industry Revenue (million), by Truckload Specification 2025 & 2033
- Figure 71: Asia Pacific APAC Road Freight Industry Revenue Share (%), by Truckload Specification 2025 & 2033
- Figure 72: Asia Pacific APAC Road Freight Industry Revenue (million), by Containerization 2025 & 2033
- Figure 73: Asia Pacific APAC Road Freight Industry Revenue Share (%), by Containerization 2025 & 2033
- Figure 74: Asia Pacific APAC Road Freight Industry Revenue (million), by Distance 2025 & 2033
- Figure 75: Asia Pacific APAC Road Freight Industry Revenue Share (%), by Distance 2025 & 2033
- Figure 76: Asia Pacific APAC Road Freight Industry Revenue (million), by Goods Configuration 2025 & 2033
- Figure 77: Asia Pacific APAC Road Freight Industry Revenue Share (%), by Goods Configuration 2025 & 2033
- Figure 78: Asia Pacific APAC Road Freight Industry Revenue (million), by Temperature Control 2025 & 2033
- Figure 79: Asia Pacific APAC Road Freight Industry Revenue Share (%), by Temperature Control 2025 & 2033
- Figure 80: Asia Pacific APAC Road Freight Industry Revenue (million), by Country 2025 & 2033
- Figure 81: Asia Pacific APAC Road Freight Industry Revenue Share (%), by Country 2025 & 2033
List of Tables
- Table 1: Global APAC Road Freight Industry Revenue million Forecast, by End User Industry 2020 & 2033
- Table 2: Global APAC Road Freight Industry Revenue million Forecast, by Destination 2020 & 2033
- Table 3: Global APAC Road Freight Industry Revenue million Forecast, by Truckload Specification 2020 & 2033
- Table 4: Global APAC Road Freight Industry Revenue million Forecast, by Containerization 2020 & 2033
- Table 5: Global APAC Road Freight Industry Revenue million Forecast, by Distance 2020 & 2033
- Table 6: Global APAC Road Freight Industry Revenue million Forecast, by Goods Configuration 2020 & 2033
- Table 7: Global APAC Road Freight Industry Revenue million Forecast, by Temperature Control 2020 & 2033
- Table 8: Global APAC Road Freight Industry Revenue million Forecast, by Region 2020 & 2033
- Table 9: Global APAC Road Freight Industry Revenue million Forecast, by End User Industry 2020 & 2033
- Table 10: Global APAC Road Freight Industry Revenue million Forecast, by Destination 2020 & 2033
- Table 11: Global APAC Road Freight Industry Revenue million Forecast, by Truckload Specification 2020 & 2033
- Table 12: Global APAC Road Freight Industry Revenue million Forecast, by Containerization 2020 & 2033
- Table 13: Global APAC Road Freight Industry Revenue million Forecast, by Distance 2020 & 2033
- Table 14: Global APAC Road Freight Industry Revenue million Forecast, by Goods Configuration 2020 & 2033
- Table 15: Global APAC Road Freight Industry Revenue million Forecast, by Temperature Control 2020 & 2033
- Table 16: Global APAC Road Freight Industry Revenue million Forecast, by Country 2020 & 2033
- Table 17: United States APAC Road Freight Industry Revenue (million) Forecast, by Application 2020 & 2033
- Table 18: Canada APAC Road Freight Industry Revenue (million) Forecast, by Application 2020 & 2033
- Table 19: Mexico APAC Road Freight Industry Revenue (million) Forecast, by Application 2020 & 2033
- Table 20: Global APAC Road Freight Industry Revenue million Forecast, by End User Industry 2020 & 2033
- Table 21: Global APAC Road Freight Industry Revenue million Forecast, by Destination 2020 & 2033
- Table 22: Global APAC Road Freight Industry Revenue million Forecast, by Truckload Specification 2020 & 2033
- Table 23: Global APAC Road Freight Industry Revenue million Forecast, by Containerization 2020 & 2033
- Table 24: Global APAC Road Freight Industry Revenue million Forecast, by Distance 2020 & 2033
- Table 25: Global APAC Road Freight Industry Revenue million Forecast, by Goods Configuration 2020 & 2033
- Table 26: Global APAC Road Freight Industry Revenue million Forecast, by Temperature Control 2020 & 2033
- Table 27: Global APAC Road Freight Industry Revenue million Forecast, by Country 2020 & 2033
- Table 28: Brazil APAC Road Freight Industry Revenue (million) Forecast, by Application 2020 & 2033
- Table 29: Argentina APAC Road Freight Industry Revenue (million) Forecast, by Application 2020 & 2033
- Table 30: Rest of South America APAC Road Freight Industry Revenue (million) Forecast, by Application 2020 & 2033
- Table 31: Global APAC Road Freight Industry Revenue million Forecast, by End User Industry 2020 & 2033
- Table 32: Global APAC Road Freight Industry Revenue million Forecast, by Destination 2020 & 2033
- Table 33: Global APAC Road Freight Industry Revenue million Forecast, by Truckload Specification 2020 & 2033
- Table 34: Global APAC Road Freight Industry Revenue million Forecast, by Containerization 2020 & 2033
- Table 35: Global APAC Road Freight Industry Revenue million Forecast, by Distance 2020 & 2033
- Table 36: Global APAC Road Freight Industry Revenue million Forecast, by Goods Configuration 2020 & 2033
- Table 37: Global APAC Road Freight Industry Revenue million Forecast, by Temperature Control 2020 & 2033
- Table 38: Global APAC Road Freight Industry Revenue million Forecast, by Country 2020 & 2033
- Table 39: United Kingdom APAC Road Freight Industry Revenue (million) Forecast, by Application 2020 & 2033
- Table 40: Germany APAC Road Freight Industry Revenue (million) Forecast, by Application 2020 & 2033
- Table 41: France APAC Road Freight Industry Revenue (million) Forecast, by Application 2020 & 2033
- Table 42: Italy APAC Road Freight Industry Revenue (million) Forecast, by Application 2020 & 2033
- Table 43: Spain APAC Road Freight Industry Revenue (million) Forecast, by Application 2020 & 2033
- Table 44: Russia APAC Road Freight Industry Revenue (million) Forecast, by Application 2020 & 2033
- Table 45: Benelux APAC Road Freight Industry Revenue (million) Forecast, by Application 2020 & 2033
- Table 46: Nordics APAC Road Freight Industry Revenue (million) Forecast, by Application 2020 & 2033
- Table 47: Rest of Europe APAC Road Freight Industry Revenue (million) Forecast, by Application 2020 & 2033
- Table 48: Global APAC Road Freight Industry Revenue million Forecast, by End User Industry 2020 & 2033
- Table 49: Global APAC Road Freight Industry Revenue million Forecast, by Destination 2020 & 2033
- Table 50: Global APAC Road Freight Industry Revenue million Forecast, by Truckload Specification 2020 & 2033
- Table 51: Global APAC Road Freight Industry Revenue million Forecast, by Containerization 2020 & 2033
- Table 52: Global APAC Road Freight Industry Revenue million Forecast, by Distance 2020 & 2033
- Table 53: Global APAC Road Freight Industry Revenue million Forecast, by Goods Configuration 2020 & 2033
- Table 54: Global APAC Road Freight Industry Revenue million Forecast, by Temperature Control 2020 & 2033
- Table 55: Global APAC Road Freight Industry Revenue million Forecast, by Country 2020 & 2033
- Table 56: Turkey APAC Road Freight Industry Revenue (million) Forecast, by Application 2020 & 2033
- Table 57: Israel APAC Road Freight Industry Revenue (million) Forecast, by Application 2020 & 2033
- Table 58: GCC APAC Road Freight Industry Revenue (million) Forecast, by Application 2020 & 2033
- Table 59: North Africa APAC Road Freight Industry Revenue (million) Forecast, by Application 2020 & 2033
- Table 60: South Africa APAC Road Freight Industry Revenue (million) Forecast, by Application 2020 & 2033
- Table 61: Rest of Middle East & Africa APAC Road Freight Industry Revenue (million) Forecast, by Application 2020 & 2033
- Table 62: Global APAC Road Freight Industry Revenue million Forecast, by End User Industry 2020 & 2033
- Table 63: Global APAC Road Freight Industry Revenue million Forecast, by Destination 2020 & 2033
- Table 64: Global APAC Road Freight Industry Revenue million Forecast, by Truckload Specification 2020 & 2033
- Table 65: Global APAC Road Freight Industry Revenue million Forecast, by Containerization 2020 & 2033
- Table 66: Global APAC Road Freight Industry Revenue million Forecast, by Distance 2020 & 2033
- Table 67: Global APAC Road Freight Industry Revenue million Forecast, by Goods Configuration 2020 & 2033
- Table 68: Global APAC Road Freight Industry Revenue million Forecast, by Temperature Control 2020 & 2033
- Table 69: Global APAC Road Freight Industry Revenue million Forecast, by Country 2020 & 2033
- Table 70: China APAC Road Freight Industry Revenue (million) Forecast, by Application 2020 & 2033
- Table 71: India APAC Road Freight Industry Revenue (million) Forecast, by Application 2020 & 2033
- Table 72: Japan APAC Road Freight Industry Revenue (million) Forecast, by Application 2020 & 2033
- Table 73: South Korea APAC Road Freight Industry Revenue (million) Forecast, by Application 2020 & 2033
- Table 74: ASEAN APAC Road Freight Industry Revenue (million) Forecast, by Application 2020 & 2033
- Table 75: Oceania APAC Road Freight Industry Revenue (million) Forecast, by Application 2020 & 2033
- Table 76: Rest of Asia Pacific APAC Road Freight Industry Revenue (million) Forecast, by Application 2020 & 2033
Frequently Asked Questions
1. What is the projected Compound Annual Growth Rate (CAGR) of the APAC Road Freight Industry?
The projected CAGR is approximately 5.3%.
2. Which companies are prominent players in the APAC Road Freight Industry?
Key companies in the market include A P Moller - Maersk, Nippon Express Holdings, DHL Group, Rhenus Grou, Kintetsu Group Holdings Co Ltd, C H Robinson, Expeditors International of Washington Inc, CMA CGM Group.
3. What are the main segments of the APAC Road Freight Industry?
The market segments include End User Industry, Destination, Truckload Specification, Containerization, Distance, Goods Configuration, Temperature Control.
4. Can you provide details about the market size?
The market size is estimated to be USD 68827.8 million as of 2022.
5. What are some drivers contributing to market growth?
Growing trade relations; Increased demand for perishable goods.
6. What are the notable trends driving market growth?
OTHER KEY INDUSTRY TRENDS COVERED IN THE REPORT.
7. Are there any restraints impacting market growth?
Cargo theft; High cost of maintainig.
8. Can you provide examples of recent developments in the market?
January 2024: DHL Express has commenced services for the final Boeing 777 freighter deployed at the South Asia Hub in Singapore. With a payload capability of 102 tons, the aircraft joins the four other Boeing 777 freighters already deployed in Singapore to boost inter-continental connectivity between the Asia Pacific and the Americas. Sporting a dual DHL-Singapore Airlines (SIA) livery, these five freighters provide a total of 1,224 tons of payload capacity to meet growing customer demand for international express shipping services.November 2023: DHL Express has launched its state-of-the-art, expanded Central Asia Hub (CAH) in Hong Kong, amid fast-growing global trade in recent years. The total investment into the Central Asia Hub is EUR 562 million, making it the largest infrastructural investment by DHL Express in Asia Pacific. The Hub is one of three DHL Express global hubs connecting Asia Pacific with the rest of the world and also supports intra-Asia trade.October 2023: Truck and industrial equipment maker Volvo, auto maker Renault, and shipping giant CMA CGM unveiled a joint venture that would create a company aimed at developing a new series of electric vans. The partnership would provide electric urban transportation for companies in the logistics and transportation sector seeking to decarbonize their fleets.
9. What pricing options are available for accessing the report?
Pricing options include single-user, multi-user, and enterprise licenses priced at USD 3800, USD 4500, and USD 5800 respectively.
10. Is the market size provided in terms of value or volume?
The market size is provided in terms of value, measured in million.
11. Are there any specific market keywords associated with the report?
Yes, the market keyword associated with the report is "APAC Road Freight Industry," which aids in identifying and referencing the specific market segment covered.
12. How do I determine which pricing option suits my needs best?
The pricing options vary based on user requirements and access needs. Individual users may opt for single-user licenses, while businesses requiring broader access may choose multi-user or enterprise licenses for cost-effective access to the report.
13. Are there any additional resources or data provided in the APAC Road Freight Industry report?
While the report offers comprehensive insights, it's advisable to review the specific contents or supplementary materials provided to ascertain if additional resources or data are available.
14. How can I stay updated on further developments or reports in the APAC Road Freight Industry?
To stay informed about further developments, trends, and reports in the APAC Road Freight Industry, consider subscribing to industry newsletters, following relevant companies and organizations, or regularly checking reputable industry news sources and publications.
Methodology
Step 1 - Identification of Relevant Samples Size from Population Database


Step 2 - Approaches for Defining Global Market Size (Value, Volume* & Price*)

Note*: In applicable scenarios
Step 3 - Data Sources
Primary Research
- Web Analytics
- Survey Reports
- Research Institute
- Latest Research Reports
- Opinion Leaders
Secondary Research
- Annual Reports
- White Paper
- Latest Press Release
- Industry Association
- Paid Database
- Investor Presentations

Step 4 - Data Triangulation
Involves using different sources of information in order to increase the validity of a study
These sources are likely to be stakeholders in a program - participants, other researchers, program staff, other community members, and so on.
Then we put all data in single framework & apply various statistical tools to find out the dynamic on the market.
During the analysis stage, feedback from the stakeholder groups would be compared to determine areas of agreement as well as areas of divergence