

Key Insights
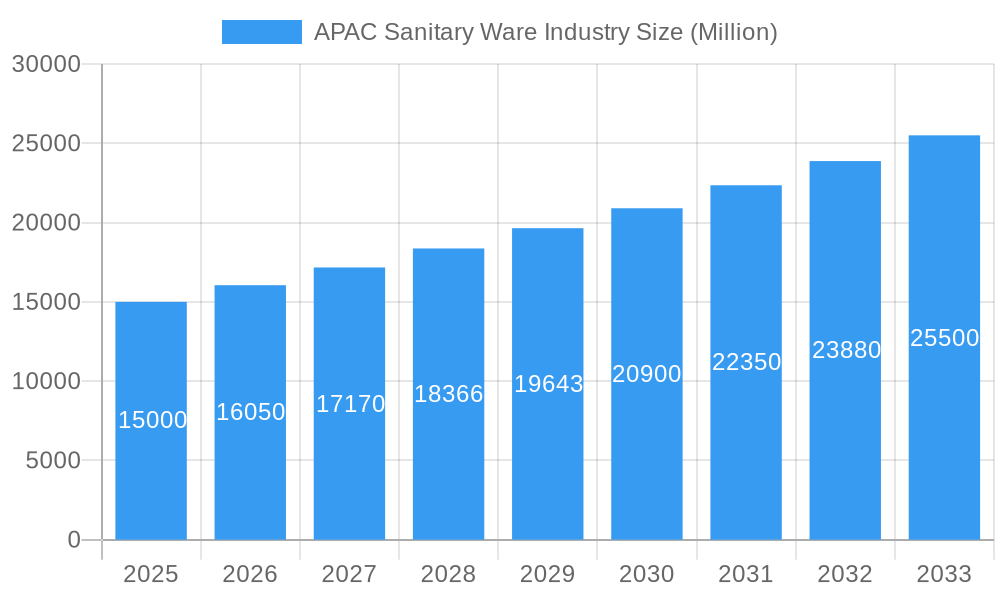
The Asia Pacific (APAC) sanitary ware market is exhibiting strong growth, propelled by increasing urbanization, rising disposable incomes, and a heightened emphasis on hygiene and sanitation. The expanding middle class is a key driver, prioritizing home upgrades with contemporary and visually appealing bathroom fixtures. Government-backed initiatives promoting affordable housing and infrastructure development in emerging APAC economies further contribute to market expansion. The market is projected to reach 32.47 billion by 2025, with a compound annual growth rate (CAGR) of 7.2% from 2025 to 2033. This sustained growth will be supported by ongoing infrastructure development, the adoption of sustainable building practices, and the increasing integration of smart bathroom technologies. Increased competition is anticipated from both global and local manufacturers.
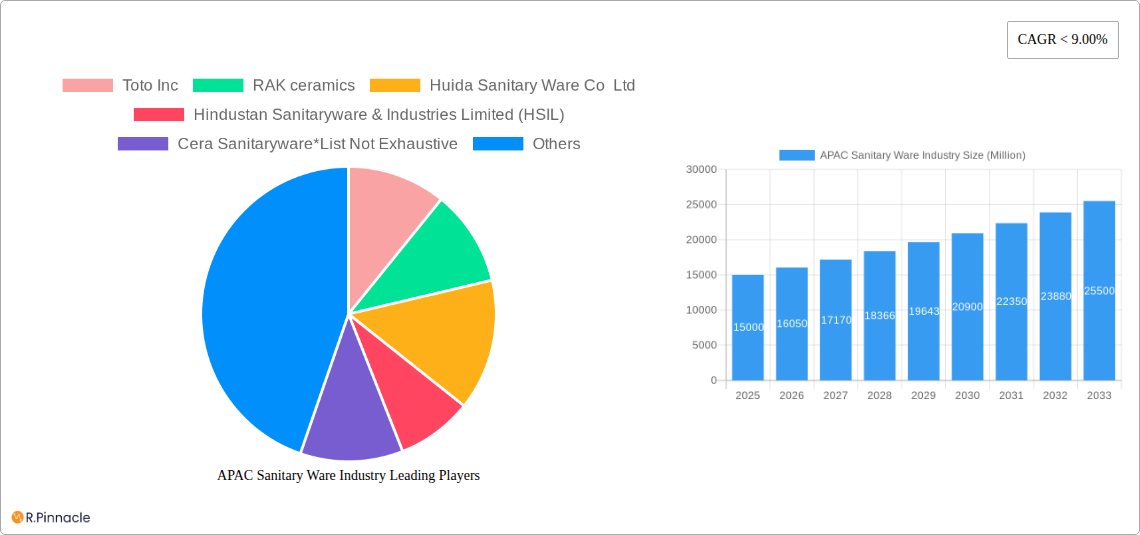
APAC Sanitary Ware Industry Market Size (In Billion)
Key strategies for market participants will involve product innovation, focusing on water-efficient fixtures, smart toilets, and sustainable materials. Companies offering a blend of affordability, quality, and advanced technology will gain a competitive edge. Furthermore, robust distribution networks and comprehensive after-sales services will be critical in catering to diverse consumer needs across the APAC region. A nuanced understanding of individual national markets within APAC is essential for success in this dynamic and expanding sector. The long-term outlook for the APAC sanitary ware market remains optimistic, driven by sustained economic growth and evolving consumer expectations.
APAC Sanitary Ware Industry Company Market Share
APAC Sanitary Ware Industry: Market Report 2019-2033
This comprehensive report provides an in-depth analysis of the Asia-Pacific (APAC) sanitary ware industry, offering invaluable insights for industry professionals, investors, and strategic decision-makers. The study covers the period from 2019 to 2033, with a base year of 2025 and a forecast period of 2025-2033. The market is segmented by country (China, Japan, India, and Others), product type (Ceramic Wash Closets, Ceramic Wash Basins, Ceramic Cisterns, Urinals, and Others), technology (Slip Casting, Tape Casting, Pressure Casting, and Others), and end-user (Residential, Commercial). The report analyzes key players like Toto Inc, RAK Ceramics, Huida Sanitary Ware Co Ltd, Hindustan Sanitaryware & Industries Limited (HSIL), Cera Sanitaryware, Kerovit, Kajaria Ceramics Limited, Lixil, Villeroy Boch Group, Jaquar, Roca (China) Co Ltd, and Kohler (China) Investment Co Ltd, providing a complete picture of this dynamic market. The total market value is projected to reach xx Million by 2033.
APAC Sanitary Ware Industry Market Structure & Innovation Trends
This section analyzes the APAC sanitary ware market's structure, focusing on market concentration, innovation drivers, regulatory frameworks, and competitive dynamics. The market is moderately concentrated, with key players holding significant market share. For example, Toto Inc and Lixil hold a combined xx% market share in 2025, while regional players like Huida and Cera control significant portions of their respective domestic markets. Innovation is driven by increasing demand for water-efficient and technologically advanced products, spurred by stringent water conservation regulations in several APAC countries. The emergence of smart sanitary ware, incorporating IoT and automation, presents significant opportunities. Several M&A activities have shaped the market landscape, with deal values exceeding xx Million in the past five years, mostly focused on expanding regional presence and product portfolios.
- Market Concentration: Moderately concentrated, with top players holding xx% market share in 2025.
- Innovation Drivers: Water conservation regulations, demand for smart sanitary ware, and technological advancements.
- Regulatory Frameworks: Vary across countries, impacting product standards and market access.
- Product Substitutes: Limited, primarily focusing on alternative materials and designs.
- End-User Demographics: Shifting towards younger, tech-savvy consumers driving demand for smart products.
- M&A Activities: Significant activity, with deal values exceeding xx Million in the last five years.
APAC Sanitary Ware Industry Market Dynamics & Trends
The APAC sanitary ware market is experiencing robust growth, driven by factors such as rising disposable incomes, rapid urbanization, and infrastructural development. The market's Compound Annual Growth Rate (CAGR) is estimated at xx% during the forecast period (2025-2033), exceeding the global average. Technological disruptions, including the introduction of smart toilets and water-saving technologies, are reshaping consumer preferences. Competitive dynamics are intense, with established players facing increasing competition from emerging brands offering innovative and cost-effective solutions. Market penetration of smart sanitary ware is projected to reach xx% by 2033, primarily driven by adoption in urban residential segments.
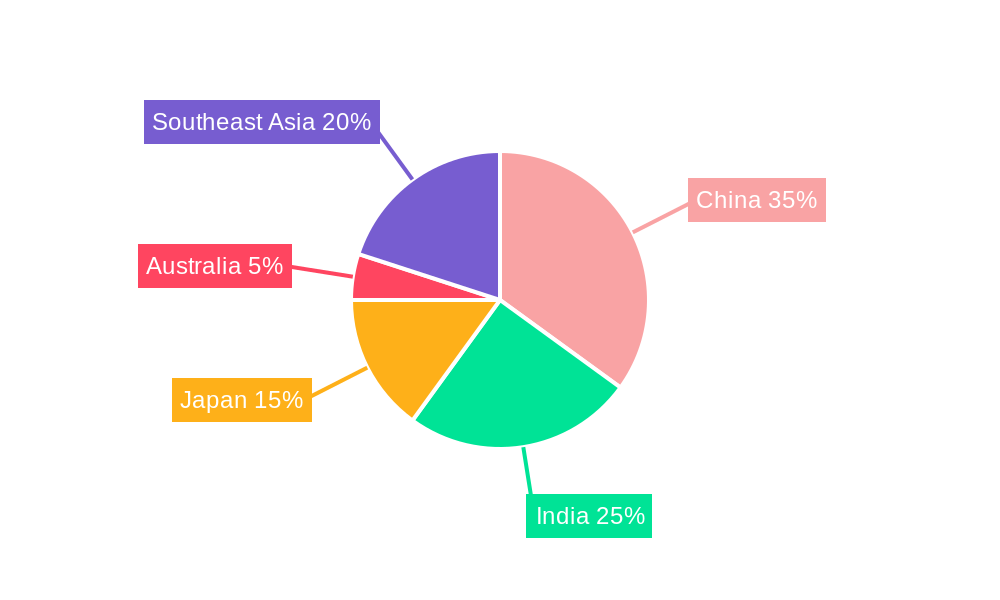
Dominant Regions & Segments in APAC Sanitary Ware Industry
China dominates the APAC sanitary ware market, accounting for over xx% of the total market value in 2025. This is due to its large population, rapid economic growth, and substantial infrastructural investments. Japan and India follow as significant markets, though with differing growth drivers. Within product segments, ceramic wash closets hold the largest share, followed by ceramic wash basins. The residential segment accounts for the majority of demand.
- Key Drivers for China: Rapid urbanization, significant infrastructure projects, and increasing disposable incomes.
- Key Drivers for Japan: High standards of living and a focus on technologically advanced products.
- Key Drivers for India: Growing middle class, rising construction activity, and government initiatives.
- Dominant Segment: Ceramic wash closets, driven by high demand in both residential and commercial sectors.
- Fastest Growing Segment: Smart sanitary ware, exhibiting high growth potential in urban areas.
APAC Sanitary Ware Industry Product Innovations
Recent innovations in the APAC sanitary ware industry focus on water efficiency, hygiene, and smart features. Manufacturers are introducing dual-flush systems, sensor-activated faucets, and self-cleaning toilets to cater to evolving consumer preferences and environmental concerns. These innovations offer competitive advantages through improved functionality, reduced water consumption, and enhanced user experience. The integration of IoT capabilities is becoming increasingly prevalent, enabling smart home integration and remote control.
Report Scope & Segmentation Analysis
This report provides a comprehensive analysis of the APAC sanitary ware market, segmented by country (China, Japan, India, Others), product type (Ceramic Wash Closets, Ceramic Wash Basins, Ceramic Cisterns, Urinals, Others), technology (Slip Casting, Tape Casting, Pressure Casting, Others), and end-user (Residential, Commercial). Each segment's growth projection, market size, and competitive dynamics are analyzed. For instance, the China market is expected to grow at xx% CAGR, while the smart sanitary ware segment shows the highest growth potential. Competitive dynamics vary by segment and region, with established players focusing on innovation and emerging brands competing on price and localized solutions.
Key Drivers of APAC Sanitary Ware Industry Growth
The APAC sanitary ware industry's growth is fueled by several key factors: rising disposable incomes across the region are driving demand for improved home amenities. Rapid urbanization and infrastructure development create a vast market for new construction. Stringent water conservation regulations promote the adoption of water-efficient sanitary ware. Government initiatives supporting sustainable housing and infrastructure development further boost the market. Technological advancements, such as the introduction of smart sanitary ware, create new market segments and opportunities.
Challenges in the APAP Sanitary Ware Industry Sector
The APAC sanitary ware industry faces several challenges. Fluctuations in raw material prices impact production costs and profitability. Intense competition, especially from lower-cost manufacturers, puts pressure on profit margins. Supply chain disruptions can lead to production delays and shortages. Stringent environmental regulations require manufacturers to adapt their production processes and adopt sustainable practices, increasing investment needs.
Emerging Opportunities in APAC Sanitary Ware Industry
Significant opportunities exist in the APAC sanitary ware market. The rising adoption of smart home technology presents a major growth area for smart sanitary ware. Growing demand for sustainable and eco-friendly products opens avenues for manufacturers to invest in water-efficient and environmentally friendly technologies. Expansion into rural markets and underserved regions presents significant potential for growth. Focus on affordable and accessible solutions will be crucial in reaching a wider customer base.
Leading Players in the APAC Sanitary Ware Industry Market
- Toto Inc
- RAK Ceramics
- Huida Sanitary Ware Co Ltd
- Hindustan Sanitaryware & Industries Limited (HSIL)
- Cera Sanitaryware
- Kerovit
- Kajaria Ceramics Limited
- Lixil
- Villeroy Boch Group
- Jaquar
- Roca (China) Co Ltd
- Kohler (China) Investment Co Ltd
Key Developments in APAC Sanitary Ware Industry
- 2022 Q4: Lixil launched a new line of water-efficient toilets in India.
- 2023 Q1: Toto Inc acquired a smaller sanitary ware manufacturer in China, expanding its market share.
- 2023 Q3: Huida Sanitary Ware Co Ltd invested in a new manufacturing facility in Vietnam.
- (Further developments to be added)
Future Outlook for APAC Sanitary Ware Industry Market
The APAC sanitary ware market is poised for continued growth, driven by sustained urbanization, rising disposable incomes, and increasing demand for technologically advanced and sustainable products. Strategic opportunities lie in focusing on innovation, particularly in smart sanitary ware and water-efficient technologies. Expansion into emerging markets and catering to the evolving needs of a younger, tech-savvy consumer base will be key to success. The market is expected to reach xx Million by 2033.
APAC Sanitary Ware Industry Segmentation
- 1. Production Analysis
- 2. Consumption Analysis
- 3. Import Market Analysis (Value & Volume)
- 4. Export Market Analysis (Value & Volume)
- 5. Price Trend Analysis
APAC Sanitary Ware Industry Segmentation By Geography
-
1. North America
- 1.1. United States
- 1.2. Canada
- 1.3. Mexico
-
2. South America
- 2.1. Brazil
- 2.2. Argentina
- 2.3. Rest of South America
-
3. Europe
- 3.1. United Kingdom
- 3.2. Germany
- 3.3. France
- 3.4. Italy
- 3.5. Spain
- 3.6. Russia
- 3.7. Benelux
- 3.8. Nordics
- 3.9. Rest of Europe
-
4. Middle East & Africa
- 4.1. Turkey
- 4.2. Israel
- 4.3. GCC
- 4.4. North Africa
- 4.5. South Africa
- 4.6. Rest of Middle East & Africa
-
5. Asia Pacific
- 5.1. China
- 5.2. India
- 5.3. Japan
- 5.4. South Korea
- 5.5. ASEAN
- 5.6. Oceania
- 5.7. Rest of Asia Pacific
APAC Sanitary Ware Industry Regional Market Share
Geographic Coverage of APAC Sanitary Ware Industry
APAC Sanitary Ware Industry REPORT HIGHLIGHTS
| Aspects | Details |
|---|---|
| Study Period | 2020-2034 |
| Base Year | 2025 |
| Estimated Year | 2026 |
| Forecast Period | 2026-2034 |
| Historical Period | 2020-2025 |
| Growth Rate | CAGR of 7.2% from 2020-2034 |
| Segmentation |
|
Table of Contents
- 1. Introduction
- 1.1. Research Scope
- 1.2. Market Segmentation
- 1.3. Research Objective
- 1.4. Definitions and Assumptions
- 2. Executive Summary
- 2.1. Market Snapshot
- 3. Market Dynamics
- 3.1. Market Drivers
- 3.2. Market Restrains
- 3.3. Market Trends
- 3.4. Market Opportunities
- 4. Market Factor Analysis
- 4.1. Porters Five Forces
- 4.1.1. Bargaining Power of Suppliers
- 4.1.2. Bargaining Power of Buyers
- 4.1.3. Threat of New Entrants
- 4.1.4. Threat of Substitutes
- 4.1.5. Competitive Rivalry
- 4.2. PESTEL analysis
- 4.3. BCG Analysis
- 4.3.1. Stars (High Growth, High Market Share)
- 4.3.2. Cash Cows (Low Growth, High Market Share)
- 4.3.3. Question Mark (High Growth, Low Market Share)
- 4.3.4. Dogs (Low Growth, Low Market Share)
- 4.4. Ansoff Matrix Analysis
- 4.5. Supply Chain Analysis
- 4.6. Regulatory Landscape
- 4.7. Current Market Potential and Opportunity Assessment (TAM–SAM–SOM Framework)
- 4.8. PRI Analyst Note
- 4.1. Porters Five Forces
- 5. Market Analysis, Insights and Forecast 2021-2033
- 5.1. Market Analysis, Insights and Forecast - by Production Analysis
- 5.2. Market Analysis, Insights and Forecast - by Consumption Analysis
- 5.3. Market Analysis, Insights and Forecast - by Import Market Analysis (Value & Volume)
- 5.4. Market Analysis, Insights and Forecast - by Export Market Analysis (Value & Volume)
- 5.5. Market Analysis, Insights and Forecast - by Price Trend Analysis
- 5.6. Market Analysis, Insights and Forecast - by Region
- 5.6.1. North America
- 5.6.2. South America
- 5.6.3. Europe
- 5.6.4. Middle East & Africa
- 5.6.5. Asia Pacific
- 6. Global APAC Sanitary Ware Industry Analysis, Insights and Forecast, 2021-2033
- 6.1. Market Analysis, Insights and Forecast - by Production Analysis
- 6.2. Market Analysis, Insights and Forecast - by Consumption Analysis
- 6.3. Market Analysis, Insights and Forecast - by Import Market Analysis (Value & Volume)
- 6.4. Market Analysis, Insights and Forecast - by Export Market Analysis (Value & Volume)
- 6.5. Market Analysis, Insights and Forecast - by Price Trend Analysis
- 7. North America APAC Sanitary Ware Industry Analysis, Insights and Forecast, 2020-2032
- 7.1. Market Analysis, Insights and Forecast - by Production Analysis
- 7.2. Market Analysis, Insights and Forecast - by Consumption Analysis
- 7.3. Market Analysis, Insights and Forecast - by Import Market Analysis (Value & Volume)
- 7.4. Market Analysis, Insights and Forecast - by Export Market Analysis (Value & Volume)
- 7.5. Market Analysis, Insights and Forecast - by Price Trend Analysis
- 8. South America APAC Sanitary Ware Industry Analysis, Insights and Forecast, 2020-2032
- 8.1. Market Analysis, Insights and Forecast - by Production Analysis
- 8.2. Market Analysis, Insights and Forecast - by Consumption Analysis
- 8.3. Market Analysis, Insights and Forecast - by Import Market Analysis (Value & Volume)
- 8.4. Market Analysis, Insights and Forecast - by Export Market Analysis (Value & Volume)
- 8.5. Market Analysis, Insights and Forecast - by Price Trend Analysis
- 9. Europe APAC Sanitary Ware Industry Analysis, Insights and Forecast, 2020-2032
- 9.1. Market Analysis, Insights and Forecast - by Production Analysis
- 9.2. Market Analysis, Insights and Forecast - by Consumption Analysis
- 9.3. Market Analysis, Insights and Forecast - by Import Market Analysis (Value & Volume)
- 9.4. Market Analysis, Insights and Forecast - by Export Market Analysis (Value & Volume)
- 9.5. Market Analysis, Insights and Forecast - by Price Trend Analysis
- 10. Middle East & Africa APAC Sanitary Ware Industry Analysis, Insights and Forecast, 2020-2032
- 10.1. Market Analysis, Insights and Forecast - by Production Analysis
- 10.2. Market Analysis, Insights and Forecast - by Consumption Analysis
- 10.3. Market Analysis, Insights and Forecast - by Import Market Analysis (Value & Volume)
- 10.4. Market Analysis, Insights and Forecast - by Export Market Analysis (Value & Volume)
- 10.5. Market Analysis, Insights and Forecast - by Price Trend Analysis
- 11. Asia Pacific APAC Sanitary Ware Industry Analysis, Insights and Forecast, 2020-2032
- 11.1. Market Analysis, Insights and Forecast - by Production Analysis
- 11.2. Market Analysis, Insights and Forecast - by Consumption Analysis
- 11.3. Market Analysis, Insights and Forecast - by Import Market Analysis (Value & Volume)
- 11.4. Market Analysis, Insights and Forecast - by Export Market Analysis (Value & Volume)
- 11.5. Market Analysis, Insights and Forecast - by Price Trend Analysis
- 12. Competitive Analysis
- 12.1. Company Profiles
- 12.1.1 Toto Inc
- 12.1.1.1. Company Overview
- 12.1.1.2. Products
- 12.1.1.3. Company Financials
- 12.1.1.4. SWOT Analysis
- 12.1.2 RAK ceramics
- 12.1.2.1. Company Overview
- 12.1.2.2. Products
- 12.1.2.3. Company Financials
- 12.1.2.4. SWOT Analysis
- 12.1.3 Huida Sanitary Ware Co Ltd
- 12.1.3.1. Company Overview
- 12.1.3.2. Products
- 12.1.3.3. Company Financials
- 12.1.3.4. SWOT Analysis
- 12.1.4 Hindustan Sanitaryware & Industries Limited (HSIL)
- 12.1.4.1. Company Overview
- 12.1.4.2. Products
- 12.1.4.3. Company Financials
- 12.1.4.4. SWOT Analysis
- 12.1.5 Cera Sanitaryware*List Not Exhaustive
- 12.1.5.1. Company Overview
- 12.1.5.2. Products
- 12.1.5.3. Company Financials
- 12.1.5.4. SWOT Analysis
- 12.1.6 Kerovit
- 12.1.6.1. Company Overview
- 12.1.6.2. Products
- 12.1.6.3. Company Financials
- 12.1.6.4. SWOT Analysis
- 12.1.7 Kajaria Ceramics Limited
- 12.1.7.1. Company Overview
- 12.1.7.2. Products
- 12.1.7.3. Company Financials
- 12.1.7.4. SWOT Analysis
- 12.1.8 Lixil
- 12.1.8.1. Company Overview
- 12.1.8.2. Products
- 12.1.8.3. Company Financials
- 12.1.8.4. SWOT Analysis
- 12.1.9 Villeroy Boch Group
- 12.1.9.1. Company Overview
- 12.1.9.2. Products
- 12.1.9.3. Company Financials
- 12.1.9.4. SWOT Analysis
- 12.1.10 Jaquar
- 12.1.10.1. Company Overview
- 12.1.10.2. Products
- 12.1.10.3. Company Financials
- 12.1.10.4. SWOT Analysis
- 12.1.11 Roca (China) Co Ltd
- 12.1.11.1. Company Overview
- 12.1.11.2. Products
- 12.1.11.3. Company Financials
- 12.1.11.4. SWOT Analysis
- 12.1.12 Kohler (China) Investment Co Ltd
- 12.1.12.1. Company Overview
- 12.1.12.2. Products
- 12.1.12.3. Company Financials
- 12.1.12.4. SWOT Analysis
- 12.1.1 Toto Inc
- 12.2. Market Entropy
- 12.2.1 Company's Key Areas Served
- 12.2.2 Recent Developments
- 12.3. Company Market Share Analysis 2025
- 12.3.1 Top 5 Companies Market Share Analysis
- 12.3.2 Top 3 Companies Market Share Analysis
- 12.4. List of Potential Customers
- 13. Research Methodology
List of Figures
- Figure 1: Global APAC Sanitary Ware Industry Revenue Breakdown (billion, %) by Region 2025 & 2033
- Figure 2: North America APAC Sanitary Ware Industry Revenue (billion), by Production Analysis 2025 & 2033
- Figure 3: North America APAC Sanitary Ware Industry Revenue Share (%), by Production Analysis 2025 & 2033
- Figure 4: North America APAC Sanitary Ware Industry Revenue (billion), by Consumption Analysis 2025 & 2033
- Figure 5: North America APAC Sanitary Ware Industry Revenue Share (%), by Consumption Analysis 2025 & 2033
- Figure 6: North America APAC Sanitary Ware Industry Revenue (billion), by Import Market Analysis (Value & Volume) 2025 & 2033
- Figure 7: North America APAC Sanitary Ware Industry Revenue Share (%), by Import Market Analysis (Value & Volume) 2025 & 2033
- Figure 8: North America APAC Sanitary Ware Industry Revenue (billion), by Export Market Analysis (Value & Volume) 2025 & 2033
- Figure 9: North America APAC Sanitary Ware Industry Revenue Share (%), by Export Market Analysis (Value & Volume) 2025 & 2033
- Figure 10: North America APAC Sanitary Ware Industry Revenue (billion), by Price Trend Analysis 2025 & 2033
- Figure 11: North America APAC Sanitary Ware Industry Revenue Share (%), by Price Trend Analysis 2025 & 2033
- Figure 12: North America APAC Sanitary Ware Industry Revenue (billion), by Country 2025 & 2033
- Figure 13: North America APAC Sanitary Ware Industry Revenue Share (%), by Country 2025 & 2033
- Figure 14: South America APAC Sanitary Ware Industry Revenue (billion), by Production Analysis 2025 & 2033
- Figure 15: South America APAC Sanitary Ware Industry Revenue Share (%), by Production Analysis 2025 & 2033
- Figure 16: South America APAC Sanitary Ware Industry Revenue (billion), by Consumption Analysis 2025 & 2033
- Figure 17: South America APAC Sanitary Ware Industry Revenue Share (%), by Consumption Analysis 2025 & 2033
- Figure 18: South America APAC Sanitary Ware Industry Revenue (billion), by Import Market Analysis (Value & Volume) 2025 & 2033
- Figure 19: South America APAC Sanitary Ware Industry Revenue Share (%), by Import Market Analysis (Value & Volume) 2025 & 2033
- Figure 20: South America APAC Sanitary Ware Industry Revenue (billion), by Export Market Analysis (Value & Volume) 2025 & 2033
- Figure 21: South America APAC Sanitary Ware Industry Revenue Share (%), by Export Market Analysis (Value & Volume) 2025 & 2033
- Figure 22: South America APAC Sanitary Ware Industry Revenue (billion), by Price Trend Analysis 2025 & 2033
- Figure 23: South America APAC Sanitary Ware Industry Revenue Share (%), by Price Trend Analysis 2025 & 2033
- Figure 24: South America APAC Sanitary Ware Industry Revenue (billion), by Country 2025 & 2033
- Figure 25: South America APAC Sanitary Ware Industry Revenue Share (%), by Country 2025 & 2033
- Figure 26: Europe APAC Sanitary Ware Industry Revenue (billion), by Production Analysis 2025 & 2033
- Figure 27: Europe APAC Sanitary Ware Industry Revenue Share (%), by Production Analysis 2025 & 2033
- Figure 28: Europe APAC Sanitary Ware Industry Revenue (billion), by Consumption Analysis 2025 & 2033
- Figure 29: Europe APAC Sanitary Ware Industry Revenue Share (%), by Consumption Analysis 2025 & 2033
- Figure 30: Europe APAC Sanitary Ware Industry Revenue (billion), by Import Market Analysis (Value & Volume) 2025 & 2033
- Figure 31: Europe APAC Sanitary Ware Industry Revenue Share (%), by Import Market Analysis (Value & Volume) 2025 & 2033
- Figure 32: Europe APAC Sanitary Ware Industry Revenue (billion), by Export Market Analysis (Value & Volume) 2025 & 2033
- Figure 33: Europe APAC Sanitary Ware Industry Revenue Share (%), by Export Market Analysis (Value & Volume) 2025 & 2033
- Figure 34: Europe APAC Sanitary Ware Industry Revenue (billion), by Price Trend Analysis 2025 & 2033
- Figure 35: Europe APAC Sanitary Ware Industry Revenue Share (%), by Price Trend Analysis 2025 & 2033
- Figure 36: Europe APAC Sanitary Ware Industry Revenue (billion), by Country 2025 & 2033
- Figure 37: Europe APAC Sanitary Ware Industry Revenue Share (%), by Country 2025 & 2033
- Figure 38: Middle East & Africa APAC Sanitary Ware Industry Revenue (billion), by Production Analysis 2025 & 2033
- Figure 39: Middle East & Africa APAC Sanitary Ware Industry Revenue Share (%), by Production Analysis 2025 & 2033
- Figure 40: Middle East & Africa APAC Sanitary Ware Industry Revenue (billion), by Consumption Analysis 2025 & 2033
- Figure 41: Middle East & Africa APAC Sanitary Ware Industry Revenue Share (%), by Consumption Analysis 2025 & 2033
- Figure 42: Middle East & Africa APAC Sanitary Ware Industry Revenue (billion), by Import Market Analysis (Value & Volume) 2025 & 2033
- Figure 43: Middle East & Africa APAC Sanitary Ware Industry Revenue Share (%), by Import Market Analysis (Value & Volume) 2025 & 2033
- Figure 44: Middle East & Africa APAC Sanitary Ware Industry Revenue (billion), by Export Market Analysis (Value & Volume) 2025 & 2033
- Figure 45: Middle East & Africa APAC Sanitary Ware Industry Revenue Share (%), by Export Market Analysis (Value & Volume) 2025 & 2033
- Figure 46: Middle East & Africa APAC Sanitary Ware Industry Revenue (billion), by Price Trend Analysis 2025 & 2033
- Figure 47: Middle East & Africa APAC Sanitary Ware Industry Revenue Share (%), by Price Trend Analysis 2025 & 2033
- Figure 48: Middle East & Africa APAC Sanitary Ware Industry Revenue (billion), by Country 2025 & 2033
- Figure 49: Middle East & Africa APAC Sanitary Ware Industry Revenue Share (%), by Country 2025 & 2033
- Figure 50: Asia Pacific APAC Sanitary Ware Industry Revenue (billion), by Production Analysis 2025 & 2033
- Figure 51: Asia Pacific APAC Sanitary Ware Industry Revenue Share (%), by Production Analysis 2025 & 2033
- Figure 52: Asia Pacific APAC Sanitary Ware Industry Revenue (billion), by Consumption Analysis 2025 & 2033
- Figure 53: Asia Pacific APAC Sanitary Ware Industry Revenue Share (%), by Consumption Analysis 2025 & 2033
- Figure 54: Asia Pacific APAC Sanitary Ware Industry Revenue (billion), by Import Market Analysis (Value & Volume) 2025 & 2033
- Figure 55: Asia Pacific APAC Sanitary Ware Industry Revenue Share (%), by Import Market Analysis (Value & Volume) 2025 & 2033
- Figure 56: Asia Pacific APAC Sanitary Ware Industry Revenue (billion), by Export Market Analysis (Value & Volume) 2025 & 2033
- Figure 57: Asia Pacific APAC Sanitary Ware Industry Revenue Share (%), by Export Market Analysis (Value & Volume) 2025 & 2033
- Figure 58: Asia Pacific APAC Sanitary Ware Industry Revenue (billion), by Price Trend Analysis 2025 & 2033
- Figure 59: Asia Pacific APAC Sanitary Ware Industry Revenue Share (%), by Price Trend Analysis 2025 & 2033
- Figure 60: Asia Pacific APAC Sanitary Ware Industry Revenue (billion), by Country 2025 & 2033
- Figure 61: Asia Pacific APAC Sanitary Ware Industry Revenue Share (%), by Country 2025 & 2033
List of Tables
- Table 1: Global APAC Sanitary Ware Industry Revenue billion Forecast, by Production Analysis 2020 & 2033
- Table 2: Global APAC Sanitary Ware Industry Revenue billion Forecast, by Consumption Analysis 2020 & 2033
- Table 3: Global APAC Sanitary Ware Industry Revenue billion Forecast, by Import Market Analysis (Value & Volume) 2020 & 2033
- Table 4: Global APAC Sanitary Ware Industry Revenue billion Forecast, by Export Market Analysis (Value & Volume) 2020 & 2033
- Table 5: Global APAC Sanitary Ware Industry Revenue billion Forecast, by Price Trend Analysis 2020 & 2033
- Table 6: Global APAC Sanitary Ware Industry Revenue billion Forecast, by Region 2020 & 2033
- Table 7: Global APAC Sanitary Ware Industry Revenue billion Forecast, by Production Analysis 2020 & 2033
- Table 8: Global APAC Sanitary Ware Industry Revenue billion Forecast, by Consumption Analysis 2020 & 2033
- Table 9: Global APAC Sanitary Ware Industry Revenue billion Forecast, by Import Market Analysis (Value & Volume) 2020 & 2033
- Table 10: Global APAC Sanitary Ware Industry Revenue billion Forecast, by Export Market Analysis (Value & Volume) 2020 & 2033
- Table 11: Global APAC Sanitary Ware Industry Revenue billion Forecast, by Price Trend Analysis 2020 & 2033
- Table 12: Global APAC Sanitary Ware Industry Revenue billion Forecast, by Country 2020 & 2033
- Table 13: United States APAC Sanitary Ware Industry Revenue (billion) Forecast, by Application 2020 & 2033
- Table 14: Canada APAC Sanitary Ware Industry Revenue (billion) Forecast, by Application 2020 & 2033
- Table 15: Mexico APAC Sanitary Ware Industry Revenue (billion) Forecast, by Application 2020 & 2033
- Table 16: Global APAC Sanitary Ware Industry Revenue billion Forecast, by Production Analysis 2020 & 2033
- Table 17: Global APAC Sanitary Ware Industry Revenue billion Forecast, by Consumption Analysis 2020 & 2033
- Table 18: Global APAC Sanitary Ware Industry Revenue billion Forecast, by Import Market Analysis (Value & Volume) 2020 & 2033
- Table 19: Global APAC Sanitary Ware Industry Revenue billion Forecast, by Export Market Analysis (Value & Volume) 2020 & 2033
- Table 20: Global APAC Sanitary Ware Industry Revenue billion Forecast, by Price Trend Analysis 2020 & 2033
- Table 21: Global APAC Sanitary Ware Industry Revenue billion Forecast, by Country 2020 & 2033
- Table 22: Brazil APAC Sanitary Ware Industry Revenue (billion) Forecast, by Application 2020 & 2033
- Table 23: Argentina APAC Sanitary Ware Industry Revenue (billion) Forecast, by Application 2020 & 2033
- Table 24: Rest of South America APAC Sanitary Ware Industry Revenue (billion) Forecast, by Application 2020 & 2033
- Table 25: Global APAC Sanitary Ware Industry Revenue billion Forecast, by Production Analysis 2020 & 2033
- Table 26: Global APAC Sanitary Ware Industry Revenue billion Forecast, by Consumption Analysis 2020 & 2033
- Table 27: Global APAC Sanitary Ware Industry Revenue billion Forecast, by Import Market Analysis (Value & Volume) 2020 & 2033
- Table 28: Global APAC Sanitary Ware Industry Revenue billion Forecast, by Export Market Analysis (Value & Volume) 2020 & 2033
- Table 29: Global APAC Sanitary Ware Industry Revenue billion Forecast, by Price Trend Analysis 2020 & 2033
- Table 30: Global APAC Sanitary Ware Industry Revenue billion Forecast, by Country 2020 & 2033
- Table 31: United Kingdom APAC Sanitary Ware Industry Revenue (billion) Forecast, by Application 2020 & 2033
- Table 32: Germany APAC Sanitary Ware Industry Revenue (billion) Forecast, by Application 2020 & 2033
- Table 33: France APAC Sanitary Ware Industry Revenue (billion) Forecast, by Application 2020 & 2033
- Table 34: Italy APAC Sanitary Ware Industry Revenue (billion) Forecast, by Application 2020 & 2033
- Table 35: Spain APAC Sanitary Ware Industry Revenue (billion) Forecast, by Application 2020 & 2033
- Table 36: Russia APAC Sanitary Ware Industry Revenue (billion) Forecast, by Application 2020 & 2033
- Table 37: Benelux APAC Sanitary Ware Industry Revenue (billion) Forecast, by Application 2020 & 2033
- Table 38: Nordics APAC Sanitary Ware Industry Revenue (billion) Forecast, by Application 2020 & 2033
- Table 39: Rest of Europe APAC Sanitary Ware Industry Revenue (billion) Forecast, by Application 2020 & 2033
- Table 40: Global APAC Sanitary Ware Industry Revenue billion Forecast, by Production Analysis 2020 & 2033
- Table 41: Global APAC Sanitary Ware Industry Revenue billion Forecast, by Consumption Analysis 2020 & 2033
- Table 42: Global APAC Sanitary Ware Industry Revenue billion Forecast, by Import Market Analysis (Value & Volume) 2020 & 2033
- Table 43: Global APAC Sanitary Ware Industry Revenue billion Forecast, by Export Market Analysis (Value & Volume) 2020 & 2033
- Table 44: Global APAC Sanitary Ware Industry Revenue billion Forecast, by Price Trend Analysis 2020 & 2033
- Table 45: Global APAC Sanitary Ware Industry Revenue billion Forecast, by Country 2020 & 2033
- Table 46: Turkey APAC Sanitary Ware Industry Revenue (billion) Forecast, by Application 2020 & 2033
- Table 47: Israel APAC Sanitary Ware Industry Revenue (billion) Forecast, by Application 2020 & 2033
- Table 48: GCC APAC Sanitary Ware Industry Revenue (billion) Forecast, by Application 2020 & 2033
- Table 49: North Africa APAC Sanitary Ware Industry Revenue (billion) Forecast, by Application 2020 & 2033
- Table 50: South Africa APAC Sanitary Ware Industry Revenue (billion) Forecast, by Application 2020 & 2033
- Table 51: Rest of Middle East & Africa APAC Sanitary Ware Industry Revenue (billion) Forecast, by Application 2020 & 2033
- Table 52: Global APAC Sanitary Ware Industry Revenue billion Forecast, by Production Analysis 2020 & 2033
- Table 53: Global APAC Sanitary Ware Industry Revenue billion Forecast, by Consumption Analysis 2020 & 2033
- Table 54: Global APAC Sanitary Ware Industry Revenue billion Forecast, by Import Market Analysis (Value & Volume) 2020 & 2033
- Table 55: Global APAC Sanitary Ware Industry Revenue billion Forecast, by Export Market Analysis (Value & Volume) 2020 & 2033
- Table 56: Global APAC Sanitary Ware Industry Revenue billion Forecast, by Price Trend Analysis 2020 & 2033
- Table 57: Global APAC Sanitary Ware Industry Revenue billion Forecast, by Country 2020 & 2033
- Table 58: China APAC Sanitary Ware Industry Revenue (billion) Forecast, by Application 2020 & 2033
- Table 59: India APAC Sanitary Ware Industry Revenue (billion) Forecast, by Application 2020 & 2033
- Table 60: Japan APAC Sanitary Ware Industry Revenue (billion) Forecast, by Application 2020 & 2033
- Table 61: South Korea APAC Sanitary Ware Industry Revenue (billion) Forecast, by Application 2020 & 2033
- Table 62: ASEAN APAC Sanitary Ware Industry Revenue (billion) Forecast, by Application 2020 & 2033
- Table 63: Oceania APAC Sanitary Ware Industry Revenue (billion) Forecast, by Application 2020 & 2033
- Table 64: Rest of Asia Pacific APAC Sanitary Ware Industry Revenue (billion) Forecast, by Application 2020 & 2033
Frequently Asked Questions
1. What is the projected Compound Annual Growth Rate (CAGR) of the APAC Sanitary Ware Industry?
The projected CAGR is approximately 7.2%.
2. Which companies are prominent players in the APAC Sanitary Ware Industry?
Key companies in the market include Toto Inc, RAK ceramics, Huida Sanitary Ware Co Ltd, Hindustan Sanitaryware & Industries Limited (HSIL), Cera Sanitaryware*List Not Exhaustive, Kerovit, Kajaria Ceramics Limited, Lixil, Villeroy Boch Group, Jaquar, Roca (China) Co Ltd, Kohler (China) Investment Co Ltd.
3. What are the main segments of the APAC Sanitary Ware Industry?
The market segments include Production Analysis, Consumption Analysis, Import Market Analysis (Value & Volume), Export Market Analysis (Value & Volume), Price Trend Analysis.
4. Can you provide details about the market size?
The market size is estimated to be USD 32.47 billion as of 2022.
5. What are some drivers contributing to market growth?
Rising Urbanization and Population Growth.
6. What are the notable trends driving market growth?
Ceramic Wash Closets Are Witnessing Increased Demand.
7. Are there any restraints impacting market growth?
Economic Uncertainty.
8. Can you provide examples of recent developments in the market?
N/A
9. What pricing options are available for accessing the report?
Pricing options include single-user, multi-user, and enterprise licenses priced at USD 3800, USD 4500, and USD 5800 respectively.
10. Is the market size provided in terms of value or volume?
The market size is provided in terms of value, measured in billion.
11. Are there any specific market keywords associated with the report?
Yes, the market keyword associated with the report is "APAC Sanitary Ware Industry," which aids in identifying and referencing the specific market segment covered.
12. How do I determine which pricing option suits my needs best?
The pricing options vary based on user requirements and access needs. Individual users may opt for single-user licenses, while businesses requiring broader access may choose multi-user or enterprise licenses for cost-effective access to the report.
13. Are there any additional resources or data provided in the APAC Sanitary Ware Industry report?
While the report offers comprehensive insights, it's advisable to review the specific contents or supplementary materials provided to ascertain if additional resources or data are available.
14. How can I stay updated on further developments or reports in the APAC Sanitary Ware Industry?
To stay informed about further developments, trends, and reports in the APAC Sanitary Ware Industry, consider subscribing to industry newsletters, following relevant companies and organizations, or regularly checking reputable industry news sources and publications.
Methodology
Step 1 - Identification of Relevant Samples Size from Population Database


Step 2 - Approaches for Defining Global Market Size (Value, Volume* & Price*)

Note*: In applicable scenarios
Step 3 - Data Sources
Primary Research
- Web Analytics
- Survey Reports
- Research Institute
- Latest Research Reports
- Opinion Leaders
Secondary Research
- Annual Reports
- White Paper
- Latest Press Release
- Industry Association
- Paid Database
- Investor Presentations

Step 4 - Data Triangulation
Involves using different sources of information in order to increase the validity of a study
These sources are likely to be stakeholders in a program - participants, other researchers, program staff, other community members, and so on.
Then we put all data in single framework & apply various statistical tools to find out the dynamic on the market.
During the analysis stage, feedback from the stakeholder groups would be compared to determine areas of agreement as well as areas of divergence