

Key Insights
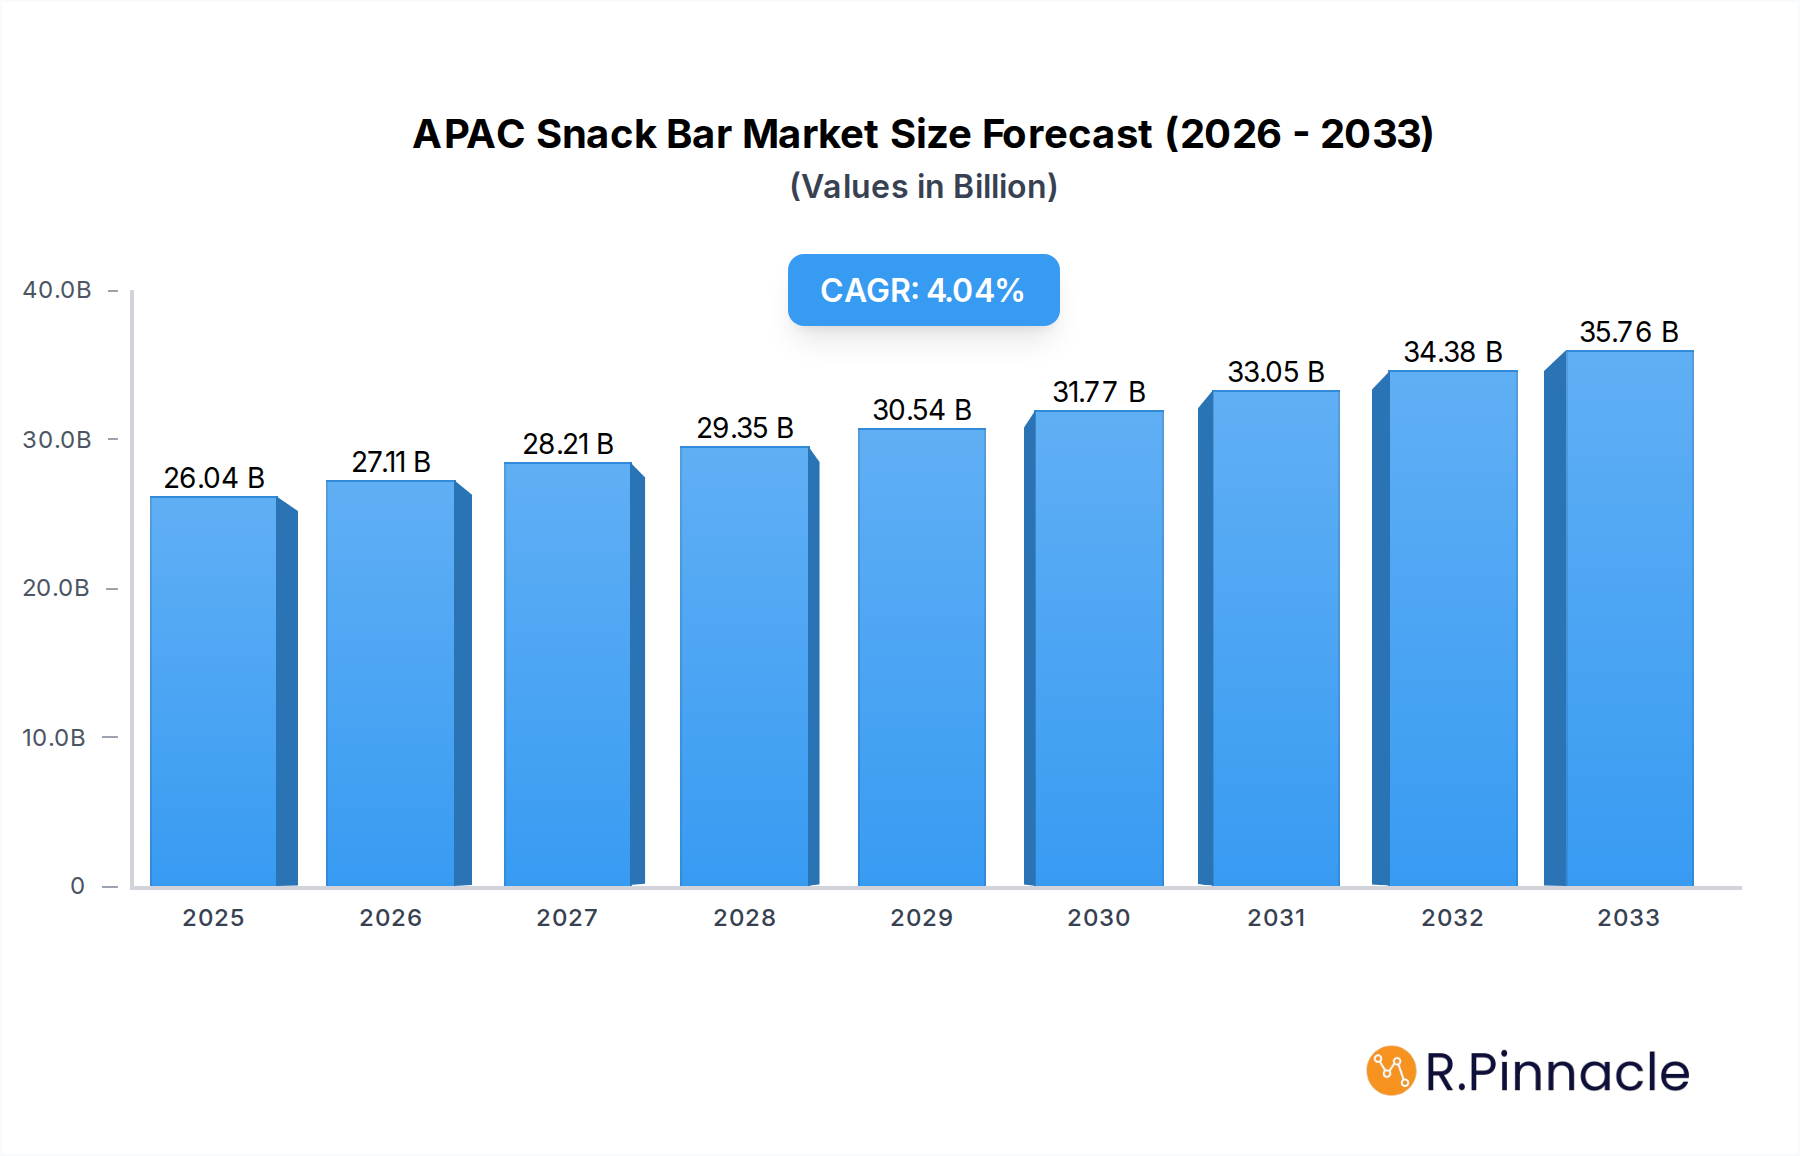
The APAC Snack Bar Market is poised for substantial growth, projected to reach an estimated value of $26,040 million by 2025, exhibiting a robust Compound Annual Growth Rate (CAGR) of 4.12%. This expansion is fueled by a confluence of evolving consumer lifestyles, increasing health consciousness, and the growing demand for convenient and nutritious food options across the region. The rising disposable incomes, particularly in emerging economies within Asia Pacific, are empowering consumers to spend more on premium and specialized snack bars. Key drivers include the growing awareness of the health benefits associated with ingredients like fruits, nuts, and cereals, leading to a surge in demand for healthier snacking alternatives. Furthermore, the convenience factor of snack bars, catering to busy schedules and on-the-go consumption, is a significant growth enabler. The market's trajectory is also being shaped by innovative product development, with manufacturers introducing a wider variety of flavors, functional ingredients, and dietary-specific options such as gluten-free and vegan bars to cater to diverse consumer preferences. The online retail channel is emerging as a pivotal distribution point, offering wider accessibility and convenience to a growing digitally-savvy consumer base.

APAC Snack Bar Market Market Size (In Billion)
The market is segmented into various confectionary variants, with Cereal Bars, Fruit & Nut Bars, and Protein Bars collectively dominating consumer preference due to their perceived health benefits and versatility. Distribution channels like Convenience Stores, Online Retail Stores, and Supermarkets/Hypermarkets are the primary avenues for market penetration, with online platforms witnessing accelerated growth. The competitive landscape is characterized by the presence of both global giants such as Nestlé SA, PepsiCo Inc., and Mondelēz International Inc., alongside regional players, fostering an environment of innovation and strategic alliances. Restraints such as fluctuating raw material prices and intense competition are present, but the overarching trend towards healthier eating habits and the demand for portable nutrition are expected to offset these challenges, propelling sustained market expansion in the coming years.
APAC Snack Bar Market Company Market Share
APAC Snack Bar Market: Comprehensive Analysis and Future Outlook (2019-2033)
This report provides an in-depth analysis of the APAC Snack Bar Market, offering critical insights for industry professionals seeking to understand market dynamics, competitive landscape, and future growth trajectories. Covering the historical period from 2019 to 2024 and a forecast period up to 2033, this comprehensive study leverages high-ranking keywords to maximize search visibility and deliver actionable intelligence. The APAC Snack Bar Market is projected to reach USD XXX Million by 2025, driven by evolving consumer lifestyles and a growing demand for convenient, healthy snacking options across the region.
APAC Snack Bar Market Market Structure & Innovation Trends
The APAC Snack Bar Market exhibits a dynamic structure characterized by a moderate level of market concentration. Key players like Nestlé SA, PepsiCo Inc., and Mondelēz International Inc. hold significant market shares, but the landscape also features a growing number of agile regional and niche brands. Innovation drivers are primarily focused on product diversification, health and wellness attributes, and sustainable sourcing. Regulatory frameworks, while varying across countries, generally support food safety and labeling standards. Product substitutes include traditional confectionery, fresh fruits, and other convenience foods. End-user demographics are increasingly diverse, with a rising disposable income among the middle class, a growing millennial and Gen Z population seeking on-the-go solutions, and an aging population interested in functional and health-oriented snacks. Mergers and acquisitions (M&A) activities are strategic, aimed at expanding product portfolios, market reach, and technological capabilities. Notable M&A deal values, though subject to market conditions, are expected to increase as companies seek to consolidate their positions and tap into new consumer segments. The market’s structure is evolving to accommodate personalized nutrition trends and a greater emphasis on clean-label ingredients, fostering a competitive yet innovative environment.
APAC Snack Bar Market Market Dynamics & Trends
The APAC Snack Bar Market is poised for significant expansion, fueled by a confluence of powerful market growth drivers. The escalating urbanization and the adoption of Westernized lifestyles across the Asia-Pacific region are leading to busier schedules and a greater demand for convenient, ready-to-eat food options, with snack bars perfectly fitting this niche. A heightened consumer awareness regarding health and wellness is a pivotal trend, driving demand for snack bars with functional benefits, such as high protein content, added vitamins, and natural ingredients, moving away from traditional, sugar-laden confectionery. The burgeoning middle class, with its increasing disposable income, is willing to spend more on premium and health-conscious snack options, further bolstering market penetration. Technological disruptions are playing a crucial role, particularly in e-commerce and direct-to-consumer (DTC) channels, which offer convenient access and personalized purchasing experiences for consumers across diverse geographies. Innovations in ingredient technology, such as the development of plant-based proteins and novel sweeteners, are catering to evolving dietary preferences and health trends. Competitive dynamics are intensifying, with both multinational corporations and local players vying for market share. This competition is driving product innovation, aggressive marketing campaigns, and strategic partnerships to capture consumer attention and loyalty. The CAGR for the APAC Snack Bar Market is projected to be strong, indicating a robust growth trajectory over the forecast period. Market penetration is expected to deepen as awareness and availability increase across both developed and emerging economies within the APAC region.
Dominant Regions & Segments in APAC Snack Bar Market
The APAC Snack Bar Market is characterized by regional dominance and segment-specific growth patterns. East Asia, encompassing countries like China, Japan, and South Korea, is a leading region due to its large population, high disposable incomes, and advanced retail infrastructure. Economic policies that encourage consumer spending and investment in the food industry further bolster its position. China, in particular, stands out as a dominant country, driven by a rapidly expanding middle class and a burgeoning e-commerce sector that facilitates widespread product availability.
Within the Confectionery Variant segment, Fruit & Nut Bars hold a significant market share, appealing to consumers seeking healthier, natural energy sources. The Protein Bar segment is experiencing explosive growth, fueled by increased health consciousness and the rising popularity of fitness and active lifestyles across the region. This segment's dominance is supported by technological advancements in protein formulation and diverse flavor profiles.
The Distribution Channel landscape sees Supermarkets/Hypermarkets as a dominant channel, offering wide product assortments and convenient shopping experiences. However, Online Retail Stores are rapidly gaining traction, especially in urban centers, providing unparalleled convenience and accessibility, particularly for specialized or premium snack bars. The growth of online channels is a direct consequence of increasing internet penetration and the adoption of online grocery shopping habits.
Key drivers for regional and segment dominance include:
- Economic Policies: Government initiatives promoting health and wellness, as well as trade agreements facilitating market access.
- Infrastructure Development: Advanced logistics and retail networks enabling efficient product distribution.
- Consumer Demographics: A growing young and middle-aged population with disposable income and a focus on health.
- Technological Adoption: High internet penetration and smartphone usage driving online sales and marketing.
- Cultural Trends: Increasing awareness and adoption of global dietary trends, such as plant-based and high-protein diets.
The dominance of specific regions and segments is a testament to the market's responsiveness to evolving consumer needs and the strategic investments made by key players in leveraging these trends.
APAC Snack Bar Market Product Innovations
Product innovations in the APAC Snack Bar Market are rapidly evolving, focusing on enhanced nutritional profiles and convenient formats. Manufacturers are increasingly emphasizing natural ingredients, reduced sugar content, and the incorporation of functional ingredients like probiotics and adaptogens. Technological advancements in processing allow for the creation of bars with improved textures and extended shelf life. Competitive advantages are being gained through unique flavor combinations, allergen-free formulations, and sustainable packaging solutions. The market is witnessing a surge in plant-based and vegan snack bar options, catering to a growing segment of environmentally conscious consumers. Applications range from quick on-the-go breakfasts and post-workout recovery snacks to healthier alternatives for traditional desserts. These innovations are crucial for staying ahead in a competitive landscape driven by evolving consumer demands for health, convenience, and ethical sourcing.
Report Scope & Segmentation Analysis
This report meticulously analyzes the APAC Snack Bar Market across various segments to provide a granular understanding of its landscape. The Confectionery Variant is segmented into Cereal Bar, Fruit & Nut Bar, and Protein Bar. The Cereal Bar segment, historically popular, continues to offer diverse options catering to a broad consumer base. The Fruit & Nut Bar segment benefits from the increasing demand for natural ingredients and sustained energy. The Protein Bar segment is projected for robust growth, driven by fitness trends and health-conscious consumers.
The Distribution Channel segmentation includes Convenience Store, Online Retail Store, Supermarket/Hypermarket, and Others. Convenience stores offer impulse purchases and accessibility, while supermarkets and hypermarkets provide wider selection. The Online Retail Store segment is experiencing significant expansion due to its convenience and reach, enabling personalized marketing and direct-to-consumer sales. The competitive dynamics within each segment vary, with online channels offering a lower barrier to entry for new players, while established brands leverage their reach in physical retail. Growth projections and market sizes will be detailed for each segment, providing a clear roadmap for strategic decision-making.
Key Drivers of APAC Snack Bar Market Growth
The APAC Snack Bar Market is propelled by several key drivers. Rising disposable incomes across emerging economies allow consumers to opt for premium and health-conscious snacks. The increasing health and wellness trend is a major catalyst, with consumers actively seeking products offering functional benefits like protein, fiber, and essential nutrients. Busy urban lifestyles and the demand for convenient on-the-go food options further fuel the market. Technological advancements in product formulation and ingredient sourcing enable the creation of more appealing and nutritious snack bars. Furthermore, growing awareness of product benefits through digital marketing and influencer collaborations is expanding consumer reach and demand.
Challenges in the APAC Snack Bar Market Sector
Despite its growth potential, the APAC Snack Bar Market faces several challenges. Intense competition from both global giants and local players necessitates continuous innovation and aggressive marketing strategies. Price sensitivity in some developing markets can limit the adoption of premium products. Regulatory complexities across different countries regarding food labeling, ingredients, and health claims can pose hurdles for market entry and expansion. Supply chain disruptions, exacerbated by geopolitical factors and logistical challenges, can impact product availability and cost. Furthermore, consumer skepticism towards processed foods and a preference for perceived "natural" or "homemade" options can act as a restraint, requiring clear communication of product benefits and ingredient transparency.
Emerging Opportunities in APAC Snack Bar Market
Emerging opportunities in the APAC Snack Bar Market are significant and varied. The growing demand for plant-based and vegan snack bars presents a substantial market segment to tap into. Innovations in personalized nutrition, offering tailor-made bars based on individual dietary needs and preferences, are poised for growth. The expansion of e-commerce and direct-to-consumer (DTC) models provides a direct channel to reach consumers and build brand loyalty. There is also a burgeoning opportunity in functional snack bars enriched with probiotics, prebiotics, or adaptogens to cater to specific health concerns like gut health and stress management. Furthermore, sustainable sourcing and eco-friendly packaging are becoming increasingly important differentiators, appealing to a growing segment of environmentally conscious consumers.
Leading Players in the APAC Snack Bar Market Market
- Nestlé SA
- Post Holdings Inc
- Asahi Group Holdings Ltd
- Simply Good Foods Co
- General Mills Inc
- PepsiCo Inc
- Lotus Bakeries
- Morinaga & Co Ltd
- Bagrrys India Private Limited
- Carman's Fine Foods Pty Ltd
- Ferrero International SA
- Naturell India Pvt Ltd
- Mars Incorporated
- Otsuka Holdings Co Ltd
- Mondelēz International Inc
- Amway International Inc
- Kellogg Company
Key Developments in APAC Snack Bar Market Industry
- May 2023: Nestlé’s Milo launched a protein snack bar offering 6 g of protein and a source of fiber. These protein snack bars retail at USD 8 for 180 g or six bars and are available in Coles and independent grocers across Australia.
- May 2023: Uncle Tobys unveiled a protein muesli bar in four new flavors. The muesli bar is made with 20% protein, i.e., 7 g of protein per bar, comes in multipacks of 5, and can be found in supermarkets for RRP AUD 6.70. The bars are available in flavors like Caramel and Dark Choc, Raspberry, Goji and White Choc, Lemon with a Yoghurty Drizzle, and Double Choc.
- March 2023: Bagrrys India Private Limited announced the launch of The Mighty Muesli Bars, which are all-natural, healthy, and packed with multi-grains, nuts, fruits, and honey with a punch of high fiber.
Future Outlook for APAC Snack Bar Market Market
The future outlook for the APAC Snack Bar Market is exceptionally promising, driven by sustained consumer demand for convenient and healthy food options. The market is expected to witness continued growth propelled by innovation in product formulation, with a particular emphasis on natural ingredients, functional benefits, and personalized nutrition. The expansion of online retail channels will further democratize access to a wide array of snack bars, catering to diverse preferences across the region. Strategic collaborations, mergers, and acquisitions will likely shape the competitive landscape, enabling players to expand their market reach and product portfolios. The increasing consciousness around health and wellness, coupled with rising disposable incomes, positions the APAC Snack Bar Market for significant and sustained expansion, offering lucrative opportunities for both established and emerging players.
APAC Snack Bar Market Segmentation
-
1. Confectionery Variant
- 1.1. Cereal Bar
- 1.2. Fruit & Nut Bar
- 1.3. Protein Bar
-
2. Distribution Channel
- 2.1. Convenience Store
- 2.2. Online Retail Store
- 2.3. Supermarket/Hypermarket
- 2.4. Others
APAC Snack Bar Market Segmentation By Geography
-
1. North America
- 1.1. United States
- 1.2. Canada
- 1.3. Mexico
-
2. South America
- 2.1. Brazil
- 2.2. Argentina
- 2.3. Rest of South America
-
3. Europe
- 3.1. United Kingdom
- 3.2. Germany
- 3.3. France
- 3.4. Italy
- 3.5. Spain
- 3.6. Russia
- 3.7. Benelux
- 3.8. Nordics
- 3.9. Rest of Europe
-
4. Middle East & Africa
- 4.1. Turkey
- 4.2. Israel
- 4.3. GCC
- 4.4. North Africa
- 4.5. South Africa
- 4.6. Rest of Middle East & Africa
-
5. Asia Pacific
- 5.1. China
- 5.2. India
- 5.3. Japan
- 5.4. South Korea
- 5.5. ASEAN
- 5.6. Oceania
- 5.7. Rest of Asia Pacific
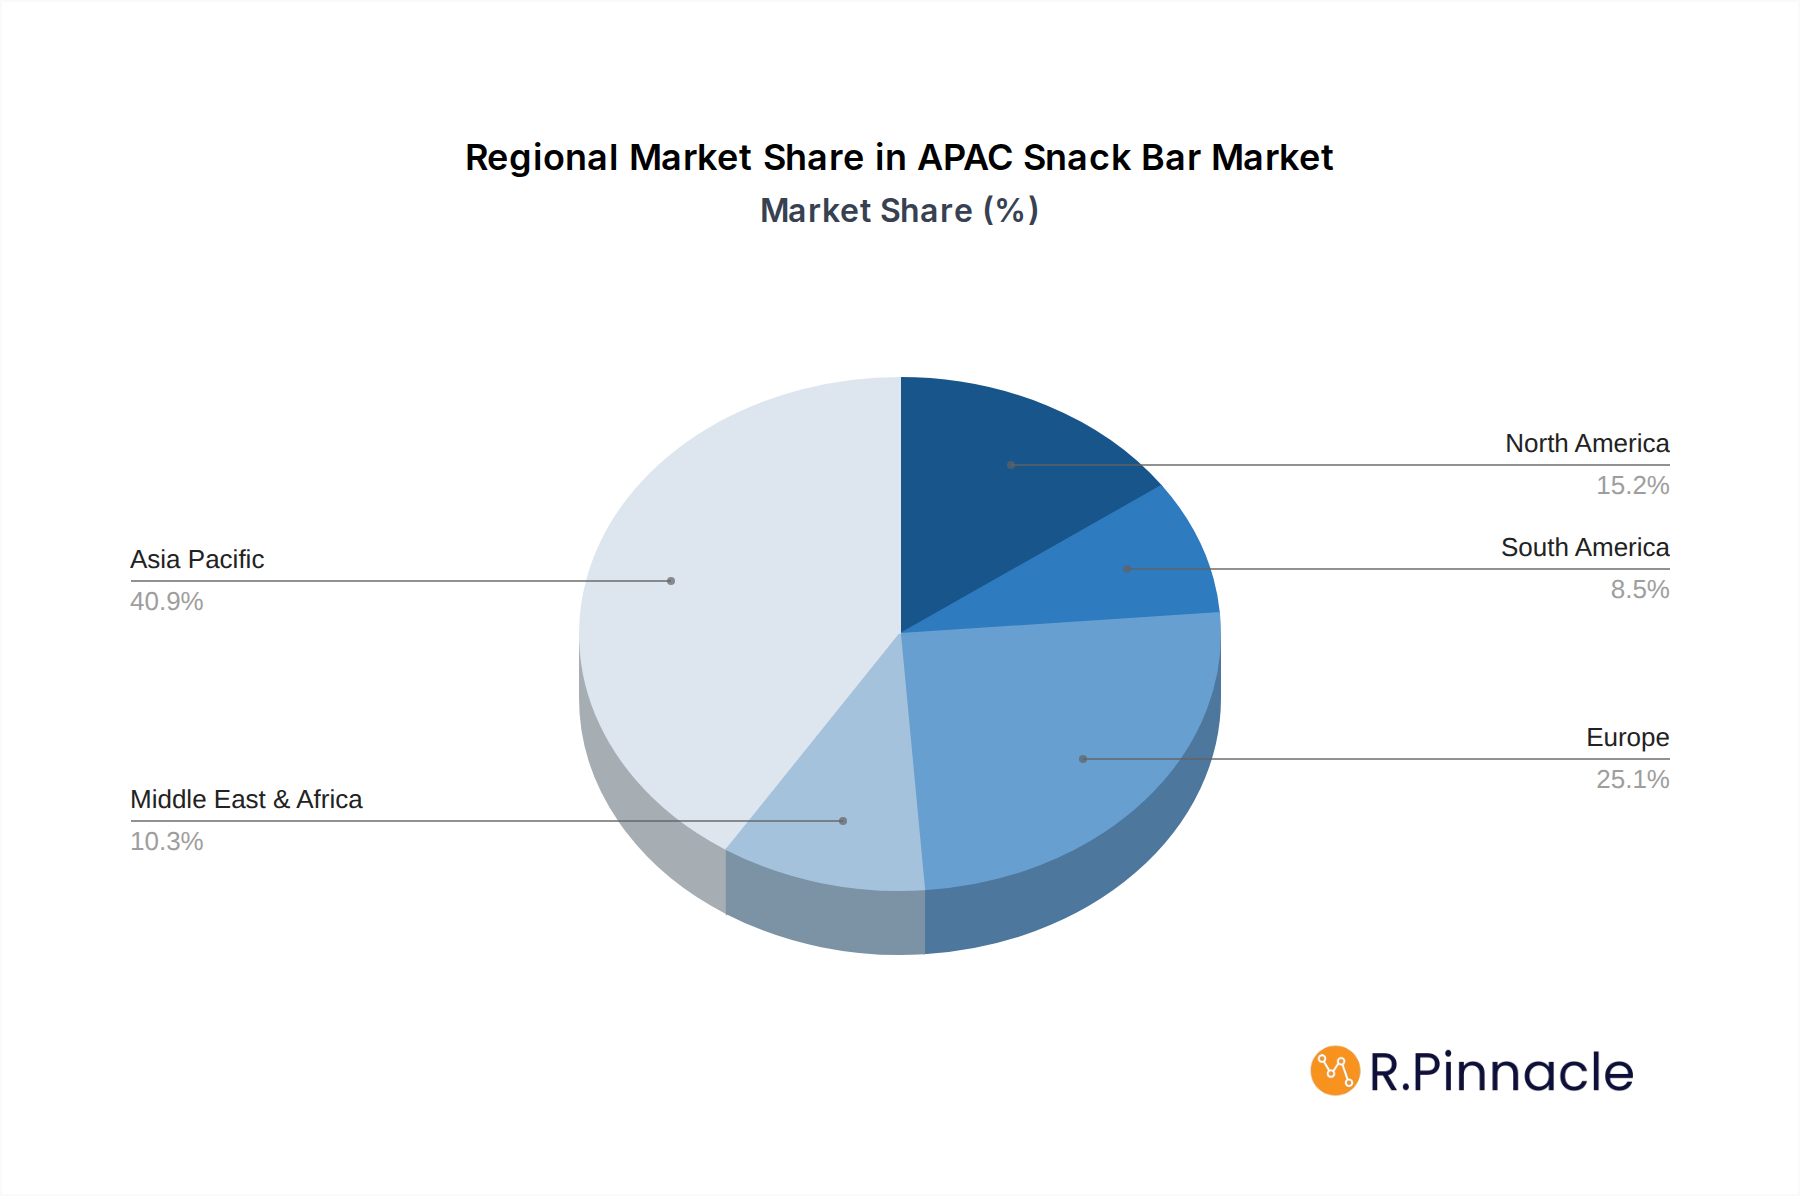
APAC Snack Bar Market Regional Market Share
Geographic Coverage of APAC Snack Bar Market
APAC Snack Bar Market REPORT HIGHLIGHTS
| Aspects | Details |
|---|---|
| Study Period | 2020-2034 |
| Base Year | 2025 |
| Estimated Year | 2026 |
| Forecast Period | 2026-2034 |
| Historical Period | 2020-2025 |
| Growth Rate | CAGR of 4.12% from 2020-2034 |
| Segmentation |
|
Table of Contents
- 1. Introduction
- 1.1. Research Scope
- 1.2. Market Segmentation
- 1.3. Research Objective
- 1.4. Definitions and Assumptions
- 2. Executive Summary
- 2.1. Market Snapshot
- 3. Market Dynamics
- 3.1. Market Drivers
- 3.2. Market Restrains
- 3.3. Market Trends
- 3.4. Market Opportunities
- 4. Market Factor Analysis
- 4.1. Porters Five Forces
- 4.1.1. Bargaining Power of Suppliers
- 4.1.2. Bargaining Power of Buyers
- 4.1.3. Threat of New Entrants
- 4.1.4. Threat of Substitutes
- 4.1.5. Competitive Rivalry
- 4.2. PESTEL analysis
- 4.3. BCG Analysis
- 4.3.1. Stars (High Growth, High Market Share)
- 4.3.2. Cash Cows (Low Growth, High Market Share)
- 4.3.3. Question Mark (High Growth, Low Market Share)
- 4.3.4. Dogs (Low Growth, Low Market Share)
- 4.4. Ansoff Matrix Analysis
- 4.5. Supply Chain Analysis
- 4.6. Regulatory Landscape
- 4.7. Current Market Potential and Opportunity Assessment (TAM–SAM–SOM Framework)
- 4.8. PRI Analyst Note
- 4.1. Porters Five Forces
- 5. Market Analysis, Insights and Forecast 2021-2033
- 5.1. Market Analysis, Insights and Forecast - by Confectionery Variant
- 5.1.1. Cereal Bar
- 5.1.2. Fruit & Nut Bar
- 5.1.3. Protein Bar
- 5.2. Market Analysis, Insights and Forecast - by Distribution Channel
- 5.2.1. Convenience Store
- 5.2.2. Online Retail Store
- 5.2.3. Supermarket/Hypermarket
- 5.2.4. Others
- 5.3. Market Analysis, Insights and Forecast - by Region
- 5.3.1. North America
- 5.3.2. South America
- 5.3.3. Europe
- 5.3.4. Middle East & Africa
- 5.3.5. Asia Pacific
- 5.1. Market Analysis, Insights and Forecast - by Confectionery Variant
- 6. Global APAC Snack Bar Market Analysis, Insights and Forecast, 2021-2033
- 6.1. Market Analysis, Insights and Forecast - by Confectionery Variant
- 6.1.1. Cereal Bar
- 6.1.2. Fruit & Nut Bar
- 6.1.3. Protein Bar
- 6.2. Market Analysis, Insights and Forecast - by Distribution Channel
- 6.2.1. Convenience Store
- 6.2.2. Online Retail Store
- 6.2.3. Supermarket/Hypermarket
- 6.2.4. Others
- 6.1. Market Analysis, Insights and Forecast - by Confectionery Variant
- 7. North America APAC Snack Bar Market Analysis, Insights and Forecast, 2020-2032
- 7.1. Market Analysis, Insights and Forecast - by Confectionery Variant
- 7.1.1. Cereal Bar
- 7.1.2. Fruit & Nut Bar
- 7.1.3. Protein Bar
- 7.2. Market Analysis, Insights and Forecast - by Distribution Channel
- 7.2.1. Convenience Store
- 7.2.2. Online Retail Store
- 7.2.3. Supermarket/Hypermarket
- 7.2.4. Others
- 7.1. Market Analysis, Insights and Forecast - by Confectionery Variant
- 8. South America APAC Snack Bar Market Analysis, Insights and Forecast, 2020-2032
- 8.1. Market Analysis, Insights and Forecast - by Confectionery Variant
- 8.1.1. Cereal Bar
- 8.1.2. Fruit & Nut Bar
- 8.1.3. Protein Bar
- 8.2. Market Analysis, Insights and Forecast - by Distribution Channel
- 8.2.1. Convenience Store
- 8.2.2. Online Retail Store
- 8.2.3. Supermarket/Hypermarket
- 8.2.4. Others
- 8.1. Market Analysis, Insights and Forecast - by Confectionery Variant
- 9. Europe APAC Snack Bar Market Analysis, Insights and Forecast, 2020-2032
- 9.1. Market Analysis, Insights and Forecast - by Confectionery Variant
- 9.1.1. Cereal Bar
- 9.1.2. Fruit & Nut Bar
- 9.1.3. Protein Bar
- 9.2. Market Analysis, Insights and Forecast - by Distribution Channel
- 9.2.1. Convenience Store
- 9.2.2. Online Retail Store
- 9.2.3. Supermarket/Hypermarket
- 9.2.4. Others
- 9.1. Market Analysis, Insights and Forecast - by Confectionery Variant
- 10. Middle East & Africa APAC Snack Bar Market Analysis, Insights and Forecast, 2020-2032
- 10.1. Market Analysis, Insights and Forecast - by Confectionery Variant
- 10.1.1. Cereal Bar
- 10.1.2. Fruit & Nut Bar
- 10.1.3. Protein Bar
- 10.2. Market Analysis, Insights and Forecast - by Distribution Channel
- 10.2.1. Convenience Store
- 10.2.2. Online Retail Store
- 10.2.3. Supermarket/Hypermarket
- 10.2.4. Others
- 10.1. Market Analysis, Insights and Forecast - by Confectionery Variant
- 11. Asia Pacific APAC Snack Bar Market Analysis, Insights and Forecast, 2020-2032
- 11.1. Market Analysis, Insights and Forecast - by Confectionery Variant
- 11.1.1. Cereal Bar
- 11.1.2. Fruit & Nut Bar
- 11.1.3. Protein Bar
- 11.2. Market Analysis, Insights and Forecast - by Distribution Channel
- 11.2.1. Convenience Store
- 11.2.2. Online Retail Store
- 11.2.3. Supermarket/Hypermarket
- 11.2.4. Others
- 11.1. Market Analysis, Insights and Forecast - by Confectionery Variant
- 12. Competitive Analysis
- 12.1. Company Profiles
- 12.1.1 Nestlé SA
- 12.1.1.1. Company Overview
- 12.1.1.2. Products
- 12.1.1.3. Company Financials
- 12.1.1.4. SWOT Analysis
- 12.1.2 Post Holdings Inc
- 12.1.2.1. Company Overview
- 12.1.2.2. Products
- 12.1.2.3. Company Financials
- 12.1.2.4. SWOT Analysis
- 12.1.3 Asahi Group Holdings Ltd
- 12.1.3.1. Company Overview
- 12.1.3.2. Products
- 12.1.3.3. Company Financials
- 12.1.3.4. SWOT Analysis
- 12.1.4 Simply Good Foods Co
- 12.1.4.1. Company Overview
- 12.1.4.2. Products
- 12.1.4.3. Company Financials
- 12.1.4.4. SWOT Analysis
- 12.1.5 General Mills Inc
- 12.1.5.1. Company Overview
- 12.1.5.2. Products
- 12.1.5.3. Company Financials
- 12.1.5.4. SWOT Analysis
- 12.1.6 PepsiCo Inc
- 12.1.6.1. Company Overview
- 12.1.6.2. Products
- 12.1.6.3. Company Financials
- 12.1.6.4. SWOT Analysis
- 12.1.7 Lotus Bakeries
- 12.1.7.1. Company Overview
- 12.1.7.2. Products
- 12.1.7.3. Company Financials
- 12.1.7.4. SWOT Analysis
- 12.1.8 Morinaga & Co Ltd
- 12.1.8.1. Company Overview
- 12.1.8.2. Products
- 12.1.8.3. Company Financials
- 12.1.8.4. SWOT Analysis
- 12.1.9 Bagrrys India Private Limited
- 12.1.9.1. Company Overview
- 12.1.9.2. Products
- 12.1.9.3. Company Financials
- 12.1.9.4. SWOT Analysis
- 12.1.10 Carman's Fine Foods Pty Ltd
- 12.1.10.1. Company Overview
- 12.1.10.2. Products
- 12.1.10.3. Company Financials
- 12.1.10.4. SWOT Analysis
- 12.1.11 Ferrero International SA
- 12.1.11.1. Company Overview
- 12.1.11.2. Products
- 12.1.11.3. Company Financials
- 12.1.11.4. SWOT Analysis
- 12.1.12 Naturell India Pvt Ltd
- 12.1.12.1. Company Overview
- 12.1.12.2. Products
- 12.1.12.3. Company Financials
- 12.1.12.4. SWOT Analysis
- 12.1.13 Mars Incorporated
- 12.1.13.1. Company Overview
- 12.1.13.2. Products
- 12.1.13.3. Company Financials
- 12.1.13.4. SWOT Analysis
- 12.1.14 Otsuka Holdings Co Ltd
- 12.1.14.1. Company Overview
- 12.1.14.2. Products
- 12.1.14.3. Company Financials
- 12.1.14.4. SWOT Analysis
- 12.1.15 Mondelēz International Inc
- 12.1.15.1. Company Overview
- 12.1.15.2. Products
- 12.1.15.3. Company Financials
- 12.1.15.4. SWOT Analysis
- 12.1.16 Amway International Inc
- 12.1.16.1. Company Overview
- 12.1.16.2. Products
- 12.1.16.3. Company Financials
- 12.1.16.4. SWOT Analysis
- 12.1.17 Kellogg Company
- 12.1.17.1. Company Overview
- 12.1.17.2. Products
- 12.1.17.3. Company Financials
- 12.1.17.4. SWOT Analysis
- 12.1.1 Nestlé SA
- 12.2. Market Entropy
- 12.2.1 Company's Key Areas Served
- 12.2.2 Recent Developments
- 12.3. Company Market Share Analysis 2025
- 12.3.1 Top 5 Companies Market Share Analysis
- 12.3.2 Top 3 Companies Market Share Analysis
- 12.4. List of Potential Customers
- 13. Research Methodology
List of Figures
- Figure 1: Global APAC Snack Bar Market Revenue Breakdown (Million, %) by Region 2025 & 2033
- Figure 2: Global APAC Snack Bar Market Volume Breakdown (K Tons, %) by Region 2025 & 2033
- Figure 3: North America APAC Snack Bar Market Revenue (Million), by Confectionery Variant 2025 & 2033
- Figure 4: North America APAC Snack Bar Market Volume (K Tons), by Confectionery Variant 2025 & 2033
- Figure 5: North America APAC Snack Bar Market Revenue Share (%), by Confectionery Variant 2025 & 2033
- Figure 6: North America APAC Snack Bar Market Volume Share (%), by Confectionery Variant 2025 & 2033
- Figure 7: North America APAC Snack Bar Market Revenue (Million), by Distribution Channel 2025 & 2033
- Figure 8: North America APAC Snack Bar Market Volume (K Tons), by Distribution Channel 2025 & 2033
- Figure 9: North America APAC Snack Bar Market Revenue Share (%), by Distribution Channel 2025 & 2033
- Figure 10: North America APAC Snack Bar Market Volume Share (%), by Distribution Channel 2025 & 2033
- Figure 11: North America APAC Snack Bar Market Revenue (Million), by Country 2025 & 2033
- Figure 12: North America APAC Snack Bar Market Volume (K Tons), by Country 2025 & 2033
- Figure 13: North America APAC Snack Bar Market Revenue Share (%), by Country 2025 & 2033
- Figure 14: North America APAC Snack Bar Market Volume Share (%), by Country 2025 & 2033
- Figure 15: South America APAC Snack Bar Market Revenue (Million), by Confectionery Variant 2025 & 2033
- Figure 16: South America APAC Snack Bar Market Volume (K Tons), by Confectionery Variant 2025 & 2033
- Figure 17: South America APAC Snack Bar Market Revenue Share (%), by Confectionery Variant 2025 & 2033
- Figure 18: South America APAC Snack Bar Market Volume Share (%), by Confectionery Variant 2025 & 2033
- Figure 19: South America APAC Snack Bar Market Revenue (Million), by Distribution Channel 2025 & 2033
- Figure 20: South America APAC Snack Bar Market Volume (K Tons), by Distribution Channel 2025 & 2033
- Figure 21: South America APAC Snack Bar Market Revenue Share (%), by Distribution Channel 2025 & 2033
- Figure 22: South America APAC Snack Bar Market Volume Share (%), by Distribution Channel 2025 & 2033
- Figure 23: South America APAC Snack Bar Market Revenue (Million), by Country 2025 & 2033
- Figure 24: South America APAC Snack Bar Market Volume (K Tons), by Country 2025 & 2033
- Figure 25: South America APAC Snack Bar Market Revenue Share (%), by Country 2025 & 2033
- Figure 26: South America APAC Snack Bar Market Volume Share (%), by Country 2025 & 2033
- Figure 27: Europe APAC Snack Bar Market Revenue (Million), by Confectionery Variant 2025 & 2033
- Figure 28: Europe APAC Snack Bar Market Volume (K Tons), by Confectionery Variant 2025 & 2033
- Figure 29: Europe APAC Snack Bar Market Revenue Share (%), by Confectionery Variant 2025 & 2033
- Figure 30: Europe APAC Snack Bar Market Volume Share (%), by Confectionery Variant 2025 & 2033
- Figure 31: Europe APAC Snack Bar Market Revenue (Million), by Distribution Channel 2025 & 2033
- Figure 32: Europe APAC Snack Bar Market Volume (K Tons), by Distribution Channel 2025 & 2033
- Figure 33: Europe APAC Snack Bar Market Revenue Share (%), by Distribution Channel 2025 & 2033
- Figure 34: Europe APAC Snack Bar Market Volume Share (%), by Distribution Channel 2025 & 2033
- Figure 35: Europe APAC Snack Bar Market Revenue (Million), by Country 2025 & 2033
- Figure 36: Europe APAC Snack Bar Market Volume (K Tons), by Country 2025 & 2033
- Figure 37: Europe APAC Snack Bar Market Revenue Share (%), by Country 2025 & 2033
- Figure 38: Europe APAC Snack Bar Market Volume Share (%), by Country 2025 & 2033
- Figure 39: Middle East & Africa APAC Snack Bar Market Revenue (Million), by Confectionery Variant 2025 & 2033
- Figure 40: Middle East & Africa APAC Snack Bar Market Volume (K Tons), by Confectionery Variant 2025 & 2033
- Figure 41: Middle East & Africa APAC Snack Bar Market Revenue Share (%), by Confectionery Variant 2025 & 2033
- Figure 42: Middle East & Africa APAC Snack Bar Market Volume Share (%), by Confectionery Variant 2025 & 2033
- Figure 43: Middle East & Africa APAC Snack Bar Market Revenue (Million), by Distribution Channel 2025 & 2033
- Figure 44: Middle East & Africa APAC Snack Bar Market Volume (K Tons), by Distribution Channel 2025 & 2033
- Figure 45: Middle East & Africa APAC Snack Bar Market Revenue Share (%), by Distribution Channel 2025 & 2033
- Figure 46: Middle East & Africa APAC Snack Bar Market Volume Share (%), by Distribution Channel 2025 & 2033
- Figure 47: Middle East & Africa APAC Snack Bar Market Revenue (Million), by Country 2025 & 2033
- Figure 48: Middle East & Africa APAC Snack Bar Market Volume (K Tons), by Country 2025 & 2033
- Figure 49: Middle East & Africa APAC Snack Bar Market Revenue Share (%), by Country 2025 & 2033
- Figure 50: Middle East & Africa APAC Snack Bar Market Volume Share (%), by Country 2025 & 2033
- Figure 51: Asia Pacific APAC Snack Bar Market Revenue (Million), by Confectionery Variant 2025 & 2033
- Figure 52: Asia Pacific APAC Snack Bar Market Volume (K Tons), by Confectionery Variant 2025 & 2033
- Figure 53: Asia Pacific APAC Snack Bar Market Revenue Share (%), by Confectionery Variant 2025 & 2033
- Figure 54: Asia Pacific APAC Snack Bar Market Volume Share (%), by Confectionery Variant 2025 & 2033
- Figure 55: Asia Pacific APAC Snack Bar Market Revenue (Million), by Distribution Channel 2025 & 2033
- Figure 56: Asia Pacific APAC Snack Bar Market Volume (K Tons), by Distribution Channel 2025 & 2033
- Figure 57: Asia Pacific APAC Snack Bar Market Revenue Share (%), by Distribution Channel 2025 & 2033
- Figure 58: Asia Pacific APAC Snack Bar Market Volume Share (%), by Distribution Channel 2025 & 2033
- Figure 59: Asia Pacific APAC Snack Bar Market Revenue (Million), by Country 2025 & 2033
- Figure 60: Asia Pacific APAC Snack Bar Market Volume (K Tons), by Country 2025 & 2033
- Figure 61: Asia Pacific APAC Snack Bar Market Revenue Share (%), by Country 2025 & 2033
- Figure 62: Asia Pacific APAC Snack Bar Market Volume Share (%), by Country 2025 & 2033
List of Tables
- Table 1: Global APAC Snack Bar Market Revenue Million Forecast, by Confectionery Variant 2020 & 2033
- Table 2: Global APAC Snack Bar Market Volume K Tons Forecast, by Confectionery Variant 2020 & 2033
- Table 3: Global APAC Snack Bar Market Revenue Million Forecast, by Distribution Channel 2020 & 2033
- Table 4: Global APAC Snack Bar Market Volume K Tons Forecast, by Distribution Channel 2020 & 2033
- Table 5: Global APAC Snack Bar Market Revenue Million Forecast, by Region 2020 & 2033
- Table 6: Global APAC Snack Bar Market Volume K Tons Forecast, by Region 2020 & 2033
- Table 7: Global APAC Snack Bar Market Revenue Million Forecast, by Confectionery Variant 2020 & 2033
- Table 8: Global APAC Snack Bar Market Volume K Tons Forecast, by Confectionery Variant 2020 & 2033
- Table 9: Global APAC Snack Bar Market Revenue Million Forecast, by Distribution Channel 2020 & 2033
- Table 10: Global APAC Snack Bar Market Volume K Tons Forecast, by Distribution Channel 2020 & 2033
- Table 11: Global APAC Snack Bar Market Revenue Million Forecast, by Country 2020 & 2033
- Table 12: Global APAC Snack Bar Market Volume K Tons Forecast, by Country 2020 & 2033
- Table 13: United States APAC Snack Bar Market Revenue (Million) Forecast, by Application 2020 & 2033
- Table 14: United States APAC Snack Bar Market Volume (K Tons) Forecast, by Application 2020 & 2033
- Table 15: Canada APAC Snack Bar Market Revenue (Million) Forecast, by Application 2020 & 2033
- Table 16: Canada APAC Snack Bar Market Volume (K Tons) Forecast, by Application 2020 & 2033
- Table 17: Mexico APAC Snack Bar Market Revenue (Million) Forecast, by Application 2020 & 2033
- Table 18: Mexico APAC Snack Bar Market Volume (K Tons) Forecast, by Application 2020 & 2033
- Table 19: Global APAC Snack Bar Market Revenue Million Forecast, by Confectionery Variant 2020 & 2033
- Table 20: Global APAC Snack Bar Market Volume K Tons Forecast, by Confectionery Variant 2020 & 2033
- Table 21: Global APAC Snack Bar Market Revenue Million Forecast, by Distribution Channel 2020 & 2033
- Table 22: Global APAC Snack Bar Market Volume K Tons Forecast, by Distribution Channel 2020 & 2033
- Table 23: Global APAC Snack Bar Market Revenue Million Forecast, by Country 2020 & 2033
- Table 24: Global APAC Snack Bar Market Volume K Tons Forecast, by Country 2020 & 2033
- Table 25: Brazil APAC Snack Bar Market Revenue (Million) Forecast, by Application 2020 & 2033
- Table 26: Brazil APAC Snack Bar Market Volume (K Tons) Forecast, by Application 2020 & 2033
- Table 27: Argentina APAC Snack Bar Market Revenue (Million) Forecast, by Application 2020 & 2033
- Table 28: Argentina APAC Snack Bar Market Volume (K Tons) Forecast, by Application 2020 & 2033
- Table 29: Rest of South America APAC Snack Bar Market Revenue (Million) Forecast, by Application 2020 & 2033
- Table 30: Rest of South America APAC Snack Bar Market Volume (K Tons) Forecast, by Application 2020 & 2033
- Table 31: Global APAC Snack Bar Market Revenue Million Forecast, by Confectionery Variant 2020 & 2033
- Table 32: Global APAC Snack Bar Market Volume K Tons Forecast, by Confectionery Variant 2020 & 2033
- Table 33: Global APAC Snack Bar Market Revenue Million Forecast, by Distribution Channel 2020 & 2033
- Table 34: Global APAC Snack Bar Market Volume K Tons Forecast, by Distribution Channel 2020 & 2033
- Table 35: Global APAC Snack Bar Market Revenue Million Forecast, by Country 2020 & 2033
- Table 36: Global APAC Snack Bar Market Volume K Tons Forecast, by Country 2020 & 2033
- Table 37: United Kingdom APAC Snack Bar Market Revenue (Million) Forecast, by Application 2020 & 2033
- Table 38: United Kingdom APAC Snack Bar Market Volume (K Tons) Forecast, by Application 2020 & 2033
- Table 39: Germany APAC Snack Bar Market Revenue (Million) Forecast, by Application 2020 & 2033
- Table 40: Germany APAC Snack Bar Market Volume (K Tons) Forecast, by Application 2020 & 2033
- Table 41: France APAC Snack Bar Market Revenue (Million) Forecast, by Application 2020 & 2033
- Table 42: France APAC Snack Bar Market Volume (K Tons) Forecast, by Application 2020 & 2033
- Table 43: Italy APAC Snack Bar Market Revenue (Million) Forecast, by Application 2020 & 2033
- Table 44: Italy APAC Snack Bar Market Volume (K Tons) Forecast, by Application 2020 & 2033
- Table 45: Spain APAC Snack Bar Market Revenue (Million) Forecast, by Application 2020 & 2033
- Table 46: Spain APAC Snack Bar Market Volume (K Tons) Forecast, by Application 2020 & 2033
- Table 47: Russia APAC Snack Bar Market Revenue (Million) Forecast, by Application 2020 & 2033
- Table 48: Russia APAC Snack Bar Market Volume (K Tons) Forecast, by Application 2020 & 2033
- Table 49: Benelux APAC Snack Bar Market Revenue (Million) Forecast, by Application 2020 & 2033
- Table 50: Benelux APAC Snack Bar Market Volume (K Tons) Forecast, by Application 2020 & 2033
- Table 51: Nordics APAC Snack Bar Market Revenue (Million) Forecast, by Application 2020 & 2033
- Table 52: Nordics APAC Snack Bar Market Volume (K Tons) Forecast, by Application 2020 & 2033
- Table 53: Rest of Europe APAC Snack Bar Market Revenue (Million) Forecast, by Application 2020 & 2033
- Table 54: Rest of Europe APAC Snack Bar Market Volume (K Tons) Forecast, by Application 2020 & 2033
- Table 55: Global APAC Snack Bar Market Revenue Million Forecast, by Confectionery Variant 2020 & 2033
- Table 56: Global APAC Snack Bar Market Volume K Tons Forecast, by Confectionery Variant 2020 & 2033
- Table 57: Global APAC Snack Bar Market Revenue Million Forecast, by Distribution Channel 2020 & 2033
- Table 58: Global APAC Snack Bar Market Volume K Tons Forecast, by Distribution Channel 2020 & 2033
- Table 59: Global APAC Snack Bar Market Revenue Million Forecast, by Country 2020 & 2033
- Table 60: Global APAC Snack Bar Market Volume K Tons Forecast, by Country 2020 & 2033
- Table 61: Turkey APAC Snack Bar Market Revenue (Million) Forecast, by Application 2020 & 2033
- Table 62: Turkey APAC Snack Bar Market Volume (K Tons) Forecast, by Application 2020 & 2033
- Table 63: Israel APAC Snack Bar Market Revenue (Million) Forecast, by Application 2020 & 2033
- Table 64: Israel APAC Snack Bar Market Volume (K Tons) Forecast, by Application 2020 & 2033
- Table 65: GCC APAC Snack Bar Market Revenue (Million) Forecast, by Application 2020 & 2033
- Table 66: GCC APAC Snack Bar Market Volume (K Tons) Forecast, by Application 2020 & 2033
- Table 67: North Africa APAC Snack Bar Market Revenue (Million) Forecast, by Application 2020 & 2033
- Table 68: North Africa APAC Snack Bar Market Volume (K Tons) Forecast, by Application 2020 & 2033
- Table 69: South Africa APAC Snack Bar Market Revenue (Million) Forecast, by Application 2020 & 2033
- Table 70: South Africa APAC Snack Bar Market Volume (K Tons) Forecast, by Application 2020 & 2033
- Table 71: Rest of Middle East & Africa APAC Snack Bar Market Revenue (Million) Forecast, by Application 2020 & 2033
- Table 72: Rest of Middle East & Africa APAC Snack Bar Market Volume (K Tons) Forecast, by Application 2020 & 2033
- Table 73: Global APAC Snack Bar Market Revenue Million Forecast, by Confectionery Variant 2020 & 2033
- Table 74: Global APAC Snack Bar Market Volume K Tons Forecast, by Confectionery Variant 2020 & 2033
- Table 75: Global APAC Snack Bar Market Revenue Million Forecast, by Distribution Channel 2020 & 2033
- Table 76: Global APAC Snack Bar Market Volume K Tons Forecast, by Distribution Channel 2020 & 2033
- Table 77: Global APAC Snack Bar Market Revenue Million Forecast, by Country 2020 & 2033
- Table 78: Global APAC Snack Bar Market Volume K Tons Forecast, by Country 2020 & 2033
- Table 79: China APAC Snack Bar Market Revenue (Million) Forecast, by Application 2020 & 2033
- Table 80: China APAC Snack Bar Market Volume (K Tons) Forecast, by Application 2020 & 2033
- Table 81: India APAC Snack Bar Market Revenue (Million) Forecast, by Application 2020 & 2033
- Table 82: India APAC Snack Bar Market Volume (K Tons) Forecast, by Application 2020 & 2033
- Table 83: Japan APAC Snack Bar Market Revenue (Million) Forecast, by Application 2020 & 2033
- Table 84: Japan APAC Snack Bar Market Volume (K Tons) Forecast, by Application 2020 & 2033
- Table 85: South Korea APAC Snack Bar Market Revenue (Million) Forecast, by Application 2020 & 2033
- Table 86: South Korea APAC Snack Bar Market Volume (K Tons) Forecast, by Application 2020 & 2033
- Table 87: ASEAN APAC Snack Bar Market Revenue (Million) Forecast, by Application 2020 & 2033
- Table 88: ASEAN APAC Snack Bar Market Volume (K Tons) Forecast, by Application 2020 & 2033
- Table 89: Oceania APAC Snack Bar Market Revenue (Million) Forecast, by Application 2020 & 2033
- Table 90: Oceania APAC Snack Bar Market Volume (K Tons) Forecast, by Application 2020 & 2033
- Table 91: Rest of Asia Pacific APAC Snack Bar Market Revenue (Million) Forecast, by Application 2020 & 2033
- Table 92: Rest of Asia Pacific APAC Snack Bar Market Volume (K Tons) Forecast, by Application 2020 & 2033
Frequently Asked Questions
1. What is the projected Compound Annual Growth Rate (CAGR) of the APAC Snack Bar Market?
The projected CAGR is approximately 4.12%.
2. Which companies are prominent players in the APAC Snack Bar Market?
Key companies in the market include Nestlé SA, Post Holdings Inc, Asahi Group Holdings Ltd, Simply Good Foods Co, General Mills Inc, PepsiCo Inc, Lotus Bakeries, Morinaga & Co Ltd, Bagrrys India Private Limited, Carman's Fine Foods Pty Ltd, Ferrero International SA, Naturell India Pvt Ltd, Mars Incorporated, Otsuka Holdings Co Ltd, Mondelēz International Inc, Amway International Inc, Kellogg Company.
3. What are the main segments of the APAC Snack Bar Market?
The market segments include Confectionery Variant, Distribution Channel.
4. Can you provide details about the market size?
The market size is estimated to be USD 26040 Million as of 2022.
5. What are some drivers contributing to market growth?
Popularity of Convenient and On the Go Snacking Options; Product Differentiation Playing a Key Role in Market Expansion.
6. What are the notable trends driving market growth?
Growing awareness regarding health-oriented products is likely to boost the segment’s sales.
7. Are there any restraints impacting market growth?
Associated Health Risks; Easy Availability of Healthy Substitutes.
8. Can you provide examples of recent developments in the market?
May 2023: Nestle’s Milo launched a protein snack bar offering 6 g of protein and a source of fiber. These protein snack bars retail at USD 8 for 180 g or six bars and are available in Coles and independent grocers across Australia.May 2023: Uncle Tobys unveiled a protein muesli bar in four new flavors. The muesli bar is made with 20% protein, i.e., 7 g of protein per bar, comes in multipacks of 5, and can be found in supermarkets for RRP AUD 6.70. The bars are available in flavors like Caramel and Dark Choc, Raspberry, Goji and White Choc, Lemon with a Yoghurty Drizzle, and Double Choc.March 2023: Bagrrys India Private Limited announced the launch of The Mighty Muesli Bars, which are all-natural, healthy, and packed with multi-grains, nuts, fruits, and honey with a punch of high fiber.
9. What pricing options are available for accessing the report?
Pricing options include single-user, multi-user, and enterprise licenses priced at USD 3800, USD 4500, and USD 5800 respectively.
10. Is the market size provided in terms of value or volume?
The market size is provided in terms of value, measured in Million and volume, measured in K Tons.
11. Are there any specific market keywords associated with the report?
Yes, the market keyword associated with the report is "APAC Snack Bar Market," which aids in identifying and referencing the specific market segment covered.
12. How do I determine which pricing option suits my needs best?
The pricing options vary based on user requirements and access needs. Individual users may opt for single-user licenses, while businesses requiring broader access may choose multi-user or enterprise licenses for cost-effective access to the report.
13. Are there any additional resources or data provided in the APAC Snack Bar Market report?
While the report offers comprehensive insights, it's advisable to review the specific contents or supplementary materials provided to ascertain if additional resources or data are available.
14. How can I stay updated on further developments or reports in the APAC Snack Bar Market?
To stay informed about further developments, trends, and reports in the APAC Snack Bar Market, consider subscribing to industry newsletters, following relevant companies and organizations, or regularly checking reputable industry news sources and publications.
Methodology
Step 1 - Identification of Relevant Samples Size from Population Database


Step 2 - Approaches for Defining Global Market Size (Value, Volume* & Price*)

Note*: In applicable scenarios
Step 3 - Data Sources
Primary Research
- Web Analytics
- Survey Reports
- Research Institute
- Latest Research Reports
- Opinion Leaders
Secondary Research
- Annual Reports
- White Paper
- Latest Press Release
- Industry Association
- Paid Database
- Investor Presentations

Step 4 - Data Triangulation
Involves using different sources of information in order to increase the validity of a study
These sources are likely to be stakeholders in a program - participants, other researchers, program staff, other community members, and so on.
Then we put all data in single framework & apply various statistical tools to find out the dynamic on the market.
During the analysis stage, feedback from the stakeholder groups would be compared to determine areas of agreement as well as areas of divergence