

Key Insights
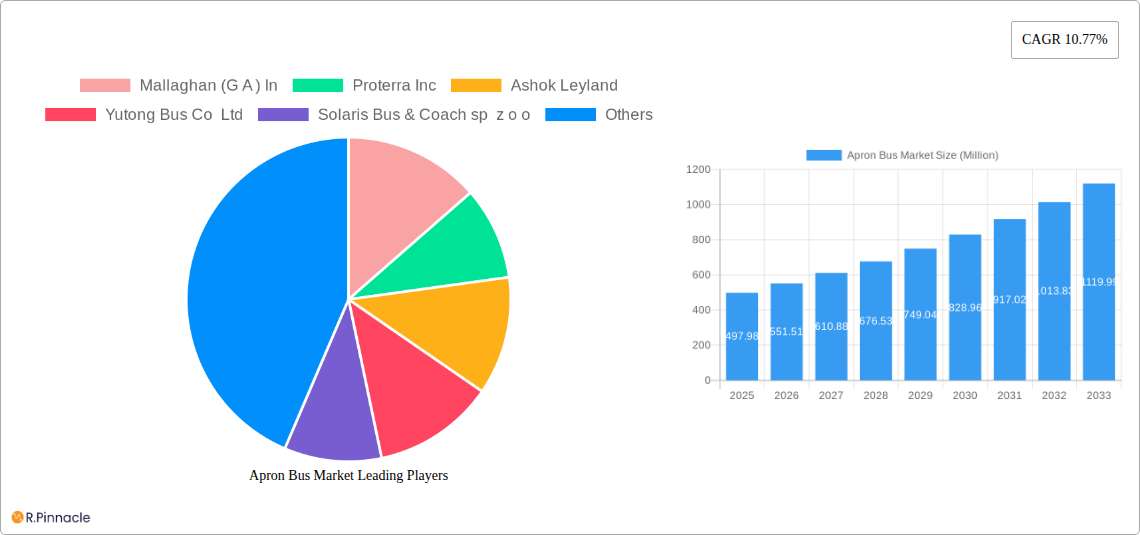
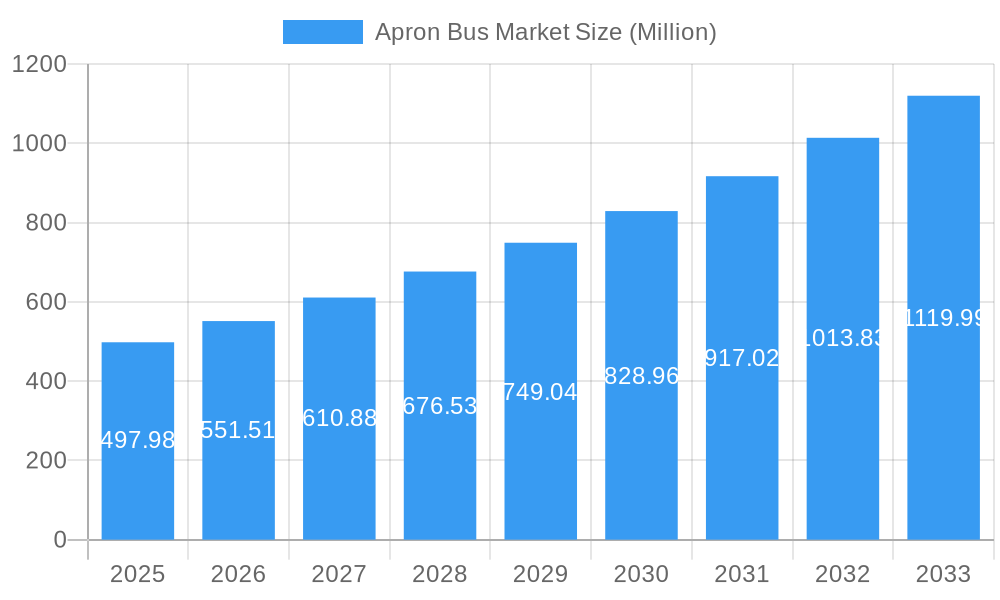
The global apron bus market, valued at $497.98 million in 2025, is projected to experience robust growth, driven by a Compound Annual Growth Rate (CAGR) of 10.77% from 2025 to 2033. This expansion is fueled by several key factors. Firstly, the increasing passenger traffic at airports globally necessitates efficient and reliable ground transportation solutions, boosting demand for apron buses. Secondly, the growing adoption of electric and hybrid apron buses is contributing to market growth, driven by environmental concerns and government regulations promoting sustainable transportation. Furthermore, advancements in bus technology, such as improved safety features, enhanced passenger comfort, and efficient fuel consumption, are also contributing factors. The market is segmented by fuel type (electric and diesel), with the electric segment anticipated to witness significant growth due to its environmental benefits and potential cost savings in the long run. Major players like Proterra, Ashok Leyland, and BYD are actively contributing to innovation and market expansion through their diverse product offerings and strategic partnerships. Geographical expansion, particularly in developing economies with burgeoning air travel sectors, is another significant driver.
Apron Bus Market Market Size (In Million)
However, the market faces certain challenges. The high initial investment cost associated with electric apron buses and the limited availability of charging infrastructure in some regions could hinder widespread adoption. Furthermore, fluctuations in fuel prices and economic uncertainties could impact market growth in the short term. Despite these restraints, the long-term outlook for the apron bus market remains positive, driven by the continuous expansion of air travel, a growing preference for sustainable transportation, and ongoing technological advancements. The competitive landscape is characterized by both established players and emerging companies, fostering innovation and competition within the market. This dynamic interplay between technological progress, regulatory pressures, and market demand will shape the future trajectory of the apron bus market.
Apron Bus Market Company Market Share
Apron Bus Market: A Comprehensive Report (2019-2033)
This comprehensive report provides an in-depth analysis of the global Apron Bus Market, offering invaluable insights for industry professionals, investors, and stakeholders. The study period covers 2019-2033, with 2025 as the base and estimated year. The report forecasts market trends from 2025-2033, analyzing historical data from 2019-2024. The market is segmented by type (Electric, Diesel), offering a granular understanding of market dynamics across different vehicle types. The report values the market in Millions.
Apron Bus Market Structure & Innovation Trends
This section analyzes the competitive landscape, encompassing market concentration, innovation drivers, regulatory frameworks, product substitutes, end-user demographics, and M&A activities. Key players such as Mallaghan (G A ) In, Proterra Inc, Ashok Leyland, Yutong Bus Co Ltd, Solaris Bus & Coach sp z o o, Xiamen King Long International Trading Co Ltd, TAM - EUROPE, AB Volvo (Volvo Group), COBUS Industries GmbH, BYD Company Ltd, and Xinfa Airport Equipment Ltd shape the market.
- Market Concentration: The market exhibits a moderately concentrated structure, with the top 5 players holding approximately xx% of the market share in 2025. This is expected to xx slightly by 2033 due to the entry of new players and increased competition.
- Innovation Drivers: Stringent emission regulations and growing environmental concerns are key drivers of innovation, particularly in the development of electric apron buses. Technological advancements in battery technology and charging infrastructure are further accelerating market growth.
- Regulatory Frameworks: Government regulations concerning emissions and safety standards significantly influence market dynamics. Variations in regulatory frameworks across different regions impact market penetration and product adoption rates.
- Product Substitutes: Traditional diesel buses are the primary substitute for electric apron buses, although their market share is predicted to decline due to rising fuel costs and environmental concerns.
- End-User Demographics: Airports of varying sizes and passenger volumes form the key end-user segment. Larger international airports are expected to drive higher demand.
- M&A Activities: The market has witnessed xx M&A deals in the past five years, with a total deal value of approximately $xx Million. These activities reflect strategic consolidation within the industry and the pursuit of technological advancements.
Apron Bus Market Dynamics & Trends
This section explores the key factors influencing market growth, including technological advancements, evolving consumer preferences, competitive dynamics, and macroeconomic conditions. The global apron bus market is projected to experience a Compound Annual Growth Rate (CAGR) of xx% during the forecast period (2025-2033).
Market penetration of electric apron buses is steadily increasing, driven by government incentives and a heightened focus on sustainability within the aviation sector. Technological disruptions, such as the development of high-capacity batteries and advanced charging technologies, are crucial factors influencing the adoption of electric models. Competitive dynamics are characterized by intense rivalry among established players and the emergence of new entrants, driving innovation and price competition. Consumer preferences are shifting towards environmentally friendly and technologically advanced vehicles, influencing product development strategies and market trends.
Dominant Regions & Segments in Apron Bus Market
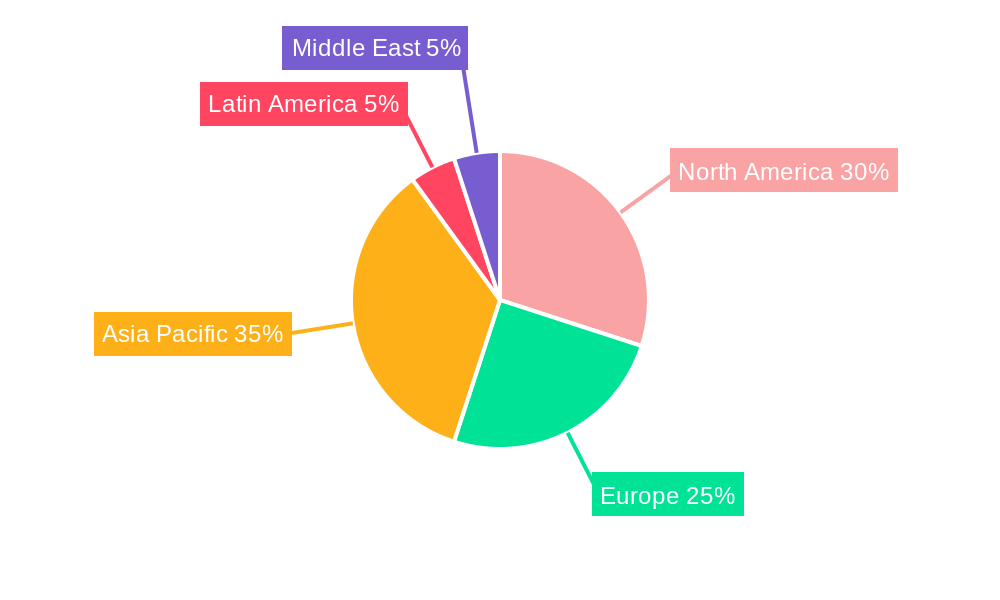
North America is currently the leading region in the apron bus market, driven by significant investments in airport infrastructure and strong demand for electric buses. However, Asia-Pacific is expected to witness the highest growth rate during the forecast period due to rapid airport expansion and increasing government support for sustainable transportation initiatives.
Key Drivers for North America:
- Robust airport infrastructure development
- Stringent emission regulations
- Growing adoption of electric vehicles
- High disposable income levels
Key Drivers for Asia-Pacific:
- Rapid airport expansion projects
- Government incentives for electric vehicle adoption
- Increasing environmental awareness
- Growing tourism sector
Dominant Segment (Type): The electric apron bus segment is projected to dominate the market in 2033, driven by government regulations and sustainability initiatives within the aviation sector.
Apron Bus Market Product Innovations
Recent product innovations focus on improving energy efficiency, passenger comfort, and operational reliability. Technological advancements in battery technology, charging infrastructure, and autonomous driving capabilities are shaping the future of apron bus design. The market is witnessing the introduction of electric apron buses with extended ranges and enhanced passenger capacities, catering to the growing demand for sustainable and efficient airport transportation solutions. These innovations improve operational efficiency and reduce environmental impact, increasing their market fit.
Report Scope & Segmentation Analysis
This report segments the apron bus market by type:
Electric Apron Buses: This segment is characterized by high growth potential, driven by environmental concerns and government regulations. The market size is projected to reach $xx Million by 2033. Competitive dynamics are intense, with companies focusing on innovation and cost optimization.
Diesel Apron Buses: This segment is expected to decline gradually due to increasing environmental concerns and the growing popularity of electric alternatives. However, it will still retain a significant market share in 2033, especially in regions with limited infrastructure for electric vehicle charging.
Key Drivers of Apron Bus Market Growth
The apron bus market is driven by a combination of factors: increasing passenger traffic at airports, the need for efficient ground transportation, stringent environmental regulations promoting electric vehicle adoption, and government initiatives supporting sustainable transportation. Technological advancements, particularly in battery technology and charging infrastructure, are also key drivers. The increasing focus on reducing carbon emissions within the aviation sector further accelerates the demand for electric apron buses.
Challenges in the Apron Bus Market Sector
The apron bus market faces challenges including high initial investment costs for electric buses, limited charging infrastructure in some regions, and competition from traditional diesel buses. Supply chain disruptions can impact production timelines and costs. Furthermore, navigating diverse regulatory frameworks across different countries can present operational complexities. These factors could collectively restrain market growth to an extent.
Emerging Opportunities in Apron Bus Market
Emerging opportunities lie in the expansion of charging infrastructure, the development of autonomous driving capabilities for apron buses, and the penetration of new markets in developing countries. The integration of smart technologies and data analytics can further optimize operational efficiency and enhance the passenger experience. Exploring partnerships with airport operators and other stakeholders can unlock significant growth potential.
Leading Players in the Apron Bus Market Market
Key Developments in Apron Bus Market Industry
- July 2023: Busnex launched the 'DinoBus', a fully electric airport apron bus with a range of up to 150 km and a capacity of 120 passengers. This launch reflects the growing focus on decarbonization within the aviation industry.
- August 2023: LSP Plus Corporation secured a five-year contract for parking and shuttle operations at Eppley Airport (OMA), potentially impacting the demand for apron buses within the airport's operations.
Future Outlook for Apron Bus Market Market
The future of the apron bus market is promising, driven by the sustained growth of the aviation industry, increased focus on sustainability, and ongoing technological advancements. Strategic partnerships, expansion into new markets, and continuous product innovation will be crucial for success in this dynamic market. The market is poised for significant growth, propelled by the rising adoption of electric vehicles and the increasing need for efficient airport ground transportation.
Apron Bus Market Segmentation
- 1. Production Analysis
- 2. Consumption Analysis
- 3. Import Market Analysis (Value & Volume)
- 4. Export Market Analysis (Value & Volume)
- 5. Price Trend Analysis
Apron Bus Market Segmentation By Geography
-
1. North America
- 1.1. United States
- 1.2. Canada
- 1.3. Mexico
-
2. South America
- 2.1. Brazil
- 2.2. Argentina
- 2.3. Rest of South America
-
3. Europe
- 3.1. United Kingdom
- 3.2. Germany
- 3.3. France
- 3.4. Italy
- 3.5. Spain
- 3.6. Russia
- 3.7. Benelux
- 3.8. Nordics
- 3.9. Rest of Europe
-
4. Middle East & Africa
- 4.1. Turkey
- 4.2. Israel
- 4.3. GCC
- 4.4. North Africa
- 4.5. South Africa
- 4.6. Rest of Middle East & Africa
-
5. Asia Pacific
- 5.1. China
- 5.2. India
- 5.3. Japan
- 5.4. South Korea
- 5.5. ASEAN
- 5.6. Oceania
- 5.7. Rest of Asia Pacific
Apron Bus Market Regional Market Share
Geographic Coverage of Apron Bus Market
Apron Bus Market REPORT HIGHLIGHTS
| Aspects | Details |
|---|---|
| Study Period | 2020-2034 |
| Base Year | 2025 |
| Estimated Year | 2026 |
| Forecast Period | 2026-2034 |
| Historical Period | 2020-2025 |
| Growth Rate | CAGR of 10.77% from 2020-2034 |
| Segmentation |
|
Table of Contents
- 1. Introduction
- 1.1. Research Scope
- 1.2. Market Segmentation
- 1.3. Research Objective
- 1.4. Definitions and Assumptions
- 2. Executive Summary
- 2.1. Market Snapshot
- 3. Market Dynamics
- 3.1. Market Drivers
- 3.2. Market Restrains
- 3.3. Market Trends
- 3.4. Market Opportunities
- 4. Market Factor Analysis
- 4.1. Porters Five Forces
- 4.1.1. Bargaining Power of Suppliers
- 4.1.2. Bargaining Power of Buyers
- 4.1.3. Threat of New Entrants
- 4.1.4. Threat of Substitutes
- 4.1.5. Competitive Rivalry
- 4.2. PESTEL analysis
- 4.3. BCG Analysis
- 4.3.1. Stars (High Growth, High Market Share)
- 4.3.2. Cash Cows (Low Growth, High Market Share)
- 4.3.3. Question Mark (High Growth, Low Market Share)
- 4.3.4. Dogs (Low Growth, Low Market Share)
- 4.4. Ansoff Matrix Analysis
- 4.5. Supply Chain Analysis
- 4.6. Regulatory Landscape
- 4.7. Current Market Potential and Opportunity Assessment (TAM–SAM–SOM Framework)
- 4.8. PRI Analyst Note
- 4.1. Porters Five Forces
- 5. Market Analysis, Insights and Forecast 2021-2033
- 5.1. Market Analysis, Insights and Forecast - by Production Analysis
- 5.2. Market Analysis, Insights and Forecast - by Consumption Analysis
- 5.3. Market Analysis, Insights and Forecast - by Import Market Analysis (Value & Volume)
- 5.4. Market Analysis, Insights and Forecast - by Export Market Analysis (Value & Volume)
- 5.5. Market Analysis, Insights and Forecast - by Price Trend Analysis
- 5.6. Market Analysis, Insights and Forecast - by Region
- 5.6.1. North America
- 5.6.2. South America
- 5.6.3. Europe
- 5.6.4. Middle East & Africa
- 5.6.5. Asia Pacific
- 6. Global Apron Bus Market Analysis, Insights and Forecast, 2021-2033
- 6.1. Market Analysis, Insights and Forecast - by Production Analysis
- 6.2. Market Analysis, Insights and Forecast - by Consumption Analysis
- 6.3. Market Analysis, Insights and Forecast - by Import Market Analysis (Value & Volume)
- 6.4. Market Analysis, Insights and Forecast - by Export Market Analysis (Value & Volume)
- 6.5. Market Analysis, Insights and Forecast - by Price Trend Analysis
- 7. North America Apron Bus Market Analysis, Insights and Forecast, 2020-2032
- 7.1. Market Analysis, Insights and Forecast - by Production Analysis
- 7.2. Market Analysis, Insights and Forecast - by Consumption Analysis
- 7.3. Market Analysis, Insights and Forecast - by Import Market Analysis (Value & Volume)
- 7.4. Market Analysis, Insights and Forecast - by Export Market Analysis (Value & Volume)
- 7.5. Market Analysis, Insights and Forecast - by Price Trend Analysis
- 8. South America Apron Bus Market Analysis, Insights and Forecast, 2020-2032
- 8.1. Market Analysis, Insights and Forecast - by Production Analysis
- 8.2. Market Analysis, Insights and Forecast - by Consumption Analysis
- 8.3. Market Analysis, Insights and Forecast - by Import Market Analysis (Value & Volume)
- 8.4. Market Analysis, Insights and Forecast - by Export Market Analysis (Value & Volume)
- 8.5. Market Analysis, Insights and Forecast - by Price Trend Analysis
- 9. Europe Apron Bus Market Analysis, Insights and Forecast, 2020-2032
- 9.1. Market Analysis, Insights and Forecast - by Production Analysis
- 9.2. Market Analysis, Insights and Forecast - by Consumption Analysis
- 9.3. Market Analysis, Insights and Forecast - by Import Market Analysis (Value & Volume)
- 9.4. Market Analysis, Insights and Forecast - by Export Market Analysis (Value & Volume)
- 9.5. Market Analysis, Insights and Forecast - by Price Trend Analysis
- 10. Middle East & Africa Apron Bus Market Analysis, Insights and Forecast, 2020-2032
- 10.1. Market Analysis, Insights and Forecast - by Production Analysis
- 10.2. Market Analysis, Insights and Forecast - by Consumption Analysis
- 10.3. Market Analysis, Insights and Forecast - by Import Market Analysis (Value & Volume)
- 10.4. Market Analysis, Insights and Forecast - by Export Market Analysis (Value & Volume)
- 10.5. Market Analysis, Insights and Forecast - by Price Trend Analysis
- 11. Asia Pacific Apron Bus Market Analysis, Insights and Forecast, 2020-2032
- 11.1. Market Analysis, Insights and Forecast - by Production Analysis
- 11.2. Market Analysis, Insights and Forecast - by Consumption Analysis
- 11.3. Market Analysis, Insights and Forecast - by Import Market Analysis (Value & Volume)
- 11.4. Market Analysis, Insights and Forecast - by Export Market Analysis (Value & Volume)
- 11.5. Market Analysis, Insights and Forecast - by Price Trend Analysis
- 12. Competitive Analysis
- 12.1. Company Profiles
- 12.1.1 Mallaghan (G A ) In
- 12.1.1.1. Company Overview
- 12.1.1.2. Products
- 12.1.1.3. Company Financials
- 12.1.1.4. SWOT Analysis
- 12.1.2 Proterra Inc
- 12.1.2.1. Company Overview
- 12.1.2.2. Products
- 12.1.2.3. Company Financials
- 12.1.2.4. SWOT Analysis
- 12.1.3 Ashok Leyland
- 12.1.3.1. Company Overview
- 12.1.3.2. Products
- 12.1.3.3. Company Financials
- 12.1.3.4. SWOT Analysis
- 12.1.4 Yutong Bus Co Ltd
- 12.1.4.1. Company Overview
- 12.1.4.2. Products
- 12.1.4.3. Company Financials
- 12.1.4.4. SWOT Analysis
- 12.1.5 Solaris Bus & Coach sp z o o
- 12.1.5.1. Company Overview
- 12.1.5.2. Products
- 12.1.5.3. Company Financials
- 12.1.5.4. SWOT Analysis
- 12.1.6 Xiamen King Long International Trading Co Ltd
- 12.1.6.1. Company Overview
- 12.1.6.2. Products
- 12.1.6.3. Company Financials
- 12.1.6.4. SWOT Analysis
- 12.1.7 TAM - EUROPE
- 12.1.7.1. Company Overview
- 12.1.7.2. Products
- 12.1.7.3. Company Financials
- 12.1.7.4. SWOT Analysis
- 12.1.8 AB Volvo (Volvo Group)
- 12.1.8.1. Company Overview
- 12.1.8.2. Products
- 12.1.8.3. Company Financials
- 12.1.8.4. SWOT Analysis
- 12.1.9 COBUS Industries GmbH
- 12.1.9.1. Company Overview
- 12.1.9.2. Products
- 12.1.9.3. Company Financials
- 12.1.9.4. SWOT Analysis
- 12.1.10 BYD Company Ltd
- 12.1.10.1. Company Overview
- 12.1.10.2. Products
- 12.1.10.3. Company Financials
- 12.1.10.4. SWOT Analysis
- 12.1.11 Xinfa Airport Equipment Ltd
- 12.1.11.1. Company Overview
- 12.1.11.2. Products
- 12.1.11.3. Company Financials
- 12.1.11.4. SWOT Analysis
- 12.1.1 Mallaghan (G A ) In
- 12.2. Market Entropy
- 12.2.1 Company's Key Areas Served
- 12.2.2 Recent Developments
- 12.3. Company Market Share Analysis 2025
- 12.3.1 Top 5 Companies Market Share Analysis
- 12.3.2 Top 3 Companies Market Share Analysis
- 12.4. List of Potential Customers
- 13. Research Methodology
List of Figures
- Figure 1: Global Apron Bus Market Revenue Breakdown (million, %) by Region 2025 & 2033
- Figure 2: North America Apron Bus Market Revenue (million), by Production Analysis 2025 & 2033
- Figure 3: North America Apron Bus Market Revenue Share (%), by Production Analysis 2025 & 2033
- Figure 4: North America Apron Bus Market Revenue (million), by Consumption Analysis 2025 & 2033
- Figure 5: North America Apron Bus Market Revenue Share (%), by Consumption Analysis 2025 & 2033
- Figure 6: North America Apron Bus Market Revenue (million), by Import Market Analysis (Value & Volume) 2025 & 2033
- Figure 7: North America Apron Bus Market Revenue Share (%), by Import Market Analysis (Value & Volume) 2025 & 2033
- Figure 8: North America Apron Bus Market Revenue (million), by Export Market Analysis (Value & Volume) 2025 & 2033
- Figure 9: North America Apron Bus Market Revenue Share (%), by Export Market Analysis (Value & Volume) 2025 & 2033
- Figure 10: North America Apron Bus Market Revenue (million), by Price Trend Analysis 2025 & 2033
- Figure 11: North America Apron Bus Market Revenue Share (%), by Price Trend Analysis 2025 & 2033
- Figure 12: North America Apron Bus Market Revenue (million), by Country 2025 & 2033
- Figure 13: North America Apron Bus Market Revenue Share (%), by Country 2025 & 2033
- Figure 14: South America Apron Bus Market Revenue (million), by Production Analysis 2025 & 2033
- Figure 15: South America Apron Bus Market Revenue Share (%), by Production Analysis 2025 & 2033
- Figure 16: South America Apron Bus Market Revenue (million), by Consumption Analysis 2025 & 2033
- Figure 17: South America Apron Bus Market Revenue Share (%), by Consumption Analysis 2025 & 2033
- Figure 18: South America Apron Bus Market Revenue (million), by Import Market Analysis (Value & Volume) 2025 & 2033
- Figure 19: South America Apron Bus Market Revenue Share (%), by Import Market Analysis (Value & Volume) 2025 & 2033
- Figure 20: South America Apron Bus Market Revenue (million), by Export Market Analysis (Value & Volume) 2025 & 2033
- Figure 21: South America Apron Bus Market Revenue Share (%), by Export Market Analysis (Value & Volume) 2025 & 2033
- Figure 22: South America Apron Bus Market Revenue (million), by Price Trend Analysis 2025 & 2033
- Figure 23: South America Apron Bus Market Revenue Share (%), by Price Trend Analysis 2025 & 2033
- Figure 24: South America Apron Bus Market Revenue (million), by Country 2025 & 2033
- Figure 25: South America Apron Bus Market Revenue Share (%), by Country 2025 & 2033
- Figure 26: Europe Apron Bus Market Revenue (million), by Production Analysis 2025 & 2033
- Figure 27: Europe Apron Bus Market Revenue Share (%), by Production Analysis 2025 & 2033
- Figure 28: Europe Apron Bus Market Revenue (million), by Consumption Analysis 2025 & 2033
- Figure 29: Europe Apron Bus Market Revenue Share (%), by Consumption Analysis 2025 & 2033
- Figure 30: Europe Apron Bus Market Revenue (million), by Import Market Analysis (Value & Volume) 2025 & 2033
- Figure 31: Europe Apron Bus Market Revenue Share (%), by Import Market Analysis (Value & Volume) 2025 & 2033
- Figure 32: Europe Apron Bus Market Revenue (million), by Export Market Analysis (Value & Volume) 2025 & 2033
- Figure 33: Europe Apron Bus Market Revenue Share (%), by Export Market Analysis (Value & Volume) 2025 & 2033
- Figure 34: Europe Apron Bus Market Revenue (million), by Price Trend Analysis 2025 & 2033
- Figure 35: Europe Apron Bus Market Revenue Share (%), by Price Trend Analysis 2025 & 2033
- Figure 36: Europe Apron Bus Market Revenue (million), by Country 2025 & 2033
- Figure 37: Europe Apron Bus Market Revenue Share (%), by Country 2025 & 2033
- Figure 38: Middle East & Africa Apron Bus Market Revenue (million), by Production Analysis 2025 & 2033
- Figure 39: Middle East & Africa Apron Bus Market Revenue Share (%), by Production Analysis 2025 & 2033
- Figure 40: Middle East & Africa Apron Bus Market Revenue (million), by Consumption Analysis 2025 & 2033
- Figure 41: Middle East & Africa Apron Bus Market Revenue Share (%), by Consumption Analysis 2025 & 2033
- Figure 42: Middle East & Africa Apron Bus Market Revenue (million), by Import Market Analysis (Value & Volume) 2025 & 2033
- Figure 43: Middle East & Africa Apron Bus Market Revenue Share (%), by Import Market Analysis (Value & Volume) 2025 & 2033
- Figure 44: Middle East & Africa Apron Bus Market Revenue (million), by Export Market Analysis (Value & Volume) 2025 & 2033
- Figure 45: Middle East & Africa Apron Bus Market Revenue Share (%), by Export Market Analysis (Value & Volume) 2025 & 2033
- Figure 46: Middle East & Africa Apron Bus Market Revenue (million), by Price Trend Analysis 2025 & 2033
- Figure 47: Middle East & Africa Apron Bus Market Revenue Share (%), by Price Trend Analysis 2025 & 2033
- Figure 48: Middle East & Africa Apron Bus Market Revenue (million), by Country 2025 & 2033
- Figure 49: Middle East & Africa Apron Bus Market Revenue Share (%), by Country 2025 & 2033
- Figure 50: Asia Pacific Apron Bus Market Revenue (million), by Production Analysis 2025 & 2033
- Figure 51: Asia Pacific Apron Bus Market Revenue Share (%), by Production Analysis 2025 & 2033
- Figure 52: Asia Pacific Apron Bus Market Revenue (million), by Consumption Analysis 2025 & 2033
- Figure 53: Asia Pacific Apron Bus Market Revenue Share (%), by Consumption Analysis 2025 & 2033
- Figure 54: Asia Pacific Apron Bus Market Revenue (million), by Import Market Analysis (Value & Volume) 2025 & 2033
- Figure 55: Asia Pacific Apron Bus Market Revenue Share (%), by Import Market Analysis (Value & Volume) 2025 & 2033
- Figure 56: Asia Pacific Apron Bus Market Revenue (million), by Export Market Analysis (Value & Volume) 2025 & 2033
- Figure 57: Asia Pacific Apron Bus Market Revenue Share (%), by Export Market Analysis (Value & Volume) 2025 & 2033
- Figure 58: Asia Pacific Apron Bus Market Revenue (million), by Price Trend Analysis 2025 & 2033
- Figure 59: Asia Pacific Apron Bus Market Revenue Share (%), by Price Trend Analysis 2025 & 2033
- Figure 60: Asia Pacific Apron Bus Market Revenue (million), by Country 2025 & 2033
- Figure 61: Asia Pacific Apron Bus Market Revenue Share (%), by Country 2025 & 2033
List of Tables
- Table 1: Global Apron Bus Market Revenue million Forecast, by Production Analysis 2020 & 2033
- Table 2: Global Apron Bus Market Revenue million Forecast, by Consumption Analysis 2020 & 2033
- Table 3: Global Apron Bus Market Revenue million Forecast, by Import Market Analysis (Value & Volume) 2020 & 2033
- Table 4: Global Apron Bus Market Revenue million Forecast, by Export Market Analysis (Value & Volume) 2020 & 2033
- Table 5: Global Apron Bus Market Revenue million Forecast, by Price Trend Analysis 2020 & 2033
- Table 6: Global Apron Bus Market Revenue million Forecast, by Region 2020 & 2033
- Table 7: Global Apron Bus Market Revenue million Forecast, by Production Analysis 2020 & 2033
- Table 8: Global Apron Bus Market Revenue million Forecast, by Consumption Analysis 2020 & 2033
- Table 9: Global Apron Bus Market Revenue million Forecast, by Import Market Analysis (Value & Volume) 2020 & 2033
- Table 10: Global Apron Bus Market Revenue million Forecast, by Export Market Analysis (Value & Volume) 2020 & 2033
- Table 11: Global Apron Bus Market Revenue million Forecast, by Price Trend Analysis 2020 & 2033
- Table 12: Global Apron Bus Market Revenue million Forecast, by Country 2020 & 2033
- Table 13: United States Apron Bus Market Revenue (million) Forecast, by Application 2020 & 2033
- Table 14: Canada Apron Bus Market Revenue (million) Forecast, by Application 2020 & 2033
- Table 15: Mexico Apron Bus Market Revenue (million) Forecast, by Application 2020 & 2033
- Table 16: Global Apron Bus Market Revenue million Forecast, by Production Analysis 2020 & 2033
- Table 17: Global Apron Bus Market Revenue million Forecast, by Consumption Analysis 2020 & 2033
- Table 18: Global Apron Bus Market Revenue million Forecast, by Import Market Analysis (Value & Volume) 2020 & 2033
- Table 19: Global Apron Bus Market Revenue million Forecast, by Export Market Analysis (Value & Volume) 2020 & 2033
- Table 20: Global Apron Bus Market Revenue million Forecast, by Price Trend Analysis 2020 & 2033
- Table 21: Global Apron Bus Market Revenue million Forecast, by Country 2020 & 2033
- Table 22: Brazil Apron Bus Market Revenue (million) Forecast, by Application 2020 & 2033
- Table 23: Argentina Apron Bus Market Revenue (million) Forecast, by Application 2020 & 2033
- Table 24: Rest of South America Apron Bus Market Revenue (million) Forecast, by Application 2020 & 2033
- Table 25: Global Apron Bus Market Revenue million Forecast, by Production Analysis 2020 & 2033
- Table 26: Global Apron Bus Market Revenue million Forecast, by Consumption Analysis 2020 & 2033
- Table 27: Global Apron Bus Market Revenue million Forecast, by Import Market Analysis (Value & Volume) 2020 & 2033
- Table 28: Global Apron Bus Market Revenue million Forecast, by Export Market Analysis (Value & Volume) 2020 & 2033
- Table 29: Global Apron Bus Market Revenue million Forecast, by Price Trend Analysis 2020 & 2033
- Table 30: Global Apron Bus Market Revenue million Forecast, by Country 2020 & 2033
- Table 31: United Kingdom Apron Bus Market Revenue (million) Forecast, by Application 2020 & 2033
- Table 32: Germany Apron Bus Market Revenue (million) Forecast, by Application 2020 & 2033
- Table 33: France Apron Bus Market Revenue (million) Forecast, by Application 2020 & 2033
- Table 34: Italy Apron Bus Market Revenue (million) Forecast, by Application 2020 & 2033
- Table 35: Spain Apron Bus Market Revenue (million) Forecast, by Application 2020 & 2033
- Table 36: Russia Apron Bus Market Revenue (million) Forecast, by Application 2020 & 2033
- Table 37: Benelux Apron Bus Market Revenue (million) Forecast, by Application 2020 & 2033
- Table 38: Nordics Apron Bus Market Revenue (million) Forecast, by Application 2020 & 2033
- Table 39: Rest of Europe Apron Bus Market Revenue (million) Forecast, by Application 2020 & 2033
- Table 40: Global Apron Bus Market Revenue million Forecast, by Production Analysis 2020 & 2033
- Table 41: Global Apron Bus Market Revenue million Forecast, by Consumption Analysis 2020 & 2033
- Table 42: Global Apron Bus Market Revenue million Forecast, by Import Market Analysis (Value & Volume) 2020 & 2033
- Table 43: Global Apron Bus Market Revenue million Forecast, by Export Market Analysis (Value & Volume) 2020 & 2033
- Table 44: Global Apron Bus Market Revenue million Forecast, by Price Trend Analysis 2020 & 2033
- Table 45: Global Apron Bus Market Revenue million Forecast, by Country 2020 & 2033
- Table 46: Turkey Apron Bus Market Revenue (million) Forecast, by Application 2020 & 2033
- Table 47: Israel Apron Bus Market Revenue (million) Forecast, by Application 2020 & 2033
- Table 48: GCC Apron Bus Market Revenue (million) Forecast, by Application 2020 & 2033
- Table 49: North Africa Apron Bus Market Revenue (million) Forecast, by Application 2020 & 2033
- Table 50: South Africa Apron Bus Market Revenue (million) Forecast, by Application 2020 & 2033
- Table 51: Rest of Middle East & Africa Apron Bus Market Revenue (million) Forecast, by Application 2020 & 2033
- Table 52: Global Apron Bus Market Revenue million Forecast, by Production Analysis 2020 & 2033
- Table 53: Global Apron Bus Market Revenue million Forecast, by Consumption Analysis 2020 & 2033
- Table 54: Global Apron Bus Market Revenue million Forecast, by Import Market Analysis (Value & Volume) 2020 & 2033
- Table 55: Global Apron Bus Market Revenue million Forecast, by Export Market Analysis (Value & Volume) 2020 & 2033
- Table 56: Global Apron Bus Market Revenue million Forecast, by Price Trend Analysis 2020 & 2033
- Table 57: Global Apron Bus Market Revenue million Forecast, by Country 2020 & 2033
- Table 58: China Apron Bus Market Revenue (million) Forecast, by Application 2020 & 2033
- Table 59: India Apron Bus Market Revenue (million) Forecast, by Application 2020 & 2033
- Table 60: Japan Apron Bus Market Revenue (million) Forecast, by Application 2020 & 2033
- Table 61: South Korea Apron Bus Market Revenue (million) Forecast, by Application 2020 & 2033
- Table 62: ASEAN Apron Bus Market Revenue (million) Forecast, by Application 2020 & 2033
- Table 63: Oceania Apron Bus Market Revenue (million) Forecast, by Application 2020 & 2033
- Table 64: Rest of Asia Pacific Apron Bus Market Revenue (million) Forecast, by Application 2020 & 2033
Frequently Asked Questions
1. What is the projected Compound Annual Growth Rate (CAGR) of the Apron Bus Market?
The projected CAGR is approximately 10.77%.
2. Which companies are prominent players in the Apron Bus Market?
Key companies in the market include Mallaghan (G A ) In, Proterra Inc, Ashok Leyland, Yutong Bus Co Ltd, Solaris Bus & Coach sp z o o, Xiamen King Long International Trading Co Ltd, TAM - EUROPE, AB Volvo (Volvo Group), COBUS Industries GmbH, BYD Company Ltd, Xinfa Airport Equipment Ltd.
3. What are the main segments of the Apron Bus Market?
The market segments include Production Analysis, Consumption Analysis, Import Market Analysis (Value & Volume), Export Market Analysis (Value & Volume), Price Trend Analysis.
4. Can you provide details about the market size?
The market size is estimated to be USD 551.61 million as of 2022.
5. What are some drivers contributing to market growth?
Increase in Internet of Things (IoT) and Autonomous Systems; Rise in Demand for Military and Defense Satellite Communication Solutions.
6. What are the notable trends driving market growth?
Electric Segment is Expected to Show Significant Growth During the Forecast Period.
7. Are there any restraints impacting market growth?
Cybersecurity Threats to Satellite Communication; Interference in Transmission of Data.
8. Can you provide examples of recent developments in the market?
August 2023: LSP Plus Corporation Announced a Five-Year Parking and Shuttle Operations Contract for the management of all public and employee parking facilities and public and employee shuttle service at Eppley Airport (OMA), US.
9. What pricing options are available for accessing the report?
Pricing options include single-user, multi-user, and enterprise licenses priced at USD 4750, USD 5250, and USD 8750 respectively.
10. Is the market size provided in terms of value or volume?
The market size is provided in terms of value, measured in million.
11. Are there any specific market keywords associated with the report?
Yes, the market keyword associated with the report is "Apron Bus Market," which aids in identifying and referencing the specific market segment covered.
12. How do I determine which pricing option suits my needs best?
The pricing options vary based on user requirements and access needs. Individual users may opt for single-user licenses, while businesses requiring broader access may choose multi-user or enterprise licenses for cost-effective access to the report.
13. Are there any additional resources or data provided in the Apron Bus Market report?
While the report offers comprehensive insights, it's advisable to review the specific contents or supplementary materials provided to ascertain if additional resources or data are available.
14. How can I stay updated on further developments or reports in the Apron Bus Market?
To stay informed about further developments, trends, and reports in the Apron Bus Market, consider subscribing to industry newsletters, following relevant companies and organizations, or regularly checking reputable industry news sources and publications.
Methodology
Step 1 - Identification of Relevant Samples Size from Population Database


Step 2 - Approaches for Defining Global Market Size (Value, Volume* & Price*)

Note*: In applicable scenarios
Step 3 - Data Sources
Primary Research
- Web Analytics
- Survey Reports
- Research Institute
- Latest Research Reports
- Opinion Leaders
Secondary Research
- Annual Reports
- White Paper
- Latest Press Release
- Industry Association
- Paid Database
- Investor Presentations

Step 4 - Data Triangulation
Involves using different sources of information in order to increase the validity of a study
These sources are likely to be stakeholders in a program - participants, other researchers, program staff, other community members, and so on.
Then we put all data in single framework & apply various statistical tools to find out the dynamic on the market.
During the analysis stage, feedback from the stakeholder groups would be compared to determine areas of agreement as well as areas of divergence