

Key Insights
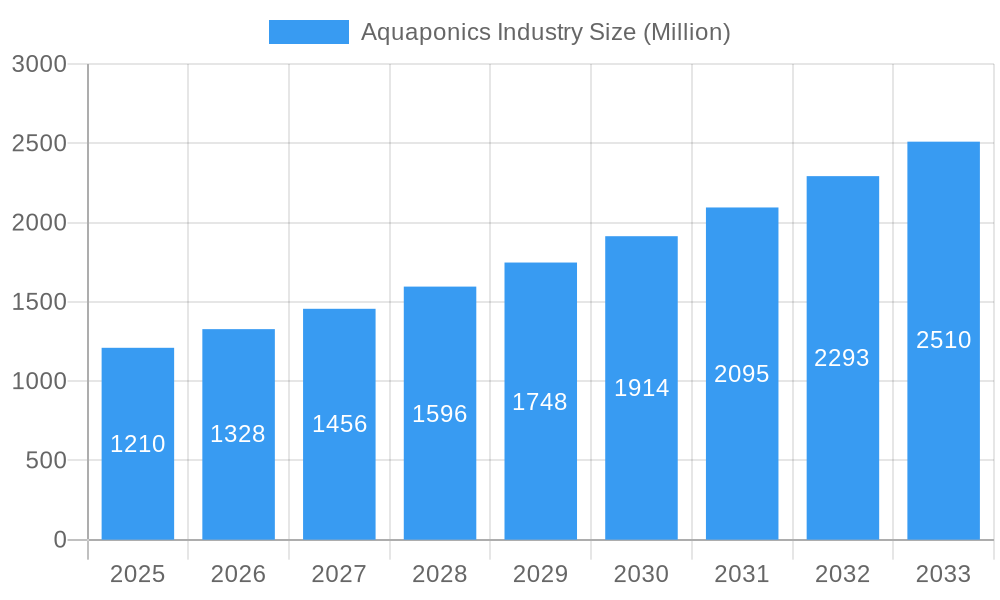
The global aquaponics market, valued at $1.21 billion in 2025, is experiencing robust growth, projected to expand at a Compound Annual Growth Rate (CAGR) of 9.60% from 2025 to 2033. This expansion is driven by several key factors. Increasing consumer demand for sustainable and locally sourced food is a major catalyst, pushing the adoption of aquaponics as an environmentally friendly and efficient food production method. Growing concerns about food security and the need for resilient agricultural systems further fuel market growth. Technological advancements, including automation and precision control systems in aquaponics facilities, are improving efficiency and yields, making it more attractive to both large-scale commercial operations and smaller-scale urban farms. Furthermore, government initiatives promoting sustainable agriculture and aquaculture are providing support and incentives, fostering market expansion. The diverse range of applications, from producing high-value fish like tilapia and trout to cultivating various vegetables in controlled environments, also contributes to the market's dynamism. Different growing systems like Nutrient Film Technique (NFT) and Deep Water Culture (DWC), and facility types including poly greenhouses and indoor vertical farms cater to various needs and scales of operation.
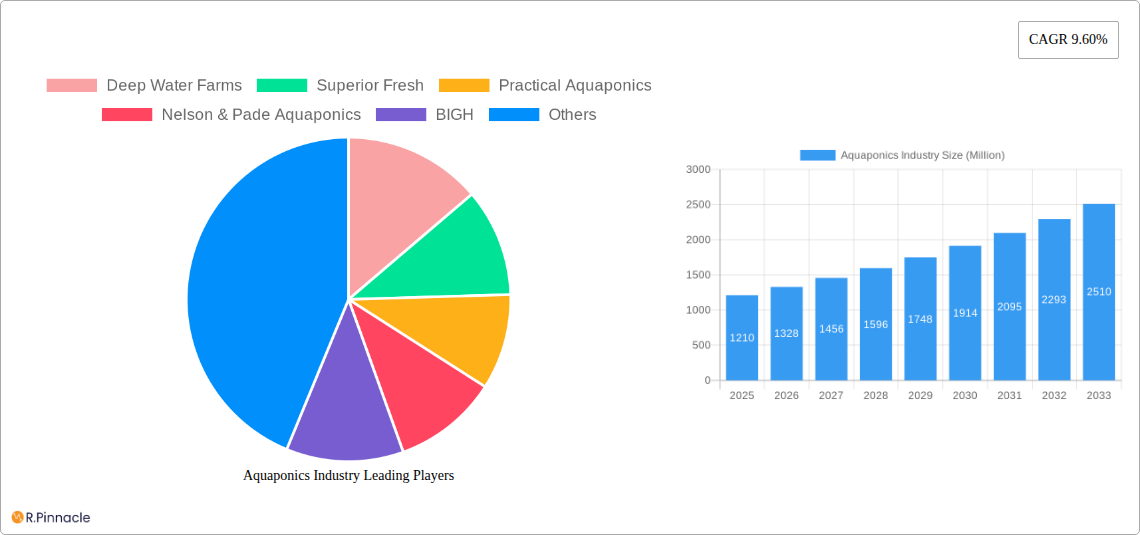
Aquaponics Industry Market Size (In Billion)
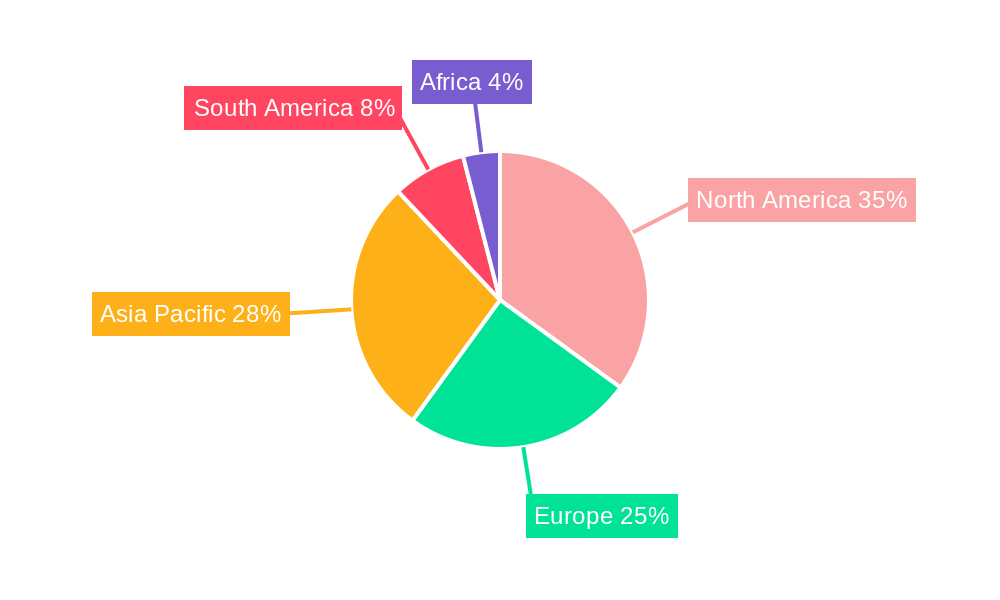
Segment-wise, the market is witnessing strong growth in indoor vertical farms, driven by the potential for year-round production in urban areas and reduced land requirements. Tilapia and Catfish remain dominant in the fish type segment due to their adaptability and market demand. While North America currently holds a significant market share, the Asia-Pacific region is poised for rapid expansion due to increasing population and rising disposable incomes, coupled with supportive government policies promoting sustainable food production. However, high initial investment costs for setting up aquaponic systems and the need for specialized knowledge and technical expertise can pose challenges to market penetration. Despite these restraints, the overall outlook for the aquaponics market remains positive, with significant growth potential across various segments and geographic regions. The market is expected to exceed $2.5 billion by 2033, driven by continuous innovation and increasing consumer awareness.
Aquaponics Industry Company Market Share
Aquaponics Industry Market Report: A Comprehensive Analysis (2019-2033)
This comprehensive report provides an in-depth analysis of the Aquaponics industry, projecting a market value exceeding $XX Million by 2033. The study covers the period from 2019 to 2033, with 2025 serving as both the base and estimated year. It offers invaluable insights for industry professionals, investors, and stakeholders seeking to navigate this rapidly evolving sector. Our analysis encompasses key segments, including various growing systems, facility types, fish types, and dominant regions, providing a granular understanding of market dynamics and future opportunities.
Aquaponics Industry Market Structure & Innovation Trends
This section analyzes the competitive landscape, highlighting market concentration, innovation drivers, and regulatory influences impacting the $XX Million Aquaponics market. We examine mergers and acquisitions (M&A) activity, assessing deal values and their impact on market share distribution. Key players such as Deep Water Farms, Superior Fresh, Practical Aquaponics, and Nelson & Pade Aquaponics, contribute significantly to market dynamics.
- Market Concentration: The market exhibits a [Describe concentration: e.g., moderately fragmented structure] with the top 5 players holding an estimated XX% market share in 2025.
- Innovation Drivers: Technological advancements in water filtration, automated systems, and vertical farming techniques are key drivers of innovation.
- Regulatory Frameworks: Government regulations concerning water usage, waste management, and food safety significantly impact industry operations. Variations in regulations across different regions create unique challenges and opportunities.
- Product Substitutes: Traditional agriculture and hydroponics pose competitive challenges, while the unique selling proposition of aquaponics lies in its sustainable and integrated approach.
- End-User Demographics: Growing consumer demand for sustainable and locally sourced food is a major market driver, fueling the growth of the aquaponics sector.
- M&A Activities: The period 2019-2024 witnessed [Number] significant M&A deals, with a total estimated value of $XX Million, leading to increased market consolidation.
Aquaponics Industry Market Dynamics & Trends
This section delves into the market's growth trajectory, exploring key drivers, technological disruptions, evolving consumer preferences, and competitive dynamics. We project a Compound Annual Growth Rate (CAGR) of XX% during the forecast period (2025-2033), driven by several factors detailed below. Market penetration in [Specify region/segment] is projected to reach XX% by 2033.
[Insert a 600-word paragraph exploring market growth drivers such as increasing consumer demand for sustainable food, technological advancements, government support for sustainable agriculture, and rising awareness about environmental concerns. Discuss competitive dynamics, including pricing strategies, product differentiation, and market positioning. Include specific examples and data to support claims.]
Dominant Regions & Segments in Aquaponics Industry
This section identifies the leading regions, countries, and segments within the Aquaponics market. The analysis considers various factors contributing to the dominance of specific areas and market segments.
Dominant Regions: [Identify the dominant region and explain why (e.g., North America due to high consumer demand and technological advancements).]
- Key Drivers (North America):
- Strong consumer demand for sustainable and locally sourced food.
- Availability of funding and investment in sustainable agriculture technologies.
- Favorable government policies and regulations supporting aquaponics development.
- Robust infrastructure supporting logistics and supply chains.
Dominant Segments: [Analyze and identify the dominant segments for each category. For example, Tilapia may be dominant fish type, Ebb and Flow the dominant growing system etc. Justify with data and explanations.]
- Growing Systems: [Explain dominance, e.g., Ebb and Flow's dominance due to its simplicity and cost-effectiveness.]
- Facility Types: [Explain dominance, e.g., Poly greenhouses' dominance due to lower setup costs.]
- Fish Types: [Explain dominance, e.g., Tilapia's dominance due to its fast growth and suitability for aquaponics.]
[Continue with similar detailed analysis for each segment: NFT, Raft/DWC, Indoor Vertical Farms, Other Facility Types, Catfish, Carp, Trout, Ornamental Fish, Other Fish Types, and Media Filled Beds.]
Aquaponics Industry Product Innovations
Recent years have seen significant advancements in aquaponics technologies, focusing on automation, water efficiency, and disease prevention. New system designs improve yield and reduce labor costs, while advancements in sensor technology enable precise environmental control. These innovations are enhancing the overall efficiency and scalability of aquaponics systems, making them increasingly attractive to commercial producers and consumers. This drives market growth by lowering production costs and increasing crop yields.
Report Scope & Segmentation Analysis
This report provides a comprehensive segmentation of the aquaponics market, encompassing various growing systems (Ebb and Flow, NFT, DWC), facility types (poly/glass greenhouses, indoor vertical farms, others), fish types (Tilapia, Catfish, Carp, Trout, Ornamental Fish, others), and growing systems (Media Filled Beds, others). Each segment's growth projections, market size, and competitive dynamics are detailed in the full report.
[Insert paragraphs for each segment outlining growth projections, market sizes (in Millions), and competitive dynamics].
Key Drivers of Aquaponics Industry Growth
The aquaponics industry's expansion is fueled by several key factors: the growing global demand for sustainable and healthy food, technological advancements leading to increased efficiency and productivity, supportive government policies and incentives promoting sustainable agriculture, and rising consumer awareness of environmental concerns. These factors collectively contribute to a robust and expanding market.
Challenges in the Aquaponics Industry Sector
The Aquaponics industry faces challenges including stringent regulatory requirements concerning water quality and waste management, potential supply chain disruptions impacting the availability of essential inputs, and intense competition from established agricultural practices. These challenges can impact profitability and market growth, particularly for smaller players lacking the resources to overcome these hurdles.
Emerging Opportunities in Aquaponics Industry
Emerging opportunities lie in the expansion into new markets with a growing demand for sustainable food, such as developing countries and urban areas. Technological advancements in automation, vertical farming, and precision agriculture, along with increasing consumer preference for locally sourced and sustainable products, will shape future market growth.
Leading Players in the Aquaponics Industry Market
- Deep Water Farms
- Superior Fresh (If website is unavailable use only company name)
- Practical Aquaponics
- Nelson & Pade Aquaponics
- BIGH
- ECF Farm Berli
- Garden City Aquaponics Inc
- Aquaponics USA
- Madhavi Farms
- Ouroboros Farms
- Pentair Aquatic Eco-System Inc (PAES)
Key Developments in Aquaponics Industry Industry
- [Month, Year]: [Company Name] launched a new automated aquaponics system, increasing efficiency by XX%.
- [Month, Year]: A major merger between [Company A] and [Company B] reshaped the market landscape.
- [Month, Year]: New regulations regarding water usage impacted industry operations.
- [Add more bullet points with specific dates and impactful developments.]
Future Outlook for Aquaponics Industry Market
The future of the aquaponics market appears promising, driven by technological innovation, escalating demand for sustainable food production, and supportive government policies. Strategic investments in research and development, coupled with collaborations across the value chain, will play a pivotal role in unlocking the industry's full potential. Expanding into new markets and enhancing consumer awareness will be crucial for sustained growth.
Aquaponics Industry Segmentation
- 1. Production Analysis
- 2. Consumption Analysis
- 3. Import Market Analysis (Value & Volume)
- 4. Export Market Analysis (Value & Volume)
- 5. Price Trend Analysis
Aquaponics Industry Segmentation By Geography
-
1. North America
- 1.1. United States
- 1.2. Canada
- 1.3. Mexico
-
2. South America
- 2.1. Brazil
- 2.2. Argentina
- 2.3. Rest of South America
-
3. Europe
- 3.1. United Kingdom
- 3.2. Germany
- 3.3. France
- 3.4. Italy
- 3.5. Spain
- 3.6. Russia
- 3.7. Benelux
- 3.8. Nordics
- 3.9. Rest of Europe
-
4. Middle East & Africa
- 4.1. Turkey
- 4.2. Israel
- 4.3. GCC
- 4.4. North Africa
- 4.5. South Africa
- 4.6. Rest of Middle East & Africa
-
5. Asia Pacific
- 5.1. China
- 5.2. India
- 5.3. Japan
- 5.4. South Korea
- 5.5. ASEAN
- 5.6. Oceania
- 5.7. Rest of Asia Pacific
Aquaponics Industry Regional Market Share
Geographic Coverage of Aquaponics Industry
Aquaponics Industry REPORT HIGHLIGHTS
| Aspects | Details |
|---|---|
| Study Period | 2020-2034 |
| Base Year | 2025 |
| Estimated Year | 2026 |
| Forecast Period | 2026-2034 |
| Historical Period | 2020-2025 |
| Growth Rate | CAGR of 9.60% from 2020-2034 |
| Segmentation |
|
Table of Contents
- 1. Introduction
- 1.1. Research Scope
- 1.2. Market Segmentation
- 1.3. Research Objective
- 1.4. Definitions and Assumptions
- 2. Executive Summary
- 2.1. Market Snapshot
- 3. Market Dynamics
- 3.1. Market Drivers
- 3.2. Market Restrains
- 3.3. Market Trends
- 3.4. Market Opportunities
- 4. Market Factor Analysis
- 4.1. Porters Five Forces
- 4.1.1. Bargaining Power of Suppliers
- 4.1.2. Bargaining Power of Buyers
- 4.1.3. Threat of New Entrants
- 4.1.4. Threat of Substitutes
- 4.1.5. Competitive Rivalry
- 4.2. PESTEL analysis
- 4.3. BCG Analysis
- 4.3.1. Stars (High Growth, High Market Share)
- 4.3.2. Cash Cows (Low Growth, High Market Share)
- 4.3.3. Question Mark (High Growth, Low Market Share)
- 4.3.4. Dogs (Low Growth, Low Market Share)
- 4.4. Ansoff Matrix Analysis
- 4.5. Supply Chain Analysis
- 4.6. Regulatory Landscape
- 4.7. Current Market Potential and Opportunity Assessment (TAM–SAM–SOM Framework)
- 4.8. PRI Analyst Note
- 4.1. Porters Five Forces
- 5. Market Analysis, Insights and Forecast 2021-2033
- 5.1. Market Analysis, Insights and Forecast - by Production Analysis
- 5.2. Market Analysis, Insights and Forecast - by Consumption Analysis
- 5.3. Market Analysis, Insights and Forecast - by Import Market Analysis (Value & Volume)
- 5.4. Market Analysis, Insights and Forecast - by Export Market Analysis (Value & Volume)
- 5.5. Market Analysis, Insights and Forecast - by Price Trend Analysis
- 5.6. Market Analysis, Insights and Forecast - by Region
- 5.6.1. North America
- 5.6.2. South America
- 5.6.3. Europe
- 5.6.4. Middle East & Africa
- 5.6.5. Asia Pacific
- 6. Global Aquaponics Industry Analysis, Insights and Forecast, 2021-2033
- 6.1. Market Analysis, Insights and Forecast - by Production Analysis
- 6.2. Market Analysis, Insights and Forecast - by Consumption Analysis
- 6.3. Market Analysis, Insights and Forecast - by Import Market Analysis (Value & Volume)
- 6.4. Market Analysis, Insights and Forecast - by Export Market Analysis (Value & Volume)
- 6.5. Market Analysis, Insights and Forecast - by Price Trend Analysis
- 7. North America Aquaponics Industry Analysis, Insights and Forecast, 2020-2032
- 7.1. Market Analysis, Insights and Forecast - by Production Analysis
- 7.2. Market Analysis, Insights and Forecast - by Consumption Analysis
- 7.3. Market Analysis, Insights and Forecast - by Import Market Analysis (Value & Volume)
- 7.4. Market Analysis, Insights and Forecast - by Export Market Analysis (Value & Volume)
- 7.5. Market Analysis, Insights and Forecast - by Price Trend Analysis
- 8. South America Aquaponics Industry Analysis, Insights and Forecast, 2020-2032
- 8.1. Market Analysis, Insights and Forecast - by Production Analysis
- 8.2. Market Analysis, Insights and Forecast - by Consumption Analysis
- 8.3. Market Analysis, Insights and Forecast - by Import Market Analysis (Value & Volume)
- 8.4. Market Analysis, Insights and Forecast - by Export Market Analysis (Value & Volume)
- 8.5. Market Analysis, Insights and Forecast - by Price Trend Analysis
- 9. Europe Aquaponics Industry Analysis, Insights and Forecast, 2020-2032
- 9.1. Market Analysis, Insights and Forecast - by Production Analysis
- 9.2. Market Analysis, Insights and Forecast - by Consumption Analysis
- 9.3. Market Analysis, Insights and Forecast - by Import Market Analysis (Value & Volume)
- 9.4. Market Analysis, Insights and Forecast - by Export Market Analysis (Value & Volume)
- 9.5. Market Analysis, Insights and Forecast - by Price Trend Analysis
- 10. Middle East & Africa Aquaponics Industry Analysis, Insights and Forecast, 2020-2032
- 10.1. Market Analysis, Insights and Forecast - by Production Analysis
- 10.2. Market Analysis, Insights and Forecast - by Consumption Analysis
- 10.3. Market Analysis, Insights and Forecast - by Import Market Analysis (Value & Volume)
- 10.4. Market Analysis, Insights and Forecast - by Export Market Analysis (Value & Volume)
- 10.5. Market Analysis, Insights and Forecast - by Price Trend Analysis
- 11. Asia Pacific Aquaponics Industry Analysis, Insights and Forecast, 2020-2032
- 11.1. Market Analysis, Insights and Forecast - by Production Analysis
- 11.2. Market Analysis, Insights and Forecast - by Consumption Analysis
- 11.3. Market Analysis, Insights and Forecast - by Import Market Analysis (Value & Volume)
- 11.4. Market Analysis, Insights and Forecast - by Export Market Analysis (Value & Volume)
- 11.5. Market Analysis, Insights and Forecast - by Price Trend Analysis
- 12. Competitive Analysis
- 12.1. Company Profiles
- 12.1.1 Deep Water Farms
- 12.1.1.1. Company Overview
- 12.1.1.2. Products
- 12.1.1.3. Company Financials
- 12.1.1.4. SWOT Analysis
- 12.1.2 Superior Fresh
- 12.1.2.1. Company Overview
- 12.1.2.2. Products
- 12.1.2.3. Company Financials
- 12.1.2.4. SWOT Analysis
- 12.1.3 Practical Aquaponics
- 12.1.3.1. Company Overview
- 12.1.3.2. Products
- 12.1.3.3. Company Financials
- 12.1.3.4. SWOT Analysis
- 12.1.4 Nelson & Pade Aquaponics
- 12.1.4.1. Company Overview
- 12.1.4.2. Products
- 12.1.4.3. Company Financials
- 12.1.4.4. SWOT Analysis
- 12.1.5 BIGH
- 12.1.5.1. Company Overview
- 12.1.5.2. Products
- 12.1.5.3. Company Financials
- 12.1.5.4. SWOT Analysis
- 12.1.6 ECF Farm Berli
- 12.1.6.1. Company Overview
- 12.1.6.2. Products
- 12.1.6.3. Company Financials
- 12.1.6.4. SWOT Analysis
- 12.1.7 Garden City Aquaponics Inc
- 12.1.7.1. Company Overview
- 12.1.7.2. Products
- 12.1.7.3. Company Financials
- 12.1.7.4. SWOT Analysis
- 12.1.8 Aquaponics USA
- 12.1.8.1. Company Overview
- 12.1.8.2. Products
- 12.1.8.3. Company Financials
- 12.1.8.4. SWOT Analysis
- 12.1.9 Madhavi Farms
- 12.1.9.1. Company Overview
- 12.1.9.2. Products
- 12.1.9.3. Company Financials
- 12.1.9.4. SWOT Analysis
- 12.1.10 Ouroboros Farms
- 12.1.10.1. Company Overview
- 12.1.10.2. Products
- 12.1.10.3. Company Financials
- 12.1.10.4. SWOT Analysis
- 12.1.11 Pentair Aquatic Eco-System Inc (PAES)
- 12.1.11.1. Company Overview
- 12.1.11.2. Products
- 12.1.11.3. Company Financials
- 12.1.11.4. SWOT Analysis
- 12.1.1 Deep Water Farms
- 12.2. Market Entropy
- 12.2.1 Company's Key Areas Served
- 12.2.2 Recent Developments
- 12.3. Company Market Share Analysis 2025
- 12.3.1 Top 5 Companies Market Share Analysis
- 12.3.2 Top 3 Companies Market Share Analysis
- 12.4. List of Potential Customers
- 13. Research Methodology
List of Figures
- Figure 1: Global Aquaponics Industry Revenue Breakdown (Million, %) by Region 2025 & 2033
- Figure 2: North America Aquaponics Industry Revenue (Million), by Production Analysis 2025 & 2033
- Figure 3: North America Aquaponics Industry Revenue Share (%), by Production Analysis 2025 & 2033
- Figure 4: North America Aquaponics Industry Revenue (Million), by Consumption Analysis 2025 & 2033
- Figure 5: North America Aquaponics Industry Revenue Share (%), by Consumption Analysis 2025 & 2033
- Figure 6: North America Aquaponics Industry Revenue (Million), by Import Market Analysis (Value & Volume) 2025 & 2033
- Figure 7: North America Aquaponics Industry Revenue Share (%), by Import Market Analysis (Value & Volume) 2025 & 2033
- Figure 8: North America Aquaponics Industry Revenue (Million), by Export Market Analysis (Value & Volume) 2025 & 2033
- Figure 9: North America Aquaponics Industry Revenue Share (%), by Export Market Analysis (Value & Volume) 2025 & 2033
- Figure 10: North America Aquaponics Industry Revenue (Million), by Price Trend Analysis 2025 & 2033
- Figure 11: North America Aquaponics Industry Revenue Share (%), by Price Trend Analysis 2025 & 2033
- Figure 12: North America Aquaponics Industry Revenue (Million), by Country 2025 & 2033
- Figure 13: North America Aquaponics Industry Revenue Share (%), by Country 2025 & 2033
- Figure 14: South America Aquaponics Industry Revenue (Million), by Production Analysis 2025 & 2033
- Figure 15: South America Aquaponics Industry Revenue Share (%), by Production Analysis 2025 & 2033
- Figure 16: South America Aquaponics Industry Revenue (Million), by Consumption Analysis 2025 & 2033
- Figure 17: South America Aquaponics Industry Revenue Share (%), by Consumption Analysis 2025 & 2033
- Figure 18: South America Aquaponics Industry Revenue (Million), by Import Market Analysis (Value & Volume) 2025 & 2033
- Figure 19: South America Aquaponics Industry Revenue Share (%), by Import Market Analysis (Value & Volume) 2025 & 2033
- Figure 20: South America Aquaponics Industry Revenue (Million), by Export Market Analysis (Value & Volume) 2025 & 2033
- Figure 21: South America Aquaponics Industry Revenue Share (%), by Export Market Analysis (Value & Volume) 2025 & 2033
- Figure 22: South America Aquaponics Industry Revenue (Million), by Price Trend Analysis 2025 & 2033
- Figure 23: South America Aquaponics Industry Revenue Share (%), by Price Trend Analysis 2025 & 2033
- Figure 24: South America Aquaponics Industry Revenue (Million), by Country 2025 & 2033
- Figure 25: South America Aquaponics Industry Revenue Share (%), by Country 2025 & 2033
- Figure 26: Europe Aquaponics Industry Revenue (Million), by Production Analysis 2025 & 2033
- Figure 27: Europe Aquaponics Industry Revenue Share (%), by Production Analysis 2025 & 2033
- Figure 28: Europe Aquaponics Industry Revenue (Million), by Consumption Analysis 2025 & 2033
- Figure 29: Europe Aquaponics Industry Revenue Share (%), by Consumption Analysis 2025 & 2033
- Figure 30: Europe Aquaponics Industry Revenue (Million), by Import Market Analysis (Value & Volume) 2025 & 2033
- Figure 31: Europe Aquaponics Industry Revenue Share (%), by Import Market Analysis (Value & Volume) 2025 & 2033
- Figure 32: Europe Aquaponics Industry Revenue (Million), by Export Market Analysis (Value & Volume) 2025 & 2033
- Figure 33: Europe Aquaponics Industry Revenue Share (%), by Export Market Analysis (Value & Volume) 2025 & 2033
- Figure 34: Europe Aquaponics Industry Revenue (Million), by Price Trend Analysis 2025 & 2033
- Figure 35: Europe Aquaponics Industry Revenue Share (%), by Price Trend Analysis 2025 & 2033
- Figure 36: Europe Aquaponics Industry Revenue (Million), by Country 2025 & 2033
- Figure 37: Europe Aquaponics Industry Revenue Share (%), by Country 2025 & 2033
- Figure 38: Middle East & Africa Aquaponics Industry Revenue (Million), by Production Analysis 2025 & 2033
- Figure 39: Middle East & Africa Aquaponics Industry Revenue Share (%), by Production Analysis 2025 & 2033
- Figure 40: Middle East & Africa Aquaponics Industry Revenue (Million), by Consumption Analysis 2025 & 2033
- Figure 41: Middle East & Africa Aquaponics Industry Revenue Share (%), by Consumption Analysis 2025 & 2033
- Figure 42: Middle East & Africa Aquaponics Industry Revenue (Million), by Import Market Analysis (Value & Volume) 2025 & 2033
- Figure 43: Middle East & Africa Aquaponics Industry Revenue Share (%), by Import Market Analysis (Value & Volume) 2025 & 2033
- Figure 44: Middle East & Africa Aquaponics Industry Revenue (Million), by Export Market Analysis (Value & Volume) 2025 & 2033
- Figure 45: Middle East & Africa Aquaponics Industry Revenue Share (%), by Export Market Analysis (Value & Volume) 2025 & 2033
- Figure 46: Middle East & Africa Aquaponics Industry Revenue (Million), by Price Trend Analysis 2025 & 2033
- Figure 47: Middle East & Africa Aquaponics Industry Revenue Share (%), by Price Trend Analysis 2025 & 2033
- Figure 48: Middle East & Africa Aquaponics Industry Revenue (Million), by Country 2025 & 2033
- Figure 49: Middle East & Africa Aquaponics Industry Revenue Share (%), by Country 2025 & 2033
- Figure 50: Asia Pacific Aquaponics Industry Revenue (Million), by Production Analysis 2025 & 2033
- Figure 51: Asia Pacific Aquaponics Industry Revenue Share (%), by Production Analysis 2025 & 2033
- Figure 52: Asia Pacific Aquaponics Industry Revenue (Million), by Consumption Analysis 2025 & 2033
- Figure 53: Asia Pacific Aquaponics Industry Revenue Share (%), by Consumption Analysis 2025 & 2033
- Figure 54: Asia Pacific Aquaponics Industry Revenue (Million), by Import Market Analysis (Value & Volume) 2025 & 2033
- Figure 55: Asia Pacific Aquaponics Industry Revenue Share (%), by Import Market Analysis (Value & Volume) 2025 & 2033
- Figure 56: Asia Pacific Aquaponics Industry Revenue (Million), by Export Market Analysis (Value & Volume) 2025 & 2033
- Figure 57: Asia Pacific Aquaponics Industry Revenue Share (%), by Export Market Analysis (Value & Volume) 2025 & 2033
- Figure 58: Asia Pacific Aquaponics Industry Revenue (Million), by Price Trend Analysis 2025 & 2033
- Figure 59: Asia Pacific Aquaponics Industry Revenue Share (%), by Price Trend Analysis 2025 & 2033
- Figure 60: Asia Pacific Aquaponics Industry Revenue (Million), by Country 2025 & 2033
- Figure 61: Asia Pacific Aquaponics Industry Revenue Share (%), by Country 2025 & 2033
List of Tables
- Table 1: Global Aquaponics Industry Revenue Million Forecast, by Production Analysis 2020 & 2033
- Table 2: Global Aquaponics Industry Revenue Million Forecast, by Consumption Analysis 2020 & 2033
- Table 3: Global Aquaponics Industry Revenue Million Forecast, by Import Market Analysis (Value & Volume) 2020 & 2033
- Table 4: Global Aquaponics Industry Revenue Million Forecast, by Export Market Analysis (Value & Volume) 2020 & 2033
- Table 5: Global Aquaponics Industry Revenue Million Forecast, by Price Trend Analysis 2020 & 2033
- Table 6: Global Aquaponics Industry Revenue Million Forecast, by Region 2020 & 2033
- Table 7: Global Aquaponics Industry Revenue Million Forecast, by Production Analysis 2020 & 2033
- Table 8: Global Aquaponics Industry Revenue Million Forecast, by Consumption Analysis 2020 & 2033
- Table 9: Global Aquaponics Industry Revenue Million Forecast, by Import Market Analysis (Value & Volume) 2020 & 2033
- Table 10: Global Aquaponics Industry Revenue Million Forecast, by Export Market Analysis (Value & Volume) 2020 & 2033
- Table 11: Global Aquaponics Industry Revenue Million Forecast, by Price Trend Analysis 2020 & 2033
- Table 12: Global Aquaponics Industry Revenue Million Forecast, by Country 2020 & 2033
- Table 13: United States Aquaponics Industry Revenue (Million) Forecast, by Application 2020 & 2033
- Table 14: Canada Aquaponics Industry Revenue (Million) Forecast, by Application 2020 & 2033
- Table 15: Mexico Aquaponics Industry Revenue (Million) Forecast, by Application 2020 & 2033
- Table 16: Global Aquaponics Industry Revenue Million Forecast, by Production Analysis 2020 & 2033
- Table 17: Global Aquaponics Industry Revenue Million Forecast, by Consumption Analysis 2020 & 2033
- Table 18: Global Aquaponics Industry Revenue Million Forecast, by Import Market Analysis (Value & Volume) 2020 & 2033
- Table 19: Global Aquaponics Industry Revenue Million Forecast, by Export Market Analysis (Value & Volume) 2020 & 2033
- Table 20: Global Aquaponics Industry Revenue Million Forecast, by Price Trend Analysis 2020 & 2033
- Table 21: Global Aquaponics Industry Revenue Million Forecast, by Country 2020 & 2033
- Table 22: Brazil Aquaponics Industry Revenue (Million) Forecast, by Application 2020 & 2033
- Table 23: Argentina Aquaponics Industry Revenue (Million) Forecast, by Application 2020 & 2033
- Table 24: Rest of South America Aquaponics Industry Revenue (Million) Forecast, by Application 2020 & 2033
- Table 25: Global Aquaponics Industry Revenue Million Forecast, by Production Analysis 2020 & 2033
- Table 26: Global Aquaponics Industry Revenue Million Forecast, by Consumption Analysis 2020 & 2033
- Table 27: Global Aquaponics Industry Revenue Million Forecast, by Import Market Analysis (Value & Volume) 2020 & 2033
- Table 28: Global Aquaponics Industry Revenue Million Forecast, by Export Market Analysis (Value & Volume) 2020 & 2033
- Table 29: Global Aquaponics Industry Revenue Million Forecast, by Price Trend Analysis 2020 & 2033
- Table 30: Global Aquaponics Industry Revenue Million Forecast, by Country 2020 & 2033
- Table 31: United Kingdom Aquaponics Industry Revenue (Million) Forecast, by Application 2020 & 2033
- Table 32: Germany Aquaponics Industry Revenue (Million) Forecast, by Application 2020 & 2033
- Table 33: France Aquaponics Industry Revenue (Million) Forecast, by Application 2020 & 2033
- Table 34: Italy Aquaponics Industry Revenue (Million) Forecast, by Application 2020 & 2033
- Table 35: Spain Aquaponics Industry Revenue (Million) Forecast, by Application 2020 & 2033
- Table 36: Russia Aquaponics Industry Revenue (Million) Forecast, by Application 2020 & 2033
- Table 37: Benelux Aquaponics Industry Revenue (Million) Forecast, by Application 2020 & 2033
- Table 38: Nordics Aquaponics Industry Revenue (Million) Forecast, by Application 2020 & 2033
- Table 39: Rest of Europe Aquaponics Industry Revenue (Million) Forecast, by Application 2020 & 2033
- Table 40: Global Aquaponics Industry Revenue Million Forecast, by Production Analysis 2020 & 2033
- Table 41: Global Aquaponics Industry Revenue Million Forecast, by Consumption Analysis 2020 & 2033
- Table 42: Global Aquaponics Industry Revenue Million Forecast, by Import Market Analysis (Value & Volume) 2020 & 2033
- Table 43: Global Aquaponics Industry Revenue Million Forecast, by Export Market Analysis (Value & Volume) 2020 & 2033
- Table 44: Global Aquaponics Industry Revenue Million Forecast, by Price Trend Analysis 2020 & 2033
- Table 45: Global Aquaponics Industry Revenue Million Forecast, by Country 2020 & 2033
- Table 46: Turkey Aquaponics Industry Revenue (Million) Forecast, by Application 2020 & 2033
- Table 47: Israel Aquaponics Industry Revenue (Million) Forecast, by Application 2020 & 2033
- Table 48: GCC Aquaponics Industry Revenue (Million) Forecast, by Application 2020 & 2033
- Table 49: North Africa Aquaponics Industry Revenue (Million) Forecast, by Application 2020 & 2033
- Table 50: South Africa Aquaponics Industry Revenue (Million) Forecast, by Application 2020 & 2033
- Table 51: Rest of Middle East & Africa Aquaponics Industry Revenue (Million) Forecast, by Application 2020 & 2033
- Table 52: Global Aquaponics Industry Revenue Million Forecast, by Production Analysis 2020 & 2033
- Table 53: Global Aquaponics Industry Revenue Million Forecast, by Consumption Analysis 2020 & 2033
- Table 54: Global Aquaponics Industry Revenue Million Forecast, by Import Market Analysis (Value & Volume) 2020 & 2033
- Table 55: Global Aquaponics Industry Revenue Million Forecast, by Export Market Analysis (Value & Volume) 2020 & 2033
- Table 56: Global Aquaponics Industry Revenue Million Forecast, by Price Trend Analysis 2020 & 2033
- Table 57: Global Aquaponics Industry Revenue Million Forecast, by Country 2020 & 2033
- Table 58: China Aquaponics Industry Revenue (Million) Forecast, by Application 2020 & 2033
- Table 59: India Aquaponics Industry Revenue (Million) Forecast, by Application 2020 & 2033
- Table 60: Japan Aquaponics Industry Revenue (Million) Forecast, by Application 2020 & 2033
- Table 61: South Korea Aquaponics Industry Revenue (Million) Forecast, by Application 2020 & 2033
- Table 62: ASEAN Aquaponics Industry Revenue (Million) Forecast, by Application 2020 & 2033
- Table 63: Oceania Aquaponics Industry Revenue (Million) Forecast, by Application 2020 & 2033
- Table 64: Rest of Asia Pacific Aquaponics Industry Revenue (Million) Forecast, by Application 2020 & 2033
Frequently Asked Questions
1. What is the projected Compound Annual Growth Rate (CAGR) of the Aquaponics Industry?
The projected CAGR is approximately 9.60%.
2. Which companies are prominent players in the Aquaponics Industry?
Key companies in the market include Deep Water Farms, Superior Fresh, Practical Aquaponics, Nelson & Pade Aquaponics, BIGH, ECF Farm Berli, Garden City Aquaponics Inc, Aquaponics USA, Madhavi Farms, Ouroboros Farms, Pentair Aquatic Eco-System Inc (PAES).
3. What are the main segments of the Aquaponics Industry?
The market segments include Production Analysis, Consumption Analysis, Import Market Analysis (Value & Volume), Export Market Analysis (Value & Volume), Price Trend Analysis.
4. Can you provide details about the market size?
The market size is estimated to be USD 1.21 Million as of 2022.
5. What are some drivers contributing to market growth?
High Cost of Farm Labors; Increasing Consumption of Grain Crops.
6. What are the notable trends driving market growth?
Substantial Demand for Organic Produce Driving the Market.
7. Are there any restraints impacting market growth?
High Cost of Combine Harvesters; Small and Fragmented Land Holdings.
8. Can you provide examples of recent developments in the market?
N/A
9. What pricing options are available for accessing the report?
Pricing options include single-user, multi-user, and enterprise licenses priced at USD 4750, USD 5250, and USD 8750 respectively.
10. Is the market size provided in terms of value or volume?
The market size is provided in terms of value, measured in Million.
11. Are there any specific market keywords associated with the report?
Yes, the market keyword associated with the report is "Aquaponics Industry," which aids in identifying and referencing the specific market segment covered.
12. How do I determine which pricing option suits my needs best?
The pricing options vary based on user requirements and access needs. Individual users may opt for single-user licenses, while businesses requiring broader access may choose multi-user or enterprise licenses for cost-effective access to the report.
13. Are there any additional resources or data provided in the Aquaponics Industry report?
While the report offers comprehensive insights, it's advisable to review the specific contents or supplementary materials provided to ascertain if additional resources or data are available.
14. How can I stay updated on further developments or reports in the Aquaponics Industry?
To stay informed about further developments, trends, and reports in the Aquaponics Industry, consider subscribing to industry newsletters, following relevant companies and organizations, or regularly checking reputable industry news sources and publications.
Methodology
Step 1 - Identification of Relevant Samples Size from Population Database


Step 2 - Approaches for Defining Global Market Size (Value, Volume* & Price*)

Note*: In applicable scenarios
Step 3 - Data Sources
Primary Research
- Web Analytics
- Survey Reports
- Research Institute
- Latest Research Reports
- Opinion Leaders
Secondary Research
- Annual Reports
- White Paper
- Latest Press Release
- Industry Association
- Paid Database
- Investor Presentations

Step 4 - Data Triangulation
Involves using different sources of information in order to increase the validity of a study
These sources are likely to be stakeholders in a program - participants, other researchers, program staff, other community members, and so on.
Then we put all data in single framework & apply various statistical tools to find out the dynamic on the market.
During the analysis stage, feedback from the stakeholder groups would be compared to determine areas of agreement as well as areas of divergence