

Key Insights
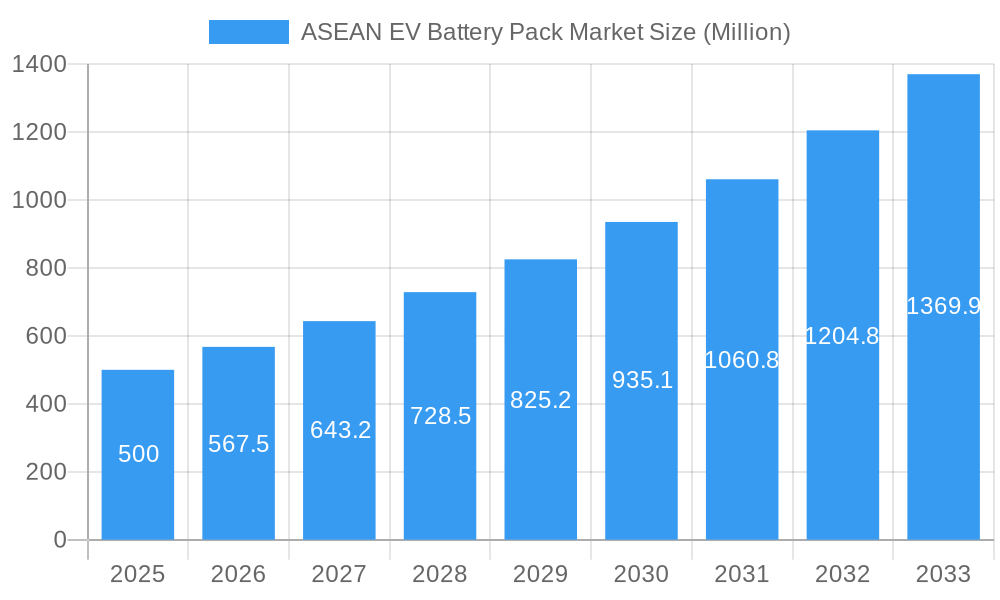
The ASEAN Electric Vehicle (EV) Battery Pack Market is poised for significant expansion, driven by supportive government initiatives for EV adoption, growing environmental consciousness, and declining battery costs. With a current market size of 0.33 billion in the base year 2024, the market is projected to witness a robust Compound Annual Growth Rate (CAGR) of 34.68% from 2024 to 2033. This upward trajectory is underpinned by several key factors. The escalating adoption of Battery Electric Vehicles (BEVs) across the region, coupled with proactive government policies promoting sustainable transportation, is a primary catalyst. Advancements in battery technology, particularly in energy density and lifespan, are enhancing the appeal of EVs to consumers. The market is segmented by various battery chemistries, including LFP, NCA, NCM, and NMC, each addressing specific needs for cost, performance, and environmental impact. Further diversification arises from vehicle types (buses, LCVs, M&HDTs, passenger cars), battery capacity, form factors (cylindrical, pouch, prismatic), and manufacturing methods. The competitive landscape features global leaders such as CATL, LG Energy Solution, and BYD, alongside a growing presence of regional manufacturers.
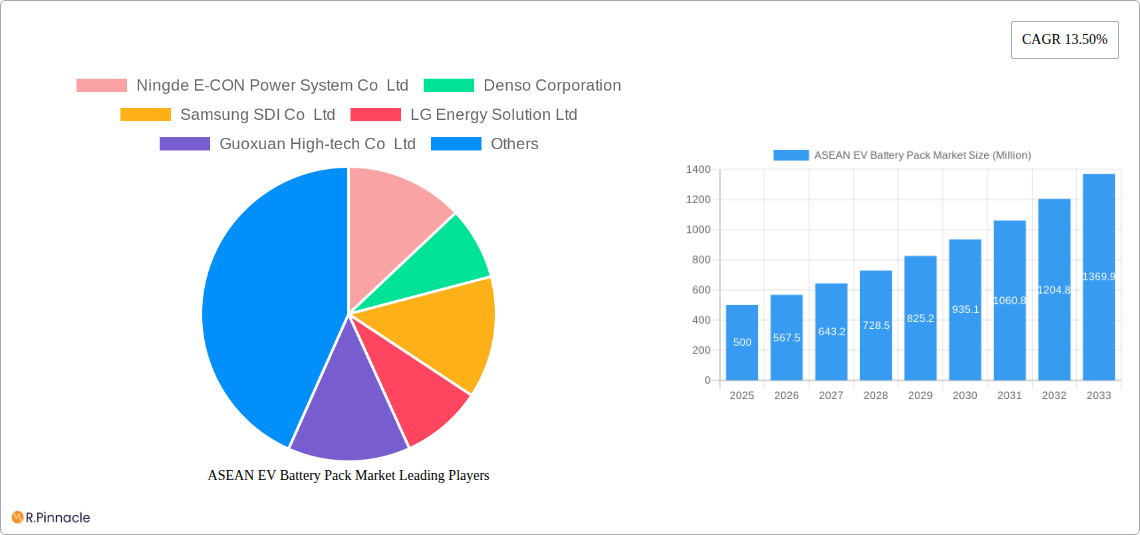
ASEAN EV Battery Pack Market Market Size (In Million)
Despite the promising growth outlook, the ASEAN EV battery pack market faces certain challenges. These include the initial high cost of EVs and battery packs, the availability of charging infrastructure in specific locales, and concerns surrounding the ethical sourcing of raw materials like cobalt and lithium. Addressing these hurdles through continuous technological innovation, strategic investments in charging infrastructure, and the development of sustainable battery materials will be paramount for the market's sustained and responsible growth. The future dominance of specific battery chemistries and form factors will hinge on evolving technological advancements and economic dynamics. Each market segment, defined by vehicle type, battery chemistry, and manufacturing method, exhibits unique growth potential influenced by distinct technological and economic factors. Long-term market success will be determined by manufacturers' ability to align with both consumer demand and environmental imperatives in battery production and lifecycle management.
ASEAN EV Battery Pack Market Company Market Share
ASEAN EV Battery Pack Market: A Comprehensive Report (2019-2033)
This comprehensive report provides an in-depth analysis of the ASEAN EV battery pack market, offering crucial insights for industry professionals, investors, and stakeholders. Covering the period 2019-2033, with a base year of 2025 and a forecast period of 2025-2033, this report unveils the market's structure, dynamics, and future potential. The report segments the market across various parameters including battery chemistry, vehicle type, capacity, and geographic location, providing granular data for informed decision-making. The market size is projected to reach xx Million by 2033, exhibiting a CAGR of xx%.
ASEAN EV Battery Pack Market Structure & Innovation Trends
This section analyzes the ASEAN EV battery pack market's competitive landscape, highlighting key players and their market share. The report assesses market concentration, identifying dominant players and emerging competitors. Innovation drivers, such as advancements in battery technology and government regulations promoting EV adoption, are thoroughly examined. The impact of regulatory frameworks, the availability of product substitutes, and end-user demographics on market growth is also analyzed. Furthermore, the report details recent mergers and acquisitions (M&A) activities within the sector, providing insights into deal values and their implications for the market.
- Market Concentration: The market is moderately concentrated, with the top five players holding approximately xx% of the market share in 2024.
- Key Players and Market Share (2024): CATL (xx%), LG Energy Solution (xx%), BYD (xx%), Samsung SDI (xx%), Panasonic (xx%). (Remaining share distributed among other players).
- M&A Activity: Significant M&A activity observed in recent years, with deal values totaling approximately xx Million in 2024. These activities indicate a trend towards consolidation and strategic partnerships within the industry.
- Innovation Drivers: Government incentives, technological advancements in battery chemistries (e.g., LFP, NMC), and increasing demand for higher energy density batteries are major drivers.
ASEAN EV Battery Pack Market Dynamics & Trends
This section delves into the key drivers and trends shaping the ASEAN EV battery pack market. The report analyzes market growth drivers, including rising EV adoption rates, supportive government policies, and growing environmental concerns. Technological disruptions, such as the development of solid-state batteries and advancements in battery management systems (BMS), are assessed for their impact on market dynamics. Consumer preferences, including range anxiety and charging infrastructure availability, are also considered. Competitive dynamics, such as pricing strategies, product differentiation, and technological innovation, are meticulously examined.
The market is projected to experience significant growth, driven by factors such as increasing vehicle electrification, supportive government policies (e.g., tax incentives, subsidies), and growing environmental awareness. The CAGR for the forecast period (2025-2033) is estimated at xx%, with market penetration expected to reach xx% by 2033. The shift towards higher capacity batteries (above 80 kWh) is also a significant trend, driven by the demand for longer driving ranges.
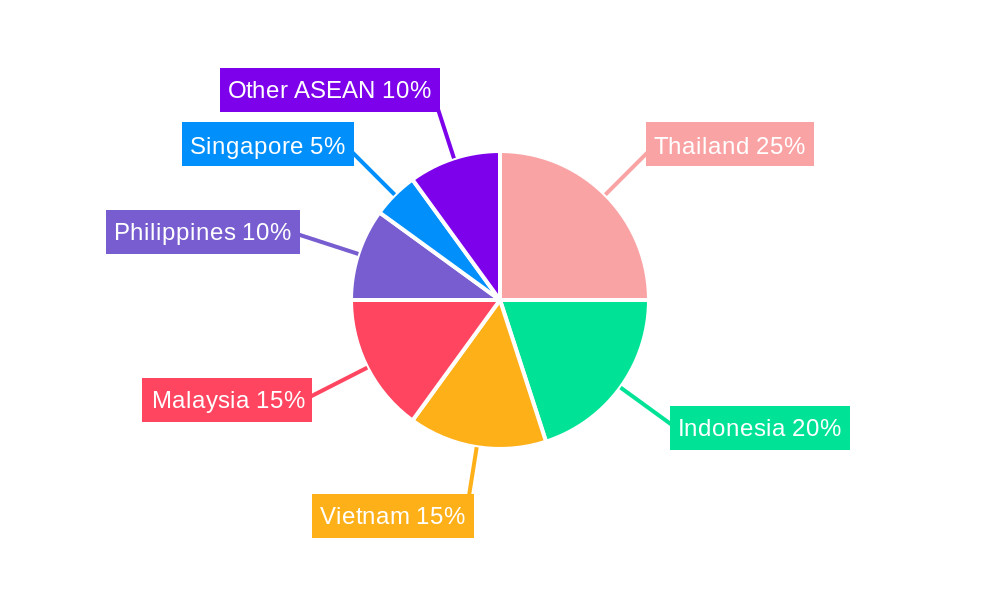
Dominant Regions & Segments in ASEAN EV Battery Pack Market
This section identifies the leading regions, countries, and market segments within the ASEAN EV battery pack market. Thailand is currently the dominant market in ASEAN due to its robust automotive industry and supportive government policies.
Key Drivers for Thailand's Dominance:
- Favorable government regulations and incentives for EV adoption.
- Presence of established automotive manufacturing facilities.
- Growing investment in EV infrastructure.
Dominant Segments:
- Body Type: Passenger cars currently dominate the market, followed by LCVs.
- Battery Chemistry: LFP batteries are gaining significant traction due to their cost-effectiveness.
- Capacity: The 40 kWh to 80 kWh segment holds the largest market share.
- Propulsion Type: BEVs currently dominate, however, PHEVs are gaining ground.
ASEAN EV Battery Pack Market Product Innovations
Recent product developments focus on improving battery energy density, cycle life, and safety. The adoption of advanced battery chemistries, such as solid-state batteries, and improvements in battery management systems are key innovations driving market growth. These advancements are enhancing the performance, safety, and affordability of EV battery packs, further boosting market adoption. The market is witnessing a strong emphasis on cost reduction while simultaneously enhancing performance and longevity.
Report Scope & Segmentation Analysis
This report segments the ASEAN EV battery pack market based on several key parameters:
- Body Type: Bus, LCV, M&HDT, Passenger Car (with projected market size and CAGR for each segment)
- Battery Chemistry: LFP, NCA, NCM, NMC (with projected market size and CAGR for each segment)
- Material Type: Cobalt, Lithium, Manganese, Natural Graphite, Nickel, Other Materials (with projected market size and CAGR for each segment)
- Country: Thailand (with detailed market analysis and projections)
- Propulsion Type: BEV, PHEV (with projected market size and CAGR for each segment)
- Capacity: Less than 15 kWh, 15 kWh to 40 kWh, 40 kWh to 80 kWh, Above 80 kWh (with projected market size and CAGR for each segment)
- Battery Form: Cylindrical, Pouch, Prismatic (with projected market size and CAGR for each segment)
- Method: Laser, Wire (with projected market size and CAGR for each segment)
- Component: Anode, Cathode, Electrolyte, Separator (with projected market size and CAGR for each segment)
Each segment analysis includes growth projections, market sizes, and competitive dynamics.
Key Drivers of ASEAN EV Battery Pack Market Growth
Several factors are driving the growth of the ASEAN EV battery pack market. Government incentives, such as tax breaks and subsidies for EV purchases, are significantly boosting demand. Technological advancements, including improved battery chemistries and increased energy density, are making EVs more appealing to consumers. Furthermore, growing environmental concerns and the push for carbon emission reduction are driving the adoption of EVs across the region.
Challenges in the ASEAN EV Battery Pack Market Sector
Despite the positive growth outlook, several challenges hinder the ASEAN EV battery pack market's development. These include the high initial cost of EVs, limited charging infrastructure in certain areas, and the dependence on raw material imports, which poses supply chain vulnerabilities. Concerns about battery lifespan and recycling also remain significant challenges.
Emerging Opportunities in ASEAN EV Battery Pack Market
The ASEAN EV battery pack market presents substantial opportunities. The expanding EV infrastructure, coupled with increasing consumer awareness and affordability of EVs, creates a favorable environment for market growth. The development of innovative battery technologies, such as solid-state batteries, offers opportunities for improved performance and safety.
Leading Players in the ASEAN EV Battery Pack Market Market
- Contemporary Amperex Technology Co Ltd (CATL)
- BYD Company Ltd
- LG Energy Solution Ltd
- Samsung SDI Co Ltd
- Denso Corporation
- Ningde E-CON Power System Co Ltd
- SVOLT Energy Technology Co Ltd (SVOLT)
- Deutsche ACCUmotive GmbH & Co KG
- Guoxuan High-tech Co Ltd
- SK Innovation Co Ltd
- Do-Fluoride (Jiaozuo) New Energy Technology
- Panasonic Holdings Corporation
Key Developments in ASEAN EV Battery Pack Market Industry
- March 2023: Contemporary Amperex Technology Co., Ltd. (CATL) established a joint venture with FAW Jiefang Automotive Co., Ltd., signifying a significant strategic partnership within the industry.
- March 2023: CATL signed a strategic cooperation agreement with BAIC Group, further strengthening its position in the Chinese EV market and influencing its ASEAN strategies.
- April 2023: CATL announced the launch of its sodium-ion battery in Chery models and the joint creation of the ENER-Q battery brand, marking a key innovation and expansion move.
Future Outlook for ASEAN EV Battery Pack Market Market
The ASEAN EV battery pack market is poised for robust growth, driven by supportive government policies, increasing consumer demand, and technological advancements. The focus on enhancing battery performance, cost reduction, and sustainability will shape future market trends. Strategic partnerships and investments in research and development will further propel the market's expansion in the coming years.
ASEAN EV Battery Pack Market Segmentation
-
1. Body Type
- 1.1. Bus
- 1.2. LCV
- 1.3. M&HDT
- 1.4. Passenger Car
-
2. Propulsion Type
- 2.1. BEV
- 2.2. PHEV
-
3. Battery Chemistry
- 3.1. LFP
- 3.2. NCA
- 3.3. NCM
- 3.4. NMC
-
4. Capacity
- 4.1. 15 kWh to 40 kWh
- 4.2. 40 kWh to 80 kWh
- 4.3. Above 80 kWh
- 4.4. Less than 15 kWh
-
5. Battery Form
- 5.1. Cylindrical
- 5.2. Pouch
- 5.3. Prismatic
-
6. Method
- 6.1. Laser
- 6.2. Wire
-
7. Component
- 7.1. Anode
- 7.2. Cathode
- 7.3. Electrolyte
- 7.4. Separator
-
8. Material Type
- 8.1. Cobalt
- 8.2. Lithium
- 8.3. Manganese
- 8.4. Natural Graphite
- 8.5. Nickel
- 8.6. Other Materials
ASEAN EV Battery Pack Market Segmentation By Geography
-
1. North America
- 1.1. United States
- 1.2. Canada
- 1.3. Mexico
-
2. South America
- 2.1. Brazil
- 2.2. Argentina
- 2.3. Rest of South America
-
3. Europe
- 3.1. United Kingdom
- 3.2. Germany
- 3.3. France
- 3.4. Italy
- 3.5. Spain
- 3.6. Russia
- 3.7. Benelux
- 3.8. Nordics
- 3.9. Rest of Europe
-
4. Middle East & Africa
- 4.1. Turkey
- 4.2. Israel
- 4.3. GCC
- 4.4. North Africa
- 4.5. South Africa
- 4.6. Rest of Middle East & Africa
-
5. Asia Pacific
- 5.1. China
- 5.2. India
- 5.3. Japan
- 5.4. South Korea
- 5.5. ASEAN
- 5.6. Oceania
- 5.7. Rest of Asia Pacific
ASEAN EV Battery Pack Market Regional Market Share
Geographic Coverage of ASEAN EV Battery Pack Market
ASEAN EV Battery Pack Market REPORT HIGHLIGHTS
| Aspects | Details |
|---|---|
| Study Period | 2020-2034 |
| Base Year | 2025 |
| Estimated Year | 2026 |
| Forecast Period | 2026-2034 |
| Historical Period | 2020-2025 |
| Growth Rate | CAGR of 34.68% from 2020-2034 |
| Segmentation |
|
Table of Contents
- 1. Introduction
- 1.1. Research Scope
- 1.2. Market Segmentation
- 1.3. Research Objective
- 1.4. Definitions and Assumptions
- 2. Executive Summary
- 2.1. Market Snapshot
- 3. Market Dynamics
- 3.1. Market Drivers
- 3.2. Market Restrains
- 3.3. Market Trends
- 3.4. Market Opportunities
- 4. Market Factor Analysis
- 4.1. Porters Five Forces
- 4.1.1. Bargaining Power of Suppliers
- 4.1.2. Bargaining Power of Buyers
- 4.1.3. Threat of New Entrants
- 4.1.4. Threat of Substitutes
- 4.1.5. Competitive Rivalry
- 4.2. PESTEL analysis
- 4.3. BCG Analysis
- 4.3.1. Stars (High Growth, High Market Share)
- 4.3.2. Cash Cows (Low Growth, High Market Share)
- 4.3.3. Question Mark (High Growth, Low Market Share)
- 4.3.4. Dogs (Low Growth, Low Market Share)
- 4.4. Ansoff Matrix Analysis
- 4.5. Supply Chain Analysis
- 4.6. Regulatory Landscape
- 4.7. Current Market Potential and Opportunity Assessment (TAM–SAM–SOM Framework)
- 4.8. PRI Analyst Note
- 4.1. Porters Five Forces
- 5. Market Analysis, Insights and Forecast 2021-2033
- 5.1. Market Analysis, Insights and Forecast - by Body Type
- 5.1.1. Bus
- 5.1.2. LCV
- 5.1.3. M&HDT
- 5.1.4. Passenger Car
- 5.2. Market Analysis, Insights and Forecast - by Propulsion Type
- 5.2.1. BEV
- 5.2.2. PHEV
- 5.3. Market Analysis, Insights and Forecast - by Battery Chemistry
- 5.3.1. LFP
- 5.3.2. NCA
- 5.3.3. NCM
- 5.3.4. NMC
- 5.4. Market Analysis, Insights and Forecast - by Capacity
- 5.4.1. 15 kWh to 40 kWh
- 5.4.2. 40 kWh to 80 kWh
- 5.4.3. Above 80 kWh
- 5.4.4. Less than 15 kWh
- 5.5. Market Analysis, Insights and Forecast - by Battery Form
- 5.5.1. Cylindrical
- 5.5.2. Pouch
- 5.5.3. Prismatic
- 5.6. Market Analysis, Insights and Forecast - by Method
- 5.6.1. Laser
- 5.6.2. Wire
- 5.7. Market Analysis, Insights and Forecast - by Component
- 5.7.1. Anode
- 5.7.2. Cathode
- 5.7.3. Electrolyte
- 5.7.4. Separator
- 5.8. Market Analysis, Insights and Forecast - by Material Type
- 5.8.1. Cobalt
- 5.8.2. Lithium
- 5.8.3. Manganese
- 5.8.4. Natural Graphite
- 5.8.5. Nickel
- 5.8.6. Other Materials
- 5.9. Market Analysis, Insights and Forecast - by Region
- 5.9.1. North America
- 5.9.2. South America
- 5.9.3. Europe
- 5.9.4. Middle East & Africa
- 5.9.5. Asia Pacific
- 5.1. Market Analysis, Insights and Forecast - by Body Type
- 6. Global ASEAN EV Battery Pack Market Analysis, Insights and Forecast, 2021-2033
- 6.1. Market Analysis, Insights and Forecast - by Body Type
- 6.1.1. Bus
- 6.1.2. LCV
- 6.1.3. M&HDT
- 6.1.4. Passenger Car
- 6.2. Market Analysis, Insights and Forecast - by Propulsion Type
- 6.2.1. BEV
- 6.2.2. PHEV
- 6.3. Market Analysis, Insights and Forecast - by Battery Chemistry
- 6.3.1. LFP
- 6.3.2. NCA
- 6.3.3. NCM
- 6.3.4. NMC
- 6.4. Market Analysis, Insights and Forecast - by Capacity
- 6.4.1. 15 kWh to 40 kWh
- 6.4.2. 40 kWh to 80 kWh
- 6.4.3. Above 80 kWh
- 6.4.4. Less than 15 kWh
- 6.5. Market Analysis, Insights and Forecast - by Battery Form
- 6.5.1. Cylindrical
- 6.5.2. Pouch
- 6.5.3. Prismatic
- 6.6. Market Analysis, Insights and Forecast - by Method
- 6.6.1. Laser
- 6.6.2. Wire
- 6.7. Market Analysis, Insights and Forecast - by Component
- 6.7.1. Anode
- 6.7.2. Cathode
- 6.7.3. Electrolyte
- 6.7.4. Separator
- 6.8. Market Analysis, Insights and Forecast - by Material Type
- 6.8.1. Cobalt
- 6.8.2. Lithium
- 6.8.3. Manganese
- 6.8.4. Natural Graphite
- 6.8.5. Nickel
- 6.8.6. Other Materials
- 6.1. Market Analysis, Insights and Forecast - by Body Type
- 7. North America ASEAN EV Battery Pack Market Analysis, Insights and Forecast, 2020-2032
- 7.1. Market Analysis, Insights and Forecast - by Body Type
- 7.1.1. Bus
- 7.1.2. LCV
- 7.1.3. M&HDT
- 7.1.4. Passenger Car
- 7.2. Market Analysis, Insights and Forecast - by Propulsion Type
- 7.2.1. BEV
- 7.2.2. PHEV
- 7.3. Market Analysis, Insights and Forecast - by Battery Chemistry
- 7.3.1. LFP
- 7.3.2. NCA
- 7.3.3. NCM
- 7.3.4. NMC
- 7.4. Market Analysis, Insights and Forecast - by Capacity
- 7.4.1. 15 kWh to 40 kWh
- 7.4.2. 40 kWh to 80 kWh
- 7.4.3. Above 80 kWh
- 7.4.4. Less than 15 kWh
- 7.5. Market Analysis, Insights and Forecast - by Battery Form
- 7.5.1. Cylindrical
- 7.5.2. Pouch
- 7.5.3. Prismatic
- 7.6. Market Analysis, Insights and Forecast - by Method
- 7.6.1. Laser
- 7.6.2. Wire
- 7.7. Market Analysis, Insights and Forecast - by Component
- 7.7.1. Anode
- 7.7.2. Cathode
- 7.7.3. Electrolyte
- 7.7.4. Separator
- 7.8. Market Analysis, Insights and Forecast - by Material Type
- 7.8.1. Cobalt
- 7.8.2. Lithium
- 7.8.3. Manganese
- 7.8.4. Natural Graphite
- 7.8.5. Nickel
- 7.8.6. Other Materials
- 7.1. Market Analysis, Insights and Forecast - by Body Type
- 8. South America ASEAN EV Battery Pack Market Analysis, Insights and Forecast, 2020-2032
- 8.1. Market Analysis, Insights and Forecast - by Body Type
- 8.1.1. Bus
- 8.1.2. LCV
- 8.1.3. M&HDT
- 8.1.4. Passenger Car
- 8.2. Market Analysis, Insights and Forecast - by Propulsion Type
- 8.2.1. BEV
- 8.2.2. PHEV
- 8.3. Market Analysis, Insights and Forecast - by Battery Chemistry
- 8.3.1. LFP
- 8.3.2. NCA
- 8.3.3. NCM
- 8.3.4. NMC
- 8.4. Market Analysis, Insights and Forecast - by Capacity
- 8.4.1. 15 kWh to 40 kWh
- 8.4.2. 40 kWh to 80 kWh
- 8.4.3. Above 80 kWh
- 8.4.4. Less than 15 kWh
- 8.5. Market Analysis, Insights and Forecast - by Battery Form
- 8.5.1. Cylindrical
- 8.5.2. Pouch
- 8.5.3. Prismatic
- 8.6. Market Analysis, Insights and Forecast - by Method
- 8.6.1. Laser
- 8.6.2. Wire
- 8.7. Market Analysis, Insights and Forecast - by Component
- 8.7.1. Anode
- 8.7.2. Cathode
- 8.7.3. Electrolyte
- 8.7.4. Separator
- 8.8. Market Analysis, Insights and Forecast - by Material Type
- 8.8.1. Cobalt
- 8.8.2. Lithium
- 8.8.3. Manganese
- 8.8.4. Natural Graphite
- 8.8.5. Nickel
- 8.8.6. Other Materials
- 8.1. Market Analysis, Insights and Forecast - by Body Type
- 9. Europe ASEAN EV Battery Pack Market Analysis, Insights and Forecast, 2020-2032
- 9.1. Market Analysis, Insights and Forecast - by Body Type
- 9.1.1. Bus
- 9.1.2. LCV
- 9.1.3. M&HDT
- 9.1.4. Passenger Car
- 9.2. Market Analysis, Insights and Forecast - by Propulsion Type
- 9.2.1. BEV
- 9.2.2. PHEV
- 9.3. Market Analysis, Insights and Forecast - by Battery Chemistry
- 9.3.1. LFP
- 9.3.2. NCA
- 9.3.3. NCM
- 9.3.4. NMC
- 9.4. Market Analysis, Insights and Forecast - by Capacity
- 9.4.1. 15 kWh to 40 kWh
- 9.4.2. 40 kWh to 80 kWh
- 9.4.3. Above 80 kWh
- 9.4.4. Less than 15 kWh
- 9.5. Market Analysis, Insights and Forecast - by Battery Form
- 9.5.1. Cylindrical
- 9.5.2. Pouch
- 9.5.3. Prismatic
- 9.6. Market Analysis, Insights and Forecast - by Method
- 9.6.1. Laser
- 9.6.2. Wire
- 9.7. Market Analysis, Insights and Forecast - by Component
- 9.7.1. Anode
- 9.7.2. Cathode
- 9.7.3. Electrolyte
- 9.7.4. Separator
- 9.8. Market Analysis, Insights and Forecast - by Material Type
- 9.8.1. Cobalt
- 9.8.2. Lithium
- 9.8.3. Manganese
- 9.8.4. Natural Graphite
- 9.8.5. Nickel
- 9.8.6. Other Materials
- 9.1. Market Analysis, Insights and Forecast - by Body Type
- 10. Middle East & Africa ASEAN EV Battery Pack Market Analysis, Insights and Forecast, 2020-2032
- 10.1. Market Analysis, Insights and Forecast - by Body Type
- 10.1.1. Bus
- 10.1.2. LCV
- 10.1.3. M&HDT
- 10.1.4. Passenger Car
- 10.2. Market Analysis, Insights and Forecast - by Propulsion Type
- 10.2.1. BEV
- 10.2.2. PHEV
- 10.3. Market Analysis, Insights and Forecast - by Battery Chemistry
- 10.3.1. LFP
- 10.3.2. NCA
- 10.3.3. NCM
- 10.3.4. NMC
- 10.4. Market Analysis, Insights and Forecast - by Capacity
- 10.4.1. 15 kWh to 40 kWh
- 10.4.2. 40 kWh to 80 kWh
- 10.4.3. Above 80 kWh
- 10.4.4. Less than 15 kWh
- 10.5. Market Analysis, Insights and Forecast - by Battery Form
- 10.5.1. Cylindrical
- 10.5.2. Pouch
- 10.5.3. Prismatic
- 10.6. Market Analysis, Insights and Forecast - by Method
- 10.6.1. Laser
- 10.6.2. Wire
- 10.7. Market Analysis, Insights and Forecast - by Component
- 10.7.1. Anode
- 10.7.2. Cathode
- 10.7.3. Electrolyte
- 10.7.4. Separator
- 10.8. Market Analysis, Insights and Forecast - by Material Type
- 10.8.1. Cobalt
- 10.8.2. Lithium
- 10.8.3. Manganese
- 10.8.4. Natural Graphite
- 10.8.5. Nickel
- 10.8.6. Other Materials
- 10.1. Market Analysis, Insights and Forecast - by Body Type
- 11. Asia Pacific ASEAN EV Battery Pack Market Analysis, Insights and Forecast, 2020-2032
- 11.1. Market Analysis, Insights and Forecast - by Body Type
- 11.1.1. Bus
- 11.1.2. LCV
- 11.1.3. M&HDT
- 11.1.4. Passenger Car
- 11.2. Market Analysis, Insights and Forecast - by Propulsion Type
- 11.2.1. BEV
- 11.2.2. PHEV
- 11.3. Market Analysis, Insights and Forecast - by Battery Chemistry
- 11.3.1. LFP
- 11.3.2. NCA
- 11.3.3. NCM
- 11.3.4. NMC
- 11.4. Market Analysis, Insights and Forecast - by Capacity
- 11.4.1. 15 kWh to 40 kWh
- 11.4.2. 40 kWh to 80 kWh
- 11.4.3. Above 80 kWh
- 11.4.4. Less than 15 kWh
- 11.5. Market Analysis, Insights and Forecast - by Battery Form
- 11.5.1. Cylindrical
- 11.5.2. Pouch
- 11.5.3. Prismatic
- 11.6. Market Analysis, Insights and Forecast - by Method
- 11.6.1. Laser
- 11.6.2. Wire
- 11.7. Market Analysis, Insights and Forecast - by Component
- 11.7.1. Anode
- 11.7.2. Cathode
- 11.7.3. Electrolyte
- 11.7.4. Separator
- 11.8. Market Analysis, Insights and Forecast - by Material Type
- 11.8.1. Cobalt
- 11.8.2. Lithium
- 11.8.3. Manganese
- 11.8.4. Natural Graphite
- 11.8.5. Nickel
- 11.8.6. Other Materials
- 11.1. Market Analysis, Insights and Forecast - by Body Type
- 12. Competitive Analysis
- 12.1. Company Profiles
- 12.1.1 Ningde E-CON Power System Co Ltd
- 12.1.1.1. Company Overview
- 12.1.1.2. Products
- 12.1.1.3. Company Financials
- 12.1.1.4. SWOT Analysis
- 12.1.2 Denso Corporation
- 12.1.2.1. Company Overview
- 12.1.2.2. Products
- 12.1.2.3. Company Financials
- 12.1.2.4. SWOT Analysis
- 12.1.3 Samsung SDI Co Ltd
- 12.1.3.1. Company Overview
- 12.1.3.2. Products
- 12.1.3.3. Company Financials
- 12.1.3.4. SWOT Analysis
- 12.1.4 LG Energy Solution Ltd
- 12.1.4.1. Company Overview
- 12.1.4.2. Products
- 12.1.4.3. Company Financials
- 12.1.4.4. SWOT Analysis
- 12.1.5 Guoxuan High-tech Co Ltd
- 12.1.5.1. Company Overview
- 12.1.5.2. Products
- 12.1.5.3. Company Financials
- 12.1.5.4. SWOT Analysis
- 12.1.6 SVOLT Energy Technology Co Ltd (SVOLT
- 12.1.6.1. Company Overview
- 12.1.6.2. Products
- 12.1.6.3. Company Financials
- 12.1.6.4. SWOT Analysis
- 12.1.7 Deutsche ACCUmotive GmbH & Co KG
- 12.1.7.1. Company Overview
- 12.1.7.2. Products
- 12.1.7.3. Company Financials
- 12.1.7.4. SWOT Analysis
- 12.1.8 Contemporary Amperex Technology Co Ltd (CATL)
- 12.1.8.1. Company Overview
- 12.1.8.2. Products
- 12.1.8.3. Company Financials
- 12.1.8.4. SWOT Analysis
- 12.1.9 BYD Company Ltd
- 12.1.9.1. Company Overview
- 12.1.9.2. Products
- 12.1.9.3. Company Financials
- 12.1.9.4. SWOT Analysis
- 12.1.10 SK Innovation Co Ltd
- 12.1.10.1. Company Overview
- 12.1.10.2. Products
- 12.1.10.3. Company Financials
- 12.1.10.4. SWOT Analysis
- 12.1.11 Do-Fluoride (Jiaozuo) New Energy Technology
- 12.1.11.1. Company Overview
- 12.1.11.2. Products
- 12.1.11.3. Company Financials
- 12.1.11.4. SWOT Analysis
- 12.1.12 Panasonic Holdings Corporation
- 12.1.12.1. Company Overview
- 12.1.12.2. Products
- 12.1.12.3. Company Financials
- 12.1.12.4. SWOT Analysis
- 12.1.1 Ningde E-CON Power System Co Ltd
- 12.2. Market Entropy
- 12.2.1 Company's Key Areas Served
- 12.2.2 Recent Developments
- 12.3. Company Market Share Analysis 2025
- 12.3.1 Top 5 Companies Market Share Analysis
- 12.3.2 Top 3 Companies Market Share Analysis
- 12.4. List of Potential Customers
- 13. Research Methodology
List of Figures
- Figure 1: Global ASEAN EV Battery Pack Market Revenue Breakdown (billion, %) by Region 2025 & 2033
- Figure 2: North America ASEAN EV Battery Pack Market Revenue (billion), by Body Type 2025 & 2033
- Figure 3: North America ASEAN EV Battery Pack Market Revenue Share (%), by Body Type 2025 & 2033
- Figure 4: North America ASEAN EV Battery Pack Market Revenue (billion), by Propulsion Type 2025 & 2033
- Figure 5: North America ASEAN EV Battery Pack Market Revenue Share (%), by Propulsion Type 2025 & 2033
- Figure 6: North America ASEAN EV Battery Pack Market Revenue (billion), by Battery Chemistry 2025 & 2033
- Figure 7: North America ASEAN EV Battery Pack Market Revenue Share (%), by Battery Chemistry 2025 & 2033
- Figure 8: North America ASEAN EV Battery Pack Market Revenue (billion), by Capacity 2025 & 2033
- Figure 9: North America ASEAN EV Battery Pack Market Revenue Share (%), by Capacity 2025 & 2033
- Figure 10: North America ASEAN EV Battery Pack Market Revenue (billion), by Battery Form 2025 & 2033
- Figure 11: North America ASEAN EV Battery Pack Market Revenue Share (%), by Battery Form 2025 & 2033
- Figure 12: North America ASEAN EV Battery Pack Market Revenue (billion), by Method 2025 & 2033
- Figure 13: North America ASEAN EV Battery Pack Market Revenue Share (%), by Method 2025 & 2033
- Figure 14: North America ASEAN EV Battery Pack Market Revenue (billion), by Component 2025 & 2033
- Figure 15: North America ASEAN EV Battery Pack Market Revenue Share (%), by Component 2025 & 2033
- Figure 16: North America ASEAN EV Battery Pack Market Revenue (billion), by Material Type 2025 & 2033
- Figure 17: North America ASEAN EV Battery Pack Market Revenue Share (%), by Material Type 2025 & 2033
- Figure 18: North America ASEAN EV Battery Pack Market Revenue (billion), by Country 2025 & 2033
- Figure 19: North America ASEAN EV Battery Pack Market Revenue Share (%), by Country 2025 & 2033
- Figure 20: South America ASEAN EV Battery Pack Market Revenue (billion), by Body Type 2025 & 2033
- Figure 21: South America ASEAN EV Battery Pack Market Revenue Share (%), by Body Type 2025 & 2033
- Figure 22: South America ASEAN EV Battery Pack Market Revenue (billion), by Propulsion Type 2025 & 2033
- Figure 23: South America ASEAN EV Battery Pack Market Revenue Share (%), by Propulsion Type 2025 & 2033
- Figure 24: South America ASEAN EV Battery Pack Market Revenue (billion), by Battery Chemistry 2025 & 2033
- Figure 25: South America ASEAN EV Battery Pack Market Revenue Share (%), by Battery Chemistry 2025 & 2033
- Figure 26: South America ASEAN EV Battery Pack Market Revenue (billion), by Capacity 2025 & 2033
- Figure 27: South America ASEAN EV Battery Pack Market Revenue Share (%), by Capacity 2025 & 2033
- Figure 28: South America ASEAN EV Battery Pack Market Revenue (billion), by Battery Form 2025 & 2033
- Figure 29: South America ASEAN EV Battery Pack Market Revenue Share (%), by Battery Form 2025 & 2033
- Figure 30: South America ASEAN EV Battery Pack Market Revenue (billion), by Method 2025 & 2033
- Figure 31: South America ASEAN EV Battery Pack Market Revenue Share (%), by Method 2025 & 2033
- Figure 32: South America ASEAN EV Battery Pack Market Revenue (billion), by Component 2025 & 2033
- Figure 33: South America ASEAN EV Battery Pack Market Revenue Share (%), by Component 2025 & 2033
- Figure 34: South America ASEAN EV Battery Pack Market Revenue (billion), by Material Type 2025 & 2033
- Figure 35: South America ASEAN EV Battery Pack Market Revenue Share (%), by Material Type 2025 & 2033
- Figure 36: South America ASEAN EV Battery Pack Market Revenue (billion), by Country 2025 & 2033
- Figure 37: South America ASEAN EV Battery Pack Market Revenue Share (%), by Country 2025 & 2033
- Figure 38: Europe ASEAN EV Battery Pack Market Revenue (billion), by Body Type 2025 & 2033
- Figure 39: Europe ASEAN EV Battery Pack Market Revenue Share (%), by Body Type 2025 & 2033
- Figure 40: Europe ASEAN EV Battery Pack Market Revenue (billion), by Propulsion Type 2025 & 2033
- Figure 41: Europe ASEAN EV Battery Pack Market Revenue Share (%), by Propulsion Type 2025 & 2033
- Figure 42: Europe ASEAN EV Battery Pack Market Revenue (billion), by Battery Chemistry 2025 & 2033
- Figure 43: Europe ASEAN EV Battery Pack Market Revenue Share (%), by Battery Chemistry 2025 & 2033
- Figure 44: Europe ASEAN EV Battery Pack Market Revenue (billion), by Capacity 2025 & 2033
- Figure 45: Europe ASEAN EV Battery Pack Market Revenue Share (%), by Capacity 2025 & 2033
- Figure 46: Europe ASEAN EV Battery Pack Market Revenue (billion), by Battery Form 2025 & 2033
- Figure 47: Europe ASEAN EV Battery Pack Market Revenue Share (%), by Battery Form 2025 & 2033
- Figure 48: Europe ASEAN EV Battery Pack Market Revenue (billion), by Method 2025 & 2033
- Figure 49: Europe ASEAN EV Battery Pack Market Revenue Share (%), by Method 2025 & 2033
- Figure 50: Europe ASEAN EV Battery Pack Market Revenue (billion), by Component 2025 & 2033
- Figure 51: Europe ASEAN EV Battery Pack Market Revenue Share (%), by Component 2025 & 2033
- Figure 52: Europe ASEAN EV Battery Pack Market Revenue (billion), by Material Type 2025 & 2033
- Figure 53: Europe ASEAN EV Battery Pack Market Revenue Share (%), by Material Type 2025 & 2033
- Figure 54: Europe ASEAN EV Battery Pack Market Revenue (billion), by Country 2025 & 2033
- Figure 55: Europe ASEAN EV Battery Pack Market Revenue Share (%), by Country 2025 & 2033
- Figure 56: Middle East & Africa ASEAN EV Battery Pack Market Revenue (billion), by Body Type 2025 & 2033
- Figure 57: Middle East & Africa ASEAN EV Battery Pack Market Revenue Share (%), by Body Type 2025 & 2033
- Figure 58: Middle East & Africa ASEAN EV Battery Pack Market Revenue (billion), by Propulsion Type 2025 & 2033
- Figure 59: Middle East & Africa ASEAN EV Battery Pack Market Revenue Share (%), by Propulsion Type 2025 & 2033
- Figure 60: Middle East & Africa ASEAN EV Battery Pack Market Revenue (billion), by Battery Chemistry 2025 & 2033
- Figure 61: Middle East & Africa ASEAN EV Battery Pack Market Revenue Share (%), by Battery Chemistry 2025 & 2033
- Figure 62: Middle East & Africa ASEAN EV Battery Pack Market Revenue (billion), by Capacity 2025 & 2033
- Figure 63: Middle East & Africa ASEAN EV Battery Pack Market Revenue Share (%), by Capacity 2025 & 2033
- Figure 64: Middle East & Africa ASEAN EV Battery Pack Market Revenue (billion), by Battery Form 2025 & 2033
- Figure 65: Middle East & Africa ASEAN EV Battery Pack Market Revenue Share (%), by Battery Form 2025 & 2033
- Figure 66: Middle East & Africa ASEAN EV Battery Pack Market Revenue (billion), by Method 2025 & 2033
- Figure 67: Middle East & Africa ASEAN EV Battery Pack Market Revenue Share (%), by Method 2025 & 2033
- Figure 68: Middle East & Africa ASEAN EV Battery Pack Market Revenue (billion), by Component 2025 & 2033
- Figure 69: Middle East & Africa ASEAN EV Battery Pack Market Revenue Share (%), by Component 2025 & 2033
- Figure 70: Middle East & Africa ASEAN EV Battery Pack Market Revenue (billion), by Material Type 2025 & 2033
- Figure 71: Middle East & Africa ASEAN EV Battery Pack Market Revenue Share (%), by Material Type 2025 & 2033
- Figure 72: Middle East & Africa ASEAN EV Battery Pack Market Revenue (billion), by Country 2025 & 2033
- Figure 73: Middle East & Africa ASEAN EV Battery Pack Market Revenue Share (%), by Country 2025 & 2033
- Figure 74: Asia Pacific ASEAN EV Battery Pack Market Revenue (billion), by Body Type 2025 & 2033
- Figure 75: Asia Pacific ASEAN EV Battery Pack Market Revenue Share (%), by Body Type 2025 & 2033
- Figure 76: Asia Pacific ASEAN EV Battery Pack Market Revenue (billion), by Propulsion Type 2025 & 2033
- Figure 77: Asia Pacific ASEAN EV Battery Pack Market Revenue Share (%), by Propulsion Type 2025 & 2033
- Figure 78: Asia Pacific ASEAN EV Battery Pack Market Revenue (billion), by Battery Chemistry 2025 & 2033
- Figure 79: Asia Pacific ASEAN EV Battery Pack Market Revenue Share (%), by Battery Chemistry 2025 & 2033
- Figure 80: Asia Pacific ASEAN EV Battery Pack Market Revenue (billion), by Capacity 2025 & 2033
- Figure 81: Asia Pacific ASEAN EV Battery Pack Market Revenue Share (%), by Capacity 2025 & 2033
- Figure 82: Asia Pacific ASEAN EV Battery Pack Market Revenue (billion), by Battery Form 2025 & 2033
- Figure 83: Asia Pacific ASEAN EV Battery Pack Market Revenue Share (%), by Battery Form 2025 & 2033
- Figure 84: Asia Pacific ASEAN EV Battery Pack Market Revenue (billion), by Method 2025 & 2033
- Figure 85: Asia Pacific ASEAN EV Battery Pack Market Revenue Share (%), by Method 2025 & 2033
- Figure 86: Asia Pacific ASEAN EV Battery Pack Market Revenue (billion), by Component 2025 & 2033
- Figure 87: Asia Pacific ASEAN EV Battery Pack Market Revenue Share (%), by Component 2025 & 2033
- Figure 88: Asia Pacific ASEAN EV Battery Pack Market Revenue (billion), by Material Type 2025 & 2033
- Figure 89: Asia Pacific ASEAN EV Battery Pack Market Revenue Share (%), by Material Type 2025 & 2033
- Figure 90: Asia Pacific ASEAN EV Battery Pack Market Revenue (billion), by Country 2025 & 2033
- Figure 91: Asia Pacific ASEAN EV Battery Pack Market Revenue Share (%), by Country 2025 & 2033
List of Tables
- Table 1: Global ASEAN EV Battery Pack Market Revenue billion Forecast, by Body Type 2020 & 2033
- Table 2: Global ASEAN EV Battery Pack Market Revenue billion Forecast, by Propulsion Type 2020 & 2033
- Table 3: Global ASEAN EV Battery Pack Market Revenue billion Forecast, by Battery Chemistry 2020 & 2033
- Table 4: Global ASEAN EV Battery Pack Market Revenue billion Forecast, by Capacity 2020 & 2033
- Table 5: Global ASEAN EV Battery Pack Market Revenue billion Forecast, by Battery Form 2020 & 2033
- Table 6: Global ASEAN EV Battery Pack Market Revenue billion Forecast, by Method 2020 & 2033
- Table 7: Global ASEAN EV Battery Pack Market Revenue billion Forecast, by Component 2020 & 2033
- Table 8: Global ASEAN EV Battery Pack Market Revenue billion Forecast, by Material Type 2020 & 2033
- Table 9: Global ASEAN EV Battery Pack Market Revenue billion Forecast, by Region 2020 & 2033
- Table 10: Global ASEAN EV Battery Pack Market Revenue billion Forecast, by Body Type 2020 & 2033
- Table 11: Global ASEAN EV Battery Pack Market Revenue billion Forecast, by Propulsion Type 2020 & 2033
- Table 12: Global ASEAN EV Battery Pack Market Revenue billion Forecast, by Battery Chemistry 2020 & 2033
- Table 13: Global ASEAN EV Battery Pack Market Revenue billion Forecast, by Capacity 2020 & 2033
- Table 14: Global ASEAN EV Battery Pack Market Revenue billion Forecast, by Battery Form 2020 & 2033
- Table 15: Global ASEAN EV Battery Pack Market Revenue billion Forecast, by Method 2020 & 2033
- Table 16: Global ASEAN EV Battery Pack Market Revenue billion Forecast, by Component 2020 & 2033
- Table 17: Global ASEAN EV Battery Pack Market Revenue billion Forecast, by Material Type 2020 & 2033
- Table 18: Global ASEAN EV Battery Pack Market Revenue billion Forecast, by Country 2020 & 2033
- Table 19: United States ASEAN EV Battery Pack Market Revenue (billion) Forecast, by Application 2020 & 2033
- Table 20: Canada ASEAN EV Battery Pack Market Revenue (billion) Forecast, by Application 2020 & 2033
- Table 21: Mexico ASEAN EV Battery Pack Market Revenue (billion) Forecast, by Application 2020 & 2033
- Table 22: Global ASEAN EV Battery Pack Market Revenue billion Forecast, by Body Type 2020 & 2033
- Table 23: Global ASEAN EV Battery Pack Market Revenue billion Forecast, by Propulsion Type 2020 & 2033
- Table 24: Global ASEAN EV Battery Pack Market Revenue billion Forecast, by Battery Chemistry 2020 & 2033
- Table 25: Global ASEAN EV Battery Pack Market Revenue billion Forecast, by Capacity 2020 & 2033
- Table 26: Global ASEAN EV Battery Pack Market Revenue billion Forecast, by Battery Form 2020 & 2033
- Table 27: Global ASEAN EV Battery Pack Market Revenue billion Forecast, by Method 2020 & 2033
- Table 28: Global ASEAN EV Battery Pack Market Revenue billion Forecast, by Component 2020 & 2033
- Table 29: Global ASEAN EV Battery Pack Market Revenue billion Forecast, by Material Type 2020 & 2033
- Table 30: Global ASEAN EV Battery Pack Market Revenue billion Forecast, by Country 2020 & 2033
- Table 31: Brazil ASEAN EV Battery Pack Market Revenue (billion) Forecast, by Application 2020 & 2033
- Table 32: Argentina ASEAN EV Battery Pack Market Revenue (billion) Forecast, by Application 2020 & 2033
- Table 33: Rest of South America ASEAN EV Battery Pack Market Revenue (billion) Forecast, by Application 2020 & 2033
- Table 34: Global ASEAN EV Battery Pack Market Revenue billion Forecast, by Body Type 2020 & 2033
- Table 35: Global ASEAN EV Battery Pack Market Revenue billion Forecast, by Propulsion Type 2020 & 2033
- Table 36: Global ASEAN EV Battery Pack Market Revenue billion Forecast, by Battery Chemistry 2020 & 2033
- Table 37: Global ASEAN EV Battery Pack Market Revenue billion Forecast, by Capacity 2020 & 2033
- Table 38: Global ASEAN EV Battery Pack Market Revenue billion Forecast, by Battery Form 2020 & 2033
- Table 39: Global ASEAN EV Battery Pack Market Revenue billion Forecast, by Method 2020 & 2033
- Table 40: Global ASEAN EV Battery Pack Market Revenue billion Forecast, by Component 2020 & 2033
- Table 41: Global ASEAN EV Battery Pack Market Revenue billion Forecast, by Material Type 2020 & 2033
- Table 42: Global ASEAN EV Battery Pack Market Revenue billion Forecast, by Country 2020 & 2033
- Table 43: United Kingdom ASEAN EV Battery Pack Market Revenue (billion) Forecast, by Application 2020 & 2033
- Table 44: Germany ASEAN EV Battery Pack Market Revenue (billion) Forecast, by Application 2020 & 2033
- Table 45: France ASEAN EV Battery Pack Market Revenue (billion) Forecast, by Application 2020 & 2033
- Table 46: Italy ASEAN EV Battery Pack Market Revenue (billion) Forecast, by Application 2020 & 2033
- Table 47: Spain ASEAN EV Battery Pack Market Revenue (billion) Forecast, by Application 2020 & 2033
- Table 48: Russia ASEAN EV Battery Pack Market Revenue (billion) Forecast, by Application 2020 & 2033
- Table 49: Benelux ASEAN EV Battery Pack Market Revenue (billion) Forecast, by Application 2020 & 2033
- Table 50: Nordics ASEAN EV Battery Pack Market Revenue (billion) Forecast, by Application 2020 & 2033
- Table 51: Rest of Europe ASEAN EV Battery Pack Market Revenue (billion) Forecast, by Application 2020 & 2033
- Table 52: Global ASEAN EV Battery Pack Market Revenue billion Forecast, by Body Type 2020 & 2033
- Table 53: Global ASEAN EV Battery Pack Market Revenue billion Forecast, by Propulsion Type 2020 & 2033
- Table 54: Global ASEAN EV Battery Pack Market Revenue billion Forecast, by Battery Chemistry 2020 & 2033
- Table 55: Global ASEAN EV Battery Pack Market Revenue billion Forecast, by Capacity 2020 & 2033
- Table 56: Global ASEAN EV Battery Pack Market Revenue billion Forecast, by Battery Form 2020 & 2033
- Table 57: Global ASEAN EV Battery Pack Market Revenue billion Forecast, by Method 2020 & 2033
- Table 58: Global ASEAN EV Battery Pack Market Revenue billion Forecast, by Component 2020 & 2033
- Table 59: Global ASEAN EV Battery Pack Market Revenue billion Forecast, by Material Type 2020 & 2033
- Table 60: Global ASEAN EV Battery Pack Market Revenue billion Forecast, by Country 2020 & 2033
- Table 61: Turkey ASEAN EV Battery Pack Market Revenue (billion) Forecast, by Application 2020 & 2033
- Table 62: Israel ASEAN EV Battery Pack Market Revenue (billion) Forecast, by Application 2020 & 2033
- Table 63: GCC ASEAN EV Battery Pack Market Revenue (billion) Forecast, by Application 2020 & 2033
- Table 64: North Africa ASEAN EV Battery Pack Market Revenue (billion) Forecast, by Application 2020 & 2033
- Table 65: South Africa ASEAN EV Battery Pack Market Revenue (billion) Forecast, by Application 2020 & 2033
- Table 66: Rest of Middle East & Africa ASEAN EV Battery Pack Market Revenue (billion) Forecast, by Application 2020 & 2033
- Table 67: Global ASEAN EV Battery Pack Market Revenue billion Forecast, by Body Type 2020 & 2033
- Table 68: Global ASEAN EV Battery Pack Market Revenue billion Forecast, by Propulsion Type 2020 & 2033
- Table 69: Global ASEAN EV Battery Pack Market Revenue billion Forecast, by Battery Chemistry 2020 & 2033
- Table 70: Global ASEAN EV Battery Pack Market Revenue billion Forecast, by Capacity 2020 & 2033
- Table 71: Global ASEAN EV Battery Pack Market Revenue billion Forecast, by Battery Form 2020 & 2033
- Table 72: Global ASEAN EV Battery Pack Market Revenue billion Forecast, by Method 2020 & 2033
- Table 73: Global ASEAN EV Battery Pack Market Revenue billion Forecast, by Component 2020 & 2033
- Table 74: Global ASEAN EV Battery Pack Market Revenue billion Forecast, by Material Type 2020 & 2033
- Table 75: Global ASEAN EV Battery Pack Market Revenue billion Forecast, by Country 2020 & 2033
- Table 76: China ASEAN EV Battery Pack Market Revenue (billion) Forecast, by Application 2020 & 2033
- Table 77: India ASEAN EV Battery Pack Market Revenue (billion) Forecast, by Application 2020 & 2033
- Table 78: Japan ASEAN EV Battery Pack Market Revenue (billion) Forecast, by Application 2020 & 2033
- Table 79: South Korea ASEAN EV Battery Pack Market Revenue (billion) Forecast, by Application 2020 & 2033
- Table 80: ASEAN ASEAN EV Battery Pack Market Revenue (billion) Forecast, by Application 2020 & 2033
- Table 81: Oceania ASEAN EV Battery Pack Market Revenue (billion) Forecast, by Application 2020 & 2033
- Table 82: Rest of Asia Pacific ASEAN EV Battery Pack Market Revenue (billion) Forecast, by Application 2020 & 2033
Frequently Asked Questions
1. What is the projected Compound Annual Growth Rate (CAGR) of the ASEAN EV Battery Pack Market?
The projected CAGR is approximately 34.68%.
2. Which companies are prominent players in the ASEAN EV Battery Pack Market?
Key companies in the market include Ningde E-CON Power System Co Ltd, Denso Corporation, Samsung SDI Co Ltd, LG Energy Solution Ltd, Guoxuan High-tech Co Ltd, SVOLT Energy Technology Co Ltd (SVOLT, Deutsche ACCUmotive GmbH & Co KG, Contemporary Amperex Technology Co Ltd (CATL), BYD Company Ltd, SK Innovation Co Ltd, Do-Fluoride (Jiaozuo) New Energy Technology, Panasonic Holdings Corporation.
3. What are the main segments of the ASEAN EV Battery Pack Market?
The market segments include Body Type, Propulsion Type, Battery Chemistry, Capacity, Battery Form, Method, Component, Material Type.
4. Can you provide details about the market size?
The market size is estimated to be USD 0.33 billion as of 2022.
5. What are some drivers contributing to market growth?
Governments worldwide are implementing strict regulations and providing incentives to promote the adoption of electric vehicles; Others.
6. What are the notable trends driving market growth?
OTHER KEY INDUSTRY TRENDS COVERED IN THE REPORT.
7. Are there any restraints impacting market growth?
High Initial Costs; Others.
8. Can you provide examples of recent developments in the market?
April 2023: CATL announced that it will launch its sodium-ion battery in Chery models first. In addition, the two parties will jointly build the new ENER-Q battery brand, covering all application scenarios of all power types and all material systems.March 2023: Contemporary Amperex Technology Co., Ltd. (CATL) announced that it signed a strategic cooperation agreement on business cooperation and advanced technology development with Beijing Automotive Group Co., Ltd. (BAIC Group).March 2023: Contemporary Amperex Technology Co., Ltd. (CATL) announced that it has established a joint venture (JV) named Jiefang Shidai New Energy Technology Co., Ltd. with FAW Jiefang Automotive Co., Ltd. (FAW Jiefang). The JV has a registered capital of CNY 90 million, with CATL and FAW Jiefang each holding a 50% share.
9. What pricing options are available for accessing the report?
Pricing options include single-user, multi-user, and enterprise licenses priced at USD 3800, USD 4500, and USD 5800 respectively.
10. Is the market size provided in terms of value or volume?
The market size is provided in terms of value, measured in billion.
11. Are there any specific market keywords associated with the report?
Yes, the market keyword associated with the report is "ASEAN EV Battery Pack Market," which aids in identifying and referencing the specific market segment covered.
12. How do I determine which pricing option suits my needs best?
The pricing options vary based on user requirements and access needs. Individual users may opt for single-user licenses, while businesses requiring broader access may choose multi-user or enterprise licenses for cost-effective access to the report.
13. Are there any additional resources or data provided in the ASEAN EV Battery Pack Market report?
While the report offers comprehensive insights, it's advisable to review the specific contents or supplementary materials provided to ascertain if additional resources or data are available.
14. How can I stay updated on further developments or reports in the ASEAN EV Battery Pack Market?
To stay informed about further developments, trends, and reports in the ASEAN EV Battery Pack Market, consider subscribing to industry newsletters, following relevant companies and organizations, or regularly checking reputable industry news sources and publications.
Methodology
Step 1 - Identification of Relevant Samples Size from Population Database


Step 2 - Approaches for Defining Global Market Size (Value, Volume* & Price*)

Note*: In applicable scenarios
Step 3 - Data Sources
Primary Research
- Web Analytics
- Survey Reports
- Research Institute
- Latest Research Reports
- Opinion Leaders
Secondary Research
- Annual Reports
- White Paper
- Latest Press Release
- Industry Association
- Paid Database
- Investor Presentations

Step 4 - Data Triangulation
Involves using different sources of information in order to increase the validity of a study
These sources are likely to be stakeholders in a program - participants, other researchers, program staff, other community members, and so on.
Then we put all data in single framework & apply various statistical tools to find out the dynamic on the market.
During the analysis stage, feedback from the stakeholder groups would be compared to determine areas of agreement as well as areas of divergence