

Key Insights
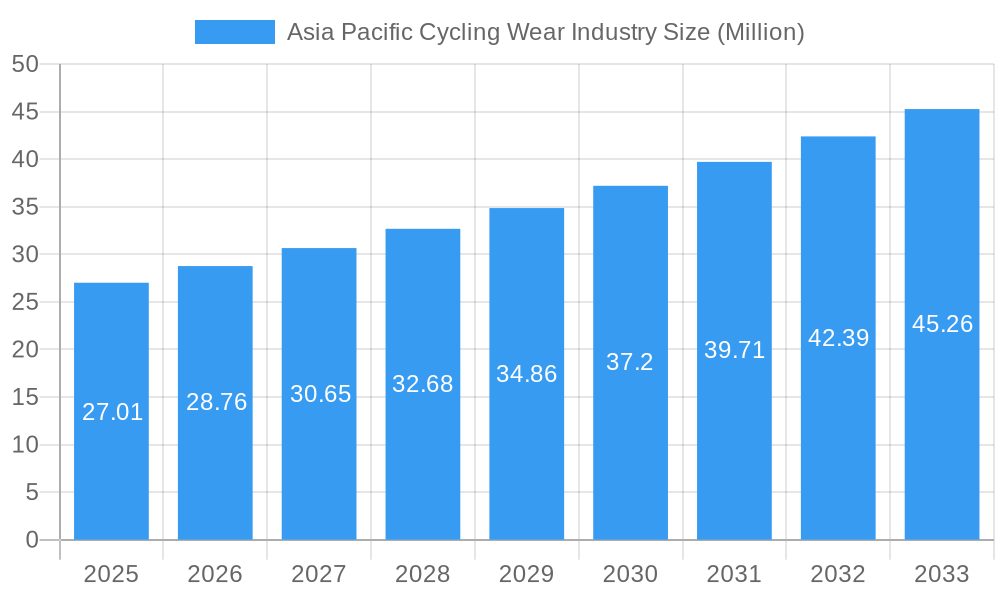
The Asia-Pacific cycling wear market, valued at $27.01 million in 2025, is projected to experience robust growth, driven by a rising health-conscious population embracing cycling for fitness and recreation. The region's burgeoning middle class, coupled with increasing disposable incomes, fuels demand for high-performance and stylish cycling apparel. Government initiatives promoting cycling infrastructure and sustainable transportation in key markets like China, India, and Japan further contribute to market expansion. The increasing popularity of e-bicycles also positively impacts the market, as these bikes cater to a wider range of users and usage scenarios, necessitating specialized apparel. The market is segmented by product type (road cycling wear, mountain biking wear, casual cycling wear, etc.) and distribution channel (offline retail stores, online retail stores), with online channels witnessing significant growth due to e-commerce penetration and convenience. While the market faces some challenges, like price sensitivity in certain segments and competition from cheaper alternatives, the overall growth trajectory remains positive, primarily fueled by changing lifestyles and an increased focus on health and wellness. The presence of both established international brands and growing local players indicates a vibrant and dynamic market landscape. Specific growth within segments like high-performance cycling wear and specialized apparel for e-cycling is anticipated to outpace the overall market average.
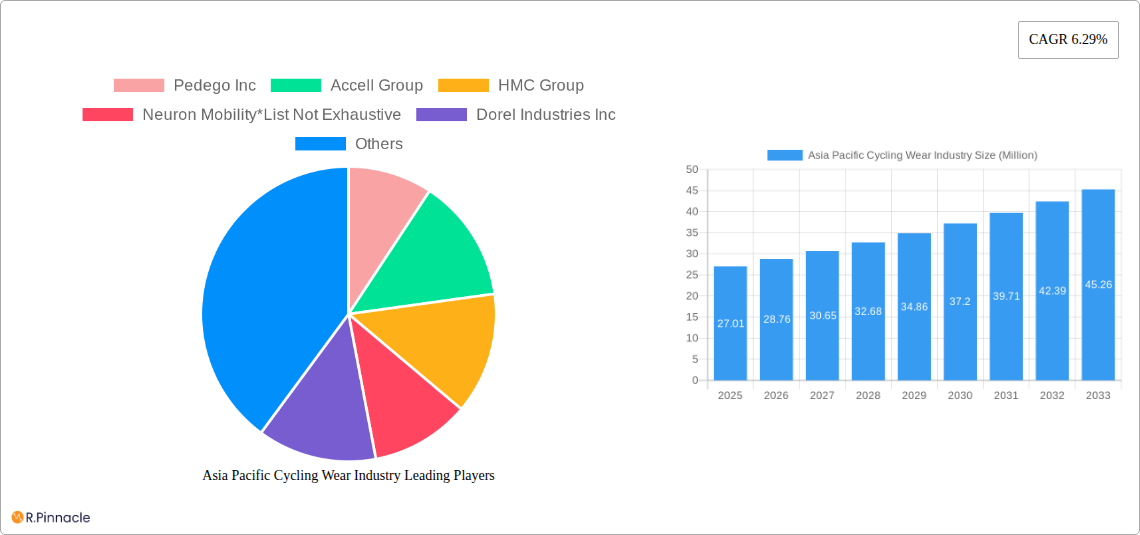
Asia Pacific Cycling Wear Industry Market Size (In Million)
The forecast period (2025-2033) anticipates a sustained CAGR of 6.29%, indicating continuous expansion. This growth is expected to be uneven across the region, with countries like China and India experiencing faster growth due to their large populations and rapidly developing economies. Japan, South Korea, and Australia, while having smaller populations, are expected to contribute significantly due to their higher per capita income and established cycling culture. Competitive pressures from international brands and the emergence of local players will drive innovation and product diversification, further stimulating market growth. Successful players will likely focus on targeted marketing campaigns, product differentiation based on performance and style, and expanding their online presence to capture the growing e-commerce market share.
Asia Pacific Cycling Wear Industry Company Market Share
Asia Pacific Cycling Wear Industry: Market Report 2019-2033
This comprehensive report provides an in-depth analysis of the Asia Pacific cycling wear industry, offering invaluable insights for industry professionals, investors, and strategists. Covering the period from 2019 to 2033, with a focus on 2025, this report unveils market trends, competitive landscapes, and future growth opportunities. Expect detailed segmentation, including type (Road, Hybrid, All Terrain, E-bikes, Other) and distribution channels (Offline, Online Retail), alongside financial projections reaching xx Million USD by 2033.
Asia Pacific Cycling Wear Industry Market Structure & Innovation Trends
The Asia Pacific cycling wear market exhibits a moderately concentrated structure, with key players like Giant Bicycles, Merida Bikes, and Accell Group holding significant market share. However, the presence of numerous smaller, regional players contributes to a dynamic competitive environment. Innovation is driven by technological advancements in e-bike technology, lightweight materials, and enhanced safety features. Government regulations focusing on emission reduction and promotion of sustainable transport further shape the industry landscape. Product substitutes, including other forms of personal transportation, present a constant challenge. The end-user demographic is broadening, encompassing a wider range of ages and fitness levels. M&A activity in the past five years has involved xx deals, with an estimated total value of xx Million USD, signaling industry consolidation and strategic expansion.
- Market Concentration: Moderately concentrated, with significant players holding xx% of market share.
- Innovation Drivers: E-bike technology, lightweight materials, safety features, government regulations.
- Regulatory Framework: Focus on emission reduction and sustainable transport.
- Product Substitutes: Public transport, cars, other personal mobility devices.
- End-User Demographics: Expanding to include diverse age groups and fitness levels.
- M&A Activity (2019-2024): xx deals, totaling xx Million USD in value.
Asia Pacific Cycling Wear Industry Market Dynamics & Trends
The Asia Pacific cycling wear market is experiencing robust growth, driven by rising health consciousness, increasing urbanization, and government initiatives promoting cycling infrastructure. Technological disruptions, such as the integration of smart features in e-bikes and the development of advanced materials, are reshaping the industry. Consumer preferences are shifting towards lightweight, comfortable, and technologically advanced bicycles. Intense competition among established players and new entrants necessitates constant innovation and strategic maneuvering. The CAGR for the period 2025-2033 is projected at xx%, with market penetration expected to reach xx% by 2033.
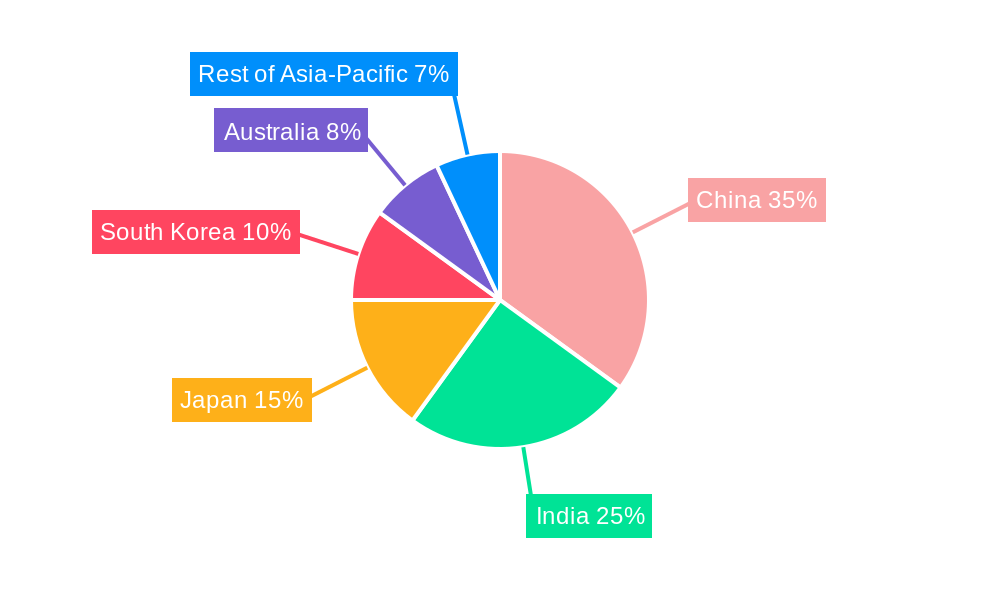
Dominant Regions & Segments in Asia Pacific Cycling Wear Industry
China and Japan currently dominate the Asia Pacific cycling wear market, driven by strong economic growth, a large consumer base, and well-established cycling cultures. Within product segments, E-bikes are exhibiting the fastest growth, fueled by government incentives and technological advancements. Online retail channels are gaining traction, although offline stores remain crucial for sales.
- Key Drivers in China: Strong economic growth, large consumer base, government support for cycling infrastructure.
- Key Drivers in Japan: Established cycling culture, high disposable incomes, technological advancements.
- Fastest Growing Segment: E-bikes, driven by government incentives and technological innovation.
- Distribution Channel Trends: Growth in online retail, but offline stores remain important.
Asia Pacific Cycling Wear Industry Product Innovations
Recent product innovations are largely focused on improving e-bike technology, integrating smart features, and enhancing comfort and safety. Developments include longer-lasting batteries, improved motor performance, and advanced safety systems. These innovations cater to evolving consumer preferences and competitive pressures, increasing market penetration.
Report Scope & Segmentation Analysis
This report segments the Asia Pacific cycling wear market by Type (Road Bicycles, Hybrid Bicycles, All Terrain Bicycles, E-Bicycles, Other Types) and Distribution Channel (Offline Retail Stores, Online Retail Stores). Each segment's growth projections, market sizes, and competitive dynamics are analyzed in detail, providing a granular understanding of the market structure. E-bikes are expected to have the highest growth rate during the forecast period. Online retail is experiencing faster growth than offline retail.
Key Drivers of Asia Pacific Cycling Wear Industry Growth
Several factors fuel the growth of the Asia Pacific cycling wear industry. Rising health awareness is encouraging more people to adopt cycling as a form of exercise and recreation. Government initiatives promoting cycling infrastructure and sustainable transport are also driving market expansion. Technological advancements in e-bike technology, materials, and safety features are creating innovative and attractive products. Economic growth in several Asian countries is increasing disposable incomes, allowing more people to purchase bicycles.
Challenges in the Asia Pacific Cycling Wear Industry Sector
The industry faces challenges such as fluctuating raw material costs, intense competition, and supply chain disruptions. Regulatory hurdles in some countries can also hinder market growth. The increasing popularity of other forms of transportation poses a constant threat. These factors can impact profitability and growth projections. The estimated impact is xx% reduction in profit margins for some manufacturers.
Emerging Opportunities in Asia Pacific Cycling Wear Industry
The Asia Pacific cycling wear market presents numerous opportunities. The growth of e-bike technology opens new market segments, while expanding into less developed markets with rising middle classes provides untapped potential. Integrating smart features and developing sustainable materials offers opportunities for innovation and differentiation. Focusing on niche markets such as cargo bikes and specialized cycling apparel can unlock further growth prospects.
Leading Players in the Asia Pacific Cycling Wear Industry Market
- Pedego Inc
- Accell Group
- HMC Group
- Neuron Mobility
- Dorel Industries Inc
- Nixeycles
- Merida Bikes
- Giant Bicycles
- Benno Bikes LLC
- Avon Cycles Ltd
- Bridgestone Corporation
Key Developments in Asia Pacific Cycling Wear Industry Industry
- June 2022: Ninety One Cycles launched the Black Arrow 700C bike with features like a 7-speed EZ fire rear shifter and 160mm disk brakes.
- April 2022: Neuron Mobility launched a fleet of 250 e-bikes in Sydney, Australia, equipped with Google Maps integration.
- October 2021: Hero Motor (HMC) and Yamaha formed a joint venture to produce electric motors for e-bikes.
Future Outlook for Asia Pacific Cycling Wear Industry Market
The Asia Pacific cycling wear market is poised for continued expansion, driven by technological advancements, government support, and rising consumer demand. Strategic partnerships, innovation in e-bike technology, and expansion into new markets will be key to realizing future market potential. The market is expected to grow significantly in the coming years, particularly in the e-bike segment.
Asia Pacific Cycling Wear Industry Segmentation
-
1. Type
- 1.1. Road Bicycles
- 1.2. Hybrid Bicycles
- 1.3. All-trrain Bicycles
- 1.4. E-bicycles
- 1.5. Other Types
-
2. Distribution Channel
- 2.1. Offline Retail Stores
- 2.2. Online Retail Stores
Asia Pacific Cycling Wear Industry Segmentation By Geography
-
1. Asia Pacific
- 1.1. China
- 1.2. Japan
- 1.3. South Korea
- 1.4. India
- 1.5. Australia
- 1.6. New Zealand
- 1.7. Indonesia
- 1.8. Malaysia
- 1.9. Singapore
- 1.10. Thailand
- 1.11. Vietnam
- 1.12. Philippines
Asia Pacific Cycling Wear Industry Regional Market Share
Geographic Coverage of Asia Pacific Cycling Wear Industry
Asia Pacific Cycling Wear Industry REPORT HIGHLIGHTS
| Aspects | Details |
|---|---|
| Study Period | 2020-2034 |
| Base Year | 2025 |
| Estimated Year | 2026 |
| Forecast Period | 2026-2034 |
| Historical Period | 2020-2025 |
| Growth Rate | CAGR of 6.29% from 2020-2034 |
| Segmentation |
|
Table of Contents
- 1. Introduction
- 1.1. Research Scope
- 1.2. Market Segmentation
- 1.3. Research Objective
- 1.4. Definitions and Assumptions
- 2. Executive Summary
- 2.1. Market Snapshot
- 3. Market Dynamics
- 3.1. Market Drivers
- 3.2. Market Restrains
- 3.3. Market Trends
- 3.4. Market Opportunities
- 4. Market Factor Analysis
- 4.1. Porters Five Forces
- 4.1.1. Bargaining Power of Suppliers
- 4.1.2. Bargaining Power of Buyers
- 4.1.3. Threat of New Entrants
- 4.1.4. Threat of Substitutes
- 4.1.5. Competitive Rivalry
- 4.2. PESTEL analysis
- 4.3. BCG Analysis
- 4.3.1. Stars (High Growth, High Market Share)
- 4.3.2. Cash Cows (Low Growth, High Market Share)
- 4.3.3. Question Mark (High Growth, Low Market Share)
- 4.3.4. Dogs (Low Growth, Low Market Share)
- 4.4. Ansoff Matrix Analysis
- 4.5. Supply Chain Analysis
- 4.6. Regulatory Landscape
- 4.7. Current Market Potential and Opportunity Assessment (TAM–SAM–SOM Framework)
- 4.8. PRI Analyst Note
- 4.1. Porters Five Forces
- 5. Market Analysis, Insights and Forecast 2021-2033
- 5.1. Market Analysis, Insights and Forecast - by Type
- 5.1.1. Road Bicycles
- 5.1.2. Hybrid Bicycles
- 5.1.3. All-trrain Bicycles
- 5.1.4. E-bicycles
- 5.1.5. Other Types
- 5.2. Market Analysis, Insights and Forecast - by Distribution Channel
- 5.2.1. Offline Retail Stores
- 5.2.2. Online Retail Stores
- 5.3. Market Analysis, Insights and Forecast - by Region
- 5.3.1. Asia Pacific
- 5.1. Market Analysis, Insights and Forecast - by Type
- 6. Asia Pacific Cycling Wear Industry Analysis, Insights and Forecast, 2021-2033
- 6.1. Market Analysis, Insights and Forecast - by Type
- 6.1.1. Road Bicycles
- 6.1.2. Hybrid Bicycles
- 6.1.3. All-trrain Bicycles
- 6.1.4. E-bicycles
- 6.1.5. Other Types
- 6.2. Market Analysis, Insights and Forecast - by Distribution Channel
- 6.2.1. Offline Retail Stores
- 6.2.2. Online Retail Stores
- 6.1. Market Analysis, Insights and Forecast - by Type
- 7. Competitive Analysis
- 7.1. Company Profiles
- 7.1.1 Pedego Inc
- 7.1.1.1. Company Overview
- 7.1.1.2. Products
- 7.1.1.3. Company Financials
- 7.1.1.4. SWOT Analysis
- 7.1.2 Accell Group
- 7.1.2.1. Company Overview
- 7.1.2.2. Products
- 7.1.2.3. Company Financials
- 7.1.2.4. SWOT Analysis
- 7.1.3 HMC Group
- 7.1.3.1. Company Overview
- 7.1.3.2. Products
- 7.1.3.3. Company Financials
- 7.1.3.4. SWOT Analysis
- 7.1.4 Neuron Mobility*List Not Exhaustive
- 7.1.4.1. Company Overview
- 7.1.4.2. Products
- 7.1.4.3. Company Financials
- 7.1.4.4. SWOT Analysis
- 7.1.5 Dorel Industries Inc
- 7.1.5.1. Company Overview
- 7.1.5.2. Products
- 7.1.5.3. Company Financials
- 7.1.5.4. SWOT Analysis
- 7.1.6 Nixeycles
- 7.1.6.1. Company Overview
- 7.1.6.2. Products
- 7.1.6.3. Company Financials
- 7.1.6.4. SWOT Analysis
- 7.1.7 Merida Bikes
- 7.1.7.1. Company Overview
- 7.1.7.2. Products
- 7.1.7.3. Company Financials
- 7.1.7.4. SWOT Analysis
- 7.1.8 Giant Bicycles
- 7.1.8.1. Company Overview
- 7.1.8.2. Products
- 7.1.8.3. Company Financials
- 7.1.8.4. SWOT Analysis
- 7.1.9 Benno Bikes LLC
- 7.1.9.1. Company Overview
- 7.1.9.2. Products
- 7.1.9.3. Company Financials
- 7.1.9.4. SWOT Analysis
- 7.1.10 Avon Cycles Ltd
- 7.1.10.1. Company Overview
- 7.1.10.2. Products
- 7.1.10.3. Company Financials
- 7.1.10.4. SWOT Analysis
- 7.1.11 Bridgestone Corporation
- 7.1.11.1. Company Overview
- 7.1.11.2. Products
- 7.1.11.3. Company Financials
- 7.1.11.4. SWOT Analysis
- 7.1.1 Pedego Inc
- 7.2. Market Entropy
- 7.2.1 Company's Key Areas Served
- 7.2.2 Recent Developments
- 7.3. Company Market Share Analysis 2025
- 7.3.1 Top 5 Companies Market Share Analysis
- 7.3.2 Top 3 Companies Market Share Analysis
- 7.4. List of Potential Customers
- 8. Research Methodology
List of Figures
- Figure 1: Asia Pacific Cycling Wear Industry Revenue Breakdown (Million, %) by Product 2025 & 2033
- Figure 2: Asia Pacific Cycling Wear Industry Share (%) by Company 2025
List of Tables
- Table 1: Asia Pacific Cycling Wear Industry Revenue Million Forecast, by Type 2020 & 2033
- Table 2: Asia Pacific Cycling Wear Industry Revenue Million Forecast, by Distribution Channel 2020 & 2033
- Table 3: Asia Pacific Cycling Wear Industry Revenue Million Forecast, by Region 2020 & 2033
- Table 4: Asia Pacific Cycling Wear Industry Revenue Million Forecast, by Type 2020 & 2033
- Table 5: Asia Pacific Cycling Wear Industry Revenue Million Forecast, by Distribution Channel 2020 & 2033
- Table 6: Asia Pacific Cycling Wear Industry Revenue Million Forecast, by Country 2020 & 2033
- Table 7: China Asia Pacific Cycling Wear Industry Revenue (Million) Forecast, by Application 2020 & 2033
- Table 8: Japan Asia Pacific Cycling Wear Industry Revenue (Million) Forecast, by Application 2020 & 2033
- Table 9: South Korea Asia Pacific Cycling Wear Industry Revenue (Million) Forecast, by Application 2020 & 2033
- Table 10: India Asia Pacific Cycling Wear Industry Revenue (Million) Forecast, by Application 2020 & 2033
- Table 11: Australia Asia Pacific Cycling Wear Industry Revenue (Million) Forecast, by Application 2020 & 2033
- Table 12: New Zealand Asia Pacific Cycling Wear Industry Revenue (Million) Forecast, by Application 2020 & 2033
- Table 13: Indonesia Asia Pacific Cycling Wear Industry Revenue (Million) Forecast, by Application 2020 & 2033
- Table 14: Malaysia Asia Pacific Cycling Wear Industry Revenue (Million) Forecast, by Application 2020 & 2033
- Table 15: Singapore Asia Pacific Cycling Wear Industry Revenue (Million) Forecast, by Application 2020 & 2033
- Table 16: Thailand Asia Pacific Cycling Wear Industry Revenue (Million) Forecast, by Application 2020 & 2033
- Table 17: Vietnam Asia Pacific Cycling Wear Industry Revenue (Million) Forecast, by Application 2020 & 2033
- Table 18: Philippines Asia Pacific Cycling Wear Industry Revenue (Million) Forecast, by Application 2020 & 2033
Frequently Asked Questions
1. What is the projected Compound Annual Growth Rate (CAGR) of the Asia Pacific Cycling Wear Industry?
The projected CAGR is approximately 6.29%.
2. Which companies are prominent players in the Asia Pacific Cycling Wear Industry?
Key companies in the market include Pedego Inc, Accell Group, HMC Group, Neuron Mobility*List Not Exhaustive, Dorel Industries Inc, Nixeycles, Merida Bikes, Giant Bicycles, Benno Bikes LLC, Avon Cycles Ltd, Bridgestone Corporation.
3. What are the main segments of the Asia Pacific Cycling Wear Industry?
The market segments include Type, Distribution Channel.
4. Can you provide details about the market size?
The market size is estimated to be USD 27.01 Million as of 2022.
5. What are some drivers contributing to market growth?
Aggressive Advertisement And Promotional Activities; Advancement In Security. Encryption. And Streaming Technology.
6. What are the notable trends driving market growth?
Continuation of Increasing Demand for Bicycles in India.
7. Are there any restraints impacting market growth?
Regulatory and Legal Challenges.
8. Can you provide examples of recent developments in the market?
In June 2022, Ninety One Cycles launched a new Black Arrow 700C bike. The features of the bike include a 7-speed EZ fire rear shifter, a hybrid fork for jerk absorption, and a Shimano 7-speed gear set. The cycle comes with 160mm disk brakes and high-traction nylon tires.
9. What pricing options are available for accessing the report?
Pricing options include single-user, multi-user, and enterprise licenses priced at USD 4750, USD 4950, and USD 6800 respectively.
10. Is the market size provided in terms of value or volume?
The market size is provided in terms of value, measured in Million.
11. Are there any specific market keywords associated with the report?
Yes, the market keyword associated with the report is "Asia Pacific Cycling Wear Industry," which aids in identifying and referencing the specific market segment covered.
12. How do I determine which pricing option suits my needs best?
The pricing options vary based on user requirements and access needs. Individual users may opt for single-user licenses, while businesses requiring broader access may choose multi-user or enterprise licenses for cost-effective access to the report.
13. Are there any additional resources or data provided in the Asia Pacific Cycling Wear Industry report?
While the report offers comprehensive insights, it's advisable to review the specific contents or supplementary materials provided to ascertain if additional resources or data are available.
14. How can I stay updated on further developments or reports in the Asia Pacific Cycling Wear Industry?
To stay informed about further developments, trends, and reports in the Asia Pacific Cycling Wear Industry, consider subscribing to industry newsletters, following relevant companies and organizations, or regularly checking reputable industry news sources and publications.
Methodology
Step 1 - Identification of Relevant Samples Size from Population Database


Step 2 - Approaches for Defining Global Market Size (Value, Volume* & Price*)

Note*: In applicable scenarios
Step 3 - Data Sources
Primary Research
- Web Analytics
- Survey Reports
- Research Institute
- Latest Research Reports
- Opinion Leaders
Secondary Research
- Annual Reports
- White Paper
- Latest Press Release
- Industry Association
- Paid Database
- Investor Presentations

Step 4 - Data Triangulation
Involves using different sources of information in order to increase the validity of a study
These sources are likely to be stakeholders in a program - participants, other researchers, program staff, other community members, and so on.
Then we put all data in single framework & apply various statistical tools to find out the dynamic on the market.
During the analysis stage, feedback from the stakeholder groups would be compared to determine areas of agreement as well as areas of divergence