

Key Insights
The Asia-Pacific remote sensing satellites market is experiencing robust growth, driven by increasing government investments in space exploration and defense, coupled with rising demand for high-resolution imagery from commercial sectors like agriculture, urban planning, and environmental monitoring. The market's Compound Annual Growth Rate (CAGR) of 4.96% from 2019-2024 indicates a steady upward trajectory, projected to continue into the forecast period (2025-2033). Key segments fueling this expansion include the burgeoning demand for smaller, more affordable satellites (Below 10kg and 10-100kg categories) driven by the proliferation of CubeSats and nanosatellites. The LEO (Low Earth Orbit) segment is also experiencing significant growth due to its advantages in providing high-resolution imagery and near real-time data acquisition. Major players like Mitsubishi Heavy Industries, Lockheed Martin, and Maxar Technologies are strategically positioned to capitalize on this expansion, investing in advanced technologies and forming strategic partnerships to expand their market share within the region. The Asia-Pacific region, particularly China, Japan, India, and South Korea, are leading the charge in terms of technological advancements, satellite deployments, and government support.
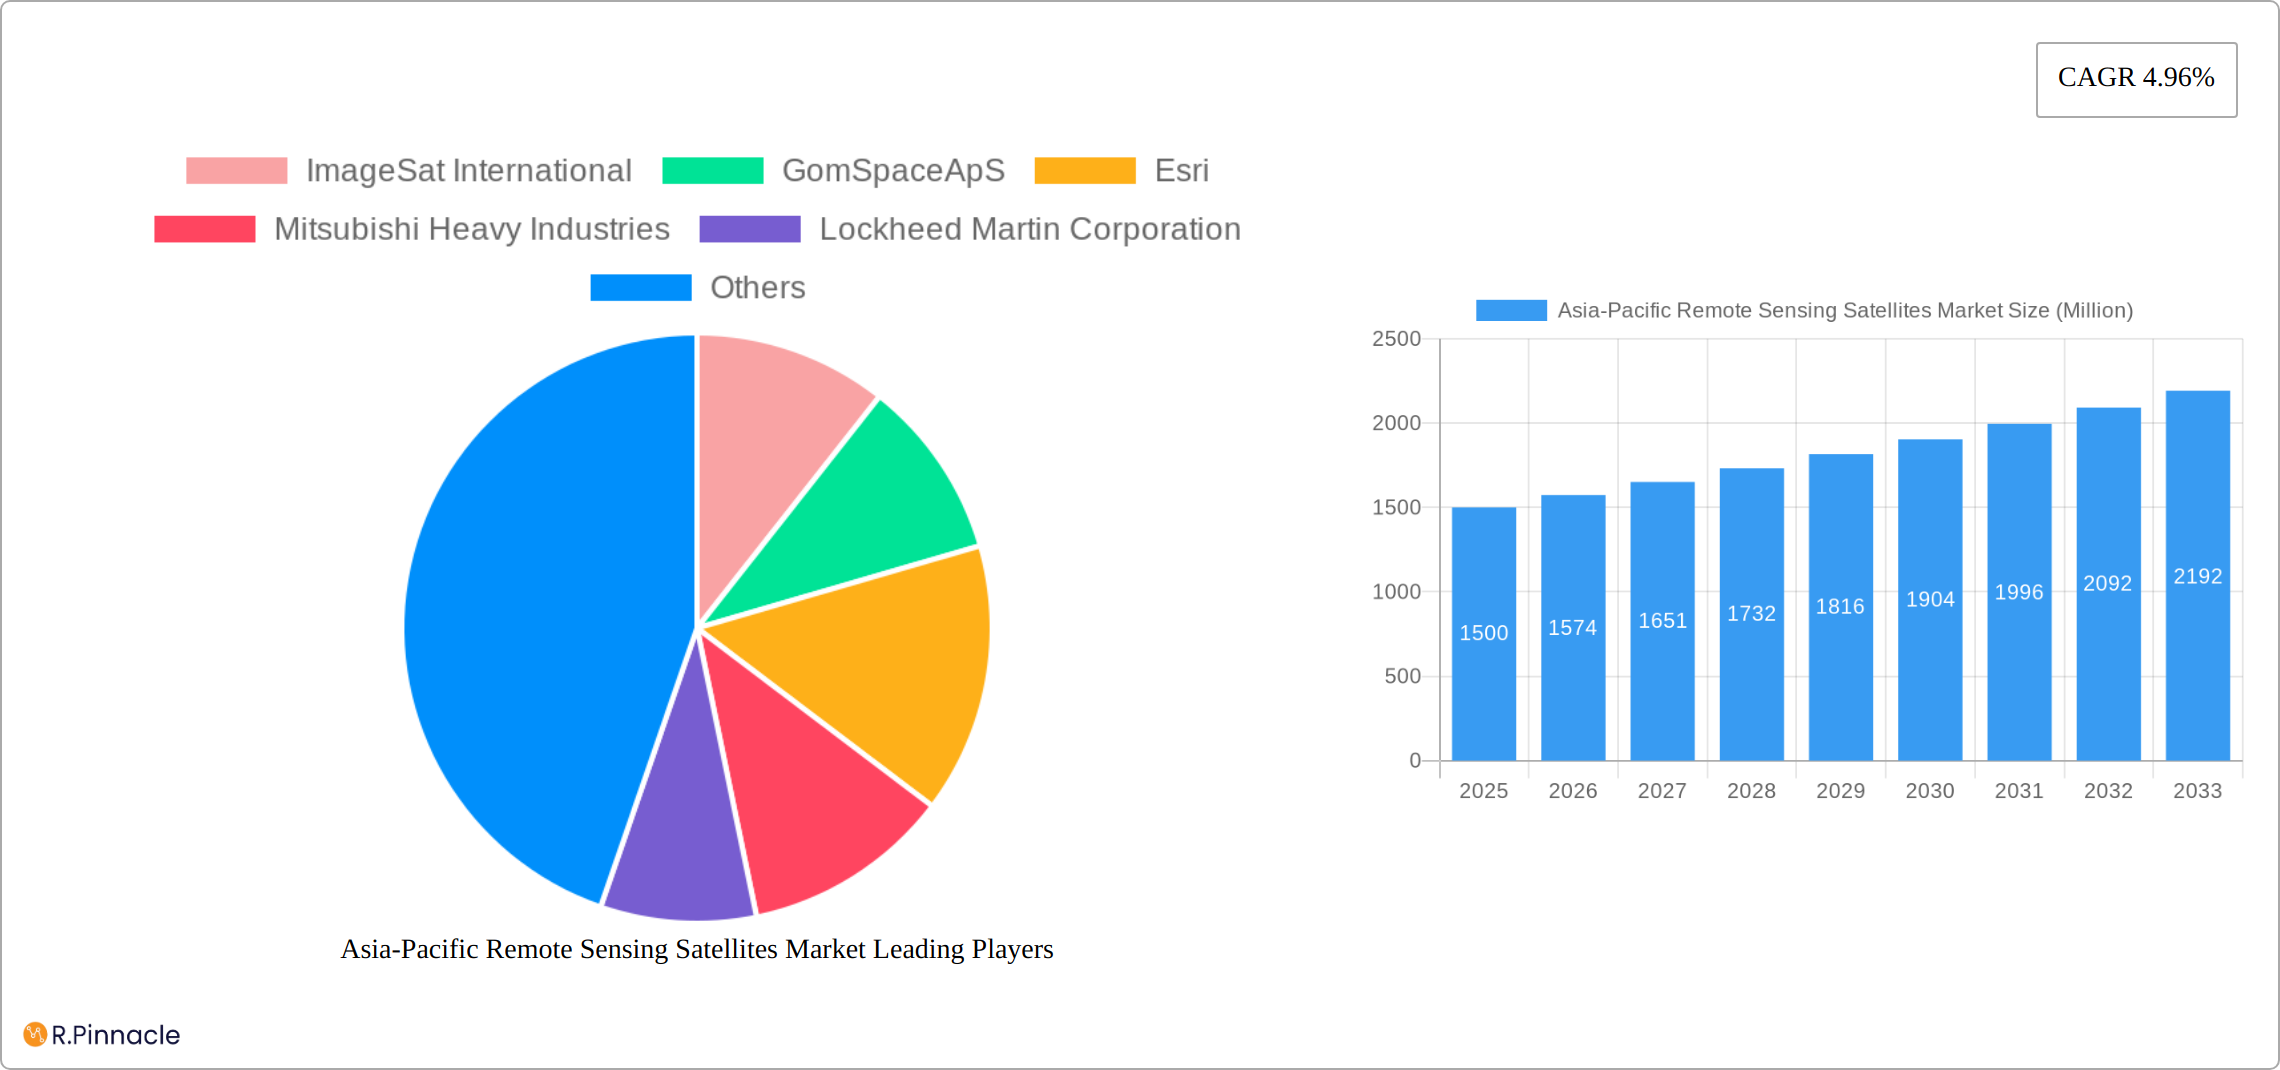
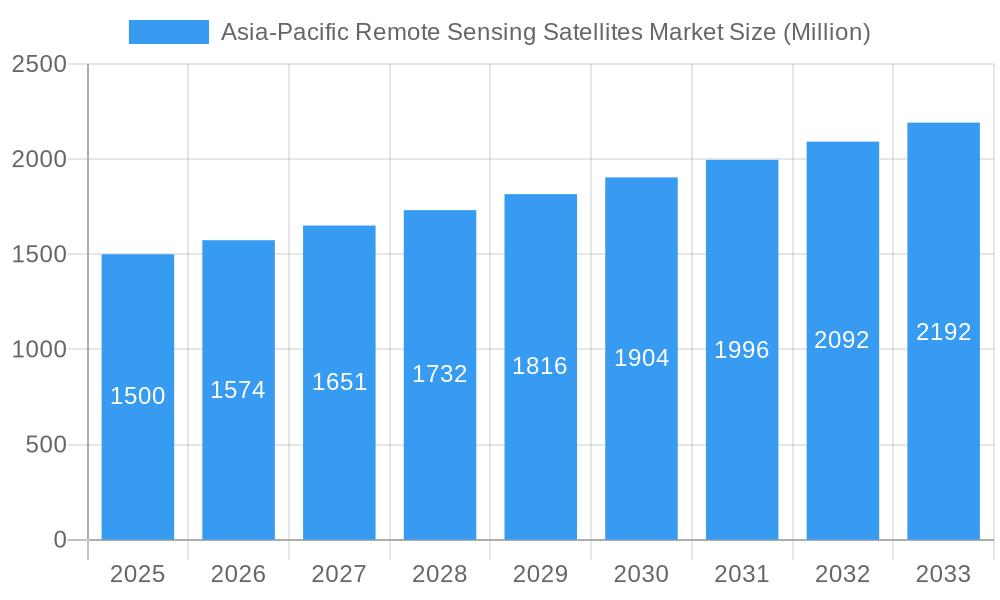
Asia-Pacific Remote Sensing Satellites Market Market Size (In Billion)
The market's growth is further bolstered by the increasing adoption of remote sensing technology in various applications. Precise agriculture, disaster management, and environmental monitoring initiatives are key drivers. While challenges remain, such as high initial investment costs and technological complexities, the long-term prospects for the Asia-Pacific remote sensing satellites market remain exceptionally promising. The increasing availability of cost-effective launch services and the emergence of new innovative technologies are anticipated to further accelerate market growth in the coming years. The continued development of advanced sensor technologies, providing enhanced image resolution and spectral capabilities, will cater to the rising demands of various industries, creating new opportunities within this dynamic market.
Asia-Pacific Remote Sensing Satellites Market Company Market Share
Asia-Pacific Remote Sensing Satellites Market Report: 2019-2033
This comprehensive report provides an in-depth analysis of the Asia-Pacific Remote Sensing Satellites Market, offering invaluable insights for industry professionals, investors, and strategic decision-makers. The study period covers 2019-2033, with a base year of 2025 and a forecast period of 2025-2033. The report meticulously segments the market by satellite mass, orbit class, satellite subsystem, and end-user, providing granular data for informed strategic planning. The market is projected to reach xx Million by 2033, exhibiting a CAGR of xx% during the forecast period.
Asia-Pacific Remote Sensing Satellites Market Structure & Innovation Trends
The Asia-Pacific Remote Sensing Satellites market exhibits a moderately concentrated structure, with key players like Airbus SE, Maxar Technologies Inc, and Mitsubishi Heavy Industries holding significant market share. However, the emergence of smaller, agile companies like Axelspace Corporation and Planet Labs Inc. is fostering increased competition and innovation. Market share is dynamic, with ongoing M&A activities influencing the competitive landscape. Deal values in recent years have ranged from xx Million to xx Million, reflecting significant investments in the sector.
- Market Concentration: Moderately concentrated, with top 5 players holding approximately xx% of market share (2024).
- Innovation Drivers: Growing demand for high-resolution imagery, advancements in miniaturization and cost reduction of satellites, and increasing government investment in space technology.
- Regulatory Frameworks: Varying regulations across different countries in the Asia-Pacific region influence market access and operations. Harmonization efforts are ongoing, but inconsistencies remain.
- Product Substitutes: Limited direct substitutes exist, but alternative data sources like aerial photography and drone imagery offer some level of competition.
- End-User Demographics: Significant growth is driven by increasing demand from commercial sectors (e.g., agriculture, mapping, environmental monitoring) and government/military applications (e.g., surveillance, defense).
- M&A Activities: Frequent mergers and acquisitions signal consolidation and strategic expansion within the market. Key drivers include acquiring specialized technologies, expanding geographical reach, and securing access to data and talent.
Asia-Pacific Remote Sensing Satellites Market Dynamics & Trends
The Asia-Pacific Remote Sensing Satellites market is experiencing robust growth, fueled by several key factors. Increased government funding for space exploration initiatives in countries like Japan, China, and India is driving significant investments in satellite technology and infrastructure. Technological advancements, such as the development of smaller, more affordable satellites and improved image processing capabilities, are lowering the barrier to entry for new players and expanding market accessibility. Furthermore, rising demand for precise geospatial data across various sectors, including agriculture, urban planning, and disaster management, is propelling market expansion. The market is also witnessing a growing preference for higher resolution imagery and faster data delivery, pushing innovation in sensor technology and data processing techniques. The competitive landscape is dynamic, characterized by both established players and new entrants vying for market share through technological advancements, strategic partnerships, and product differentiation. The market penetration of remote sensing technologies is increasing steadily across the region, driven by the growing adoption across various industry verticals.
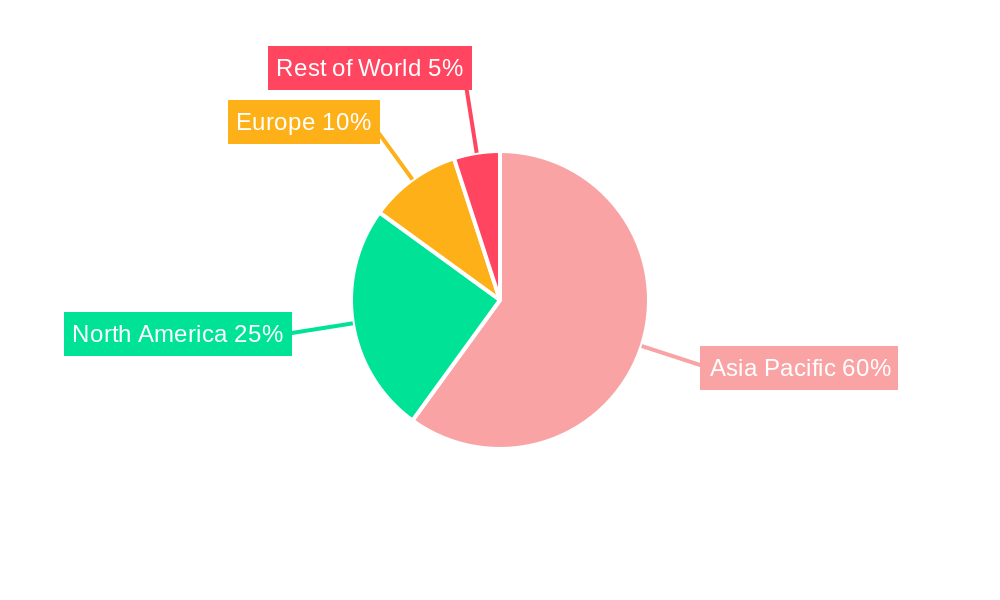
Dominant Regions & Segments in Asia-Pacific Remote Sensing Satellites Market
The Asia-Pacific Remote Sensing Satellites market is a dynamic landscape shaped by significant regional variations and specialized segments. China and Japan remain the leading nations, fueled by substantial government investment in space exploration and a well-established technological infrastructure. This robust foundation supports advanced satellite development and deployment capabilities. Within the market, the Low Earth Orbit (LEO) segment holds a dominant position in the Orbit Class category, owing to its cost-effectiveness and suitability for a wide range of applications. The increasing popularity of CubeSats and smaller, more agile satellites contributes to the 10-100kg segment's leading share within the Satellite Mass category. Furthermore, the Satellite Bus & Subsystems segment is paramount within Satellite Subsystems, reflecting its crucial role in overall satellite functionality and representing a significant portion of the total satellite cost. Finally, the Commercial sector is the leading end-user, highlighting the significant expansion driven by private sector applications across diverse industries.
Key Drivers for Dominant Regions:
- China: Massive government investment in space technology, a large and expanding domestic market, and rapid technological advancements fostering innovation and competitiveness.
- Japan: Exceptional technological prowess, a highly capable space agency (JAXA) with a long history of successful space missions, and a commitment to continuous innovation in satellite technology.
- India: A rapidly growing space program with increasing investment in space exploration, coupled with a surge in demand for satellite data across various sectors, driving market expansion.
- Australia: Growing investment in space infrastructure and capabilities, coupled with a strong focus on Earth observation and environmental monitoring applications.
- South Korea: Significant advancements in satellite technology and increasing demand for remote sensing data across various sectors, including defense and environmental monitoring.
Key Drivers for Dominant Segments:
- LEO Orbit: Cost-effective deployment, improved image resolution and data acquisition rates, and adaptability to diverse applications across multiple sectors.
- 10-100kg Satellite Mass: Reduced development and deployment costs, making advanced remote sensing technology more accessible to a broader range of commercial and research entities.
- Satellite Bus & Subsystems: These are fundamental to satellite functionality, representing a considerable portion of the overall satellite cost, and are subject to ongoing innovation for improved efficiency and performance.
- Commercial End-User: This sector is a major catalyst for market expansion, driving demand across various sectors including agriculture, urban planning, environmental monitoring, resource management, and disaster response.
Asia-Pacific Remote Sensing Satellites Market Product Innovations
Recent innovations focus on miniaturization, improved sensor technology (higher resolution, multispectral capabilities), and advanced data analytics. CubeSats and nanosatellites are gaining popularity due to their lower cost and faster deployment capabilities. This trend is being fueled by developments in miniaturized sensors and improved power systems. These advancements enable a broader range of applications, from high-resolution mapping to precise environmental monitoring, enhancing their market fit and creating competitive advantages for companies offering these innovative solutions.
Report Scope & Segmentation Analysis
This report comprehensively segments the Asia-Pacific Remote Sensing Satellites Market by:
- Satellite Mass: Below 10 Kg, 10-100kg, 100-500kg, 500-1000kg, above 1000kg (Each segment includes growth projections, market size, and competitive dynamics).
- Orbit Class: LEO, MEO, GEO (Each segment includes growth projections, market size, and competitive dynamics).
- Satellite Subsystem: Propulsion Hardware and Propellant, Satellite Bus & Subsystems, Solar Array & Power Hardware, Structures, Harness & Mechanisms (Each segment includes growth projections, market size, and competitive dynamics).
- End User: Commercial, Military & Government, Other (Each segment includes growth projections, market size, and competitive dynamics).
Key Drivers of Asia-Pacific Remote Sensing Satellites Market Growth
Several factors fuel market growth, including: increased government spending on space programs across the region, the rising demand for high-resolution imagery in various sectors (agriculture, urban planning, disaster management), advancements in satellite technology leading to smaller, more affordable satellites, and the growing adoption of cloud-based data processing and analytics. Government initiatives promoting space technology development and private sector investments further accelerate market expansion.
Challenges in the Asia-Pacific Remote Sensing Satellites Market Sector
Challenges include high initial investment costs for satellite development and launch, complex regulatory frameworks across different countries, potential supply chain disruptions impacting component availability, and intense competition among both established players and new entrants. Furthermore, data security and privacy concerns and the need for skilled professionals in the industry pose additional hurdles.
Emerging Opportunities in Asia-Pacific Remote Sensing Satellites Market
Emerging opportunities include the increasing demand for Internet of Things (IoT) applications utilizing satellite data, the growth of the NewSpace industry, the development of advanced sensor technologies for improved data collection, and the expansion of satellite-based services for environmental monitoring and climate change research. Focus on developing cost-effective solutions for various sectors will open new markets and drive further growth.
Leading Players in the Asia-Pacific Remote Sensing Satellites Market Market
- ImageSat International
- GomSpace ApS
- Esri
- Mitsubishi Heavy Industries
- Lockheed Martin Corporation
- Korea Aerospace Research Institute (KARI)
- Airbus SE
- Axelspace Corporation
- Japan Aerospace Exploration Agency (JAXA)
- China Aerospace Science and Technology Corporation (CASC)
- Maxar Technologies Inc
- Chang Guang Satellite Technology Co Ltd
- IHI Corp
- Thale
- Planet Labs Inc
- Northrop Grumman Corporation
- Indian Space Research Organisation (ISRO)
- Spire Global Inc
Key Developments in Asia-Pacific Remote Sensing Satellites Market Industry
- January 2023: Axelspace partnered with NorthStar Earth & Space Inc. to provide satellite imaging data for space situational awareness.
- February 2023: NASA and Esri expanded access to NASA's geospatial content for research.
- March 2023: JAXA scheduled the launch of the H3 Launch Vehicle with ALOS-3.
Future Outlook for Asia-Pacific Remote Sensing Satellites Market Market
The Asia-Pacific Remote Sensing Satellites market is poised for continued strong growth, driven by technological advancements, increasing demand across various sectors, and supportive government policies. Strategic partnerships, investments in innovative technologies, and a focus on delivering cost-effective solutions will be crucial for success in this dynamic market. The market's future potential is significant, with opportunities for both established players and new entrants to capitalize on the expanding demand for satellite-based data and services.
Asia-Pacific Remote Sensing Satellites Market Segmentation
-
1. Satellite Mass
- 1.1. 10-100kg
- 1.2. 100-500kg
- 1.3. 500-1000kg
- 1.4. Below 10 Kg
- 1.5. above 1000kg
-
2. Orbit Class
- 2.1. GEO
- 2.2. LEO
- 2.3. MEO
-
3. Satellite Subsystem
- 3.1. Propulsion Hardware and Propellant
- 3.2. Satellite Bus & Subsystems
- 3.3. Solar Array & Power Hardware
- 3.4. Structures, Harness & Mechanisms
-
4. End User
- 4.1. Commercial
- 4.2. Military & Government
- 4.3. Other
Asia-Pacific Remote Sensing Satellites Market Segmentation By Geography
-
1. Asia Pacific
- 1.1. China
- 1.2. Japan
- 1.3. South Korea
- 1.4. India
- 1.5. Australia
- 1.6. New Zealand
- 1.7. Indonesia
- 1.8. Malaysia
- 1.9. Singapore
- 1.10. Thailand
- 1.11. Vietnam
- 1.12. Philippines
Asia-Pacific Remote Sensing Satellites Market Regional Market Share
Geographic Coverage of Asia-Pacific Remote Sensing Satellites Market
Asia-Pacific Remote Sensing Satellites Market REPORT HIGHLIGHTS
| Aspects | Details |
|---|---|
| Study Period | 2020-2034 |
| Base Year | 2025 |
| Estimated Year | 2026 |
| Forecast Period | 2026-2034 |
| Historical Period | 2020-2025 |
| Growth Rate | CAGR of 12.7% from 2020-2034 |
| Segmentation |
|
Table of Contents
- 1. Introduction
- 1.1. Research Scope
- 1.2. Market Segmentation
- 1.3. Research Objective
- 1.4. Definitions and Assumptions
- 2. Executive Summary
- 2.1. Market Snapshot
- 3. Market Dynamics
- 3.1. Market Drivers
- 3.2. Market Restrains
- 3.3. Market Trends
- 3.4. Market Opportunities
- 4. Market Factor Analysis
- 4.1. Porters Five Forces
- 4.1.1. Bargaining Power of Suppliers
- 4.1.2. Bargaining Power of Buyers
- 4.1.3. Threat of New Entrants
- 4.1.4. Threat of Substitutes
- 4.1.5. Competitive Rivalry
- 4.2. PESTEL analysis
- 4.3. BCG Analysis
- 4.3.1. Stars (High Growth, High Market Share)
- 4.3.2. Cash Cows (Low Growth, High Market Share)
- 4.3.3. Question Mark (High Growth, Low Market Share)
- 4.3.4. Dogs (Low Growth, Low Market Share)
- 4.4. Ansoff Matrix Analysis
- 4.5. Supply Chain Analysis
- 4.6. Regulatory Landscape
- 4.7. Current Market Potential and Opportunity Assessment (TAM–SAM–SOM Framework)
- 4.8. PRI Analyst Note
- 4.1. Porters Five Forces
- 5. Market Analysis, Insights and Forecast 2021-2033
- 5.1. Market Analysis, Insights and Forecast - by Satellite Mass
- 5.1.1. 10-100kg
- 5.1.2. 100-500kg
- 5.1.3. 500-1000kg
- 5.1.4. Below 10 Kg
- 5.1.5. above 1000kg
- 5.2. Market Analysis, Insights and Forecast - by Orbit Class
- 5.2.1. GEO
- 5.2.2. LEO
- 5.2.3. MEO
- 5.3. Market Analysis, Insights and Forecast - by Satellite Subsystem
- 5.3.1. Propulsion Hardware and Propellant
- 5.3.2. Satellite Bus & Subsystems
- 5.3.3. Solar Array & Power Hardware
- 5.3.4. Structures, Harness & Mechanisms
- 5.4. Market Analysis, Insights and Forecast - by End User
- 5.4.1. Commercial
- 5.4.2. Military & Government
- 5.4.3. Other
- 5.5. Market Analysis, Insights and Forecast - by Region
- 5.5.1. Asia Pacific
- 5.1. Market Analysis, Insights and Forecast - by Satellite Mass
- 6. Asia-Pacific Remote Sensing Satellites Market Analysis, Insights and Forecast, 2021-2033
- 6.1. Market Analysis, Insights and Forecast - by Satellite Mass
- 6.1.1. 10-100kg
- 6.1.2. 100-500kg
- 6.1.3. 500-1000kg
- 6.1.4. Below 10 Kg
- 6.1.5. above 1000kg
- 6.2. Market Analysis, Insights and Forecast - by Orbit Class
- 6.2.1. GEO
- 6.2.2. LEO
- 6.2.3. MEO
- 6.3. Market Analysis, Insights and Forecast - by Satellite Subsystem
- 6.3.1. Propulsion Hardware and Propellant
- 6.3.2. Satellite Bus & Subsystems
- 6.3.3. Solar Array & Power Hardware
- 6.3.4. Structures, Harness & Mechanisms
- 6.4. Market Analysis, Insights and Forecast - by End User
- 6.4.1. Commercial
- 6.4.2. Military & Government
- 6.4.3. Other
- 6.1. Market Analysis, Insights and Forecast - by Satellite Mass
- 7. Competitive Analysis
- 7.1. Company Profiles
- 7.1.1 ImageSat International
- 7.1.1.1. Company Overview
- 7.1.1.2. Products
- 7.1.1.3. Company Financials
- 7.1.1.4. SWOT Analysis
- 7.1.2 GomSpaceApS
- 7.1.2.1. Company Overview
- 7.1.2.2. Products
- 7.1.2.3. Company Financials
- 7.1.2.4. SWOT Analysis
- 7.1.3 Esri
- 7.1.3.1. Company Overview
- 7.1.3.2. Products
- 7.1.3.3. Company Financials
- 7.1.3.4. SWOT Analysis
- 7.1.4 Mitsubishi Heavy Industries
- 7.1.4.1. Company Overview
- 7.1.4.2. Products
- 7.1.4.3. Company Financials
- 7.1.4.4. SWOT Analysis
- 7.1.5 Lockheed Martin Corporation
- 7.1.5.1. Company Overview
- 7.1.5.2. Products
- 7.1.5.3. Company Financials
- 7.1.5.4. SWOT Analysis
- 7.1.6 Korea Aerospace Research Institute (KARI)
- 7.1.6.1. Company Overview
- 7.1.6.2. Products
- 7.1.6.3. Company Financials
- 7.1.6.4. SWOT Analysis
- 7.1.7 Airbus SE
- 7.1.7.1. Company Overview
- 7.1.7.2. Products
- 7.1.7.3. Company Financials
- 7.1.7.4. SWOT Analysis
- 7.1.8 Axelspace Corporation
- 7.1.8.1. Company Overview
- 7.1.8.2. Products
- 7.1.8.3. Company Financials
- 7.1.8.4. SWOT Analysis
- 7.1.9 Japan Aerospace Exploration Agency (JAXA)
- 7.1.9.1. Company Overview
- 7.1.9.2. Products
- 7.1.9.3. Company Financials
- 7.1.9.4. SWOT Analysis
- 7.1.10 China Aerospace Science and Technology Corporation (CASC)
- 7.1.10.1. Company Overview
- 7.1.10.2. Products
- 7.1.10.3. Company Financials
- 7.1.10.4. SWOT Analysis
- 7.1.11 Maxar Technologies Inc
- 7.1.11.1. Company Overview
- 7.1.11.2. Products
- 7.1.11.3. Company Financials
- 7.1.11.4. SWOT Analysis
- 7.1.12 Chang Guang Satellite Technology Co Ltd
- 7.1.12.1. Company Overview
- 7.1.12.2. Products
- 7.1.12.3. Company Financials
- 7.1.12.4. SWOT Analysis
- 7.1.13 IHI Corp
- 7.1.13.1. Company Overview
- 7.1.13.2. Products
- 7.1.13.3. Company Financials
- 7.1.13.4. SWOT Analysis
- 7.1.14 Thale
- 7.1.14.1. Company Overview
- 7.1.14.2. Products
- 7.1.14.3. Company Financials
- 7.1.14.4. SWOT Analysis
- 7.1.15 Planet Labs Inc
- 7.1.15.1. Company Overview
- 7.1.15.2. Products
- 7.1.15.3. Company Financials
- 7.1.15.4. SWOT Analysis
- 7.1.16 Northrop Grumman Corporation
- 7.1.16.1. Company Overview
- 7.1.16.2. Products
- 7.1.16.3. Company Financials
- 7.1.16.4. SWOT Analysis
- 7.1.17 Indian Space Research Organisation (ISRO)
- 7.1.17.1. Company Overview
- 7.1.17.2. Products
- 7.1.17.3. Company Financials
- 7.1.17.4. SWOT Analysis
- 7.1.18 Spire Global Inc
- 7.1.18.1. Company Overview
- 7.1.18.2. Products
- 7.1.18.3. Company Financials
- 7.1.18.4. SWOT Analysis
- 7.1.1 ImageSat International
- 7.2. Market Entropy
- 7.2.1 Company's Key Areas Served
- 7.2.2 Recent Developments
- 7.3. Company Market Share Analysis 2025
- 7.3.1 Top 5 Companies Market Share Analysis
- 7.3.2 Top 3 Companies Market Share Analysis
- 7.4. List of Potential Customers
- 8. Research Methodology
List of Figures
- Figure 1: Asia-Pacific Remote Sensing Satellites Market Revenue Breakdown (million, %) by Product 2025 & 2033
- Figure 2: Asia-Pacific Remote Sensing Satellites Market Share (%) by Company 2025
List of Tables
- Table 1: Asia-Pacific Remote Sensing Satellites Market Revenue million Forecast, by Satellite Mass 2020 & 2033
- Table 2: Asia-Pacific Remote Sensing Satellites Market Revenue million Forecast, by Orbit Class 2020 & 2033
- Table 3: Asia-Pacific Remote Sensing Satellites Market Revenue million Forecast, by Satellite Subsystem 2020 & 2033
- Table 4: Asia-Pacific Remote Sensing Satellites Market Revenue million Forecast, by End User 2020 & 2033
- Table 5: Asia-Pacific Remote Sensing Satellites Market Revenue million Forecast, by Region 2020 & 2033
- Table 6: Asia-Pacific Remote Sensing Satellites Market Revenue million Forecast, by Satellite Mass 2020 & 2033
- Table 7: Asia-Pacific Remote Sensing Satellites Market Revenue million Forecast, by Orbit Class 2020 & 2033
- Table 8: Asia-Pacific Remote Sensing Satellites Market Revenue million Forecast, by Satellite Subsystem 2020 & 2033
- Table 9: Asia-Pacific Remote Sensing Satellites Market Revenue million Forecast, by End User 2020 & 2033
- Table 10: Asia-Pacific Remote Sensing Satellites Market Revenue million Forecast, by Country 2020 & 2033
- Table 11: China Asia-Pacific Remote Sensing Satellites Market Revenue (million) Forecast, by Application 2020 & 2033
- Table 12: Japan Asia-Pacific Remote Sensing Satellites Market Revenue (million) Forecast, by Application 2020 & 2033
- Table 13: South Korea Asia-Pacific Remote Sensing Satellites Market Revenue (million) Forecast, by Application 2020 & 2033
- Table 14: India Asia-Pacific Remote Sensing Satellites Market Revenue (million) Forecast, by Application 2020 & 2033
- Table 15: Australia Asia-Pacific Remote Sensing Satellites Market Revenue (million) Forecast, by Application 2020 & 2033
- Table 16: New Zealand Asia-Pacific Remote Sensing Satellites Market Revenue (million) Forecast, by Application 2020 & 2033
- Table 17: Indonesia Asia-Pacific Remote Sensing Satellites Market Revenue (million) Forecast, by Application 2020 & 2033
- Table 18: Malaysia Asia-Pacific Remote Sensing Satellites Market Revenue (million) Forecast, by Application 2020 & 2033
- Table 19: Singapore Asia-Pacific Remote Sensing Satellites Market Revenue (million) Forecast, by Application 2020 & 2033
- Table 20: Thailand Asia-Pacific Remote Sensing Satellites Market Revenue (million) Forecast, by Application 2020 & 2033
- Table 21: Vietnam Asia-Pacific Remote Sensing Satellites Market Revenue (million) Forecast, by Application 2020 & 2033
- Table 22: Philippines Asia-Pacific Remote Sensing Satellites Market Revenue (million) Forecast, by Application 2020 & 2033
Frequently Asked Questions
1. What is the projected Compound Annual Growth Rate (CAGR) of the Asia-Pacific Remote Sensing Satellites Market?
The projected CAGR is approximately 12.7%.
2. Which companies are prominent players in the Asia-Pacific Remote Sensing Satellites Market?
Key companies in the market include ImageSat International, GomSpaceApS, Esri, Mitsubishi Heavy Industries, Lockheed Martin Corporation, Korea Aerospace Research Institute (KARI), Airbus SE, Axelspace Corporation, Japan Aerospace Exploration Agency (JAXA), China Aerospace Science and Technology Corporation (CASC), Maxar Technologies Inc, Chang Guang Satellite Technology Co Ltd, IHI Corp, Thale, Planet Labs Inc, Northrop Grumman Corporation, Indian Space Research Organisation (ISRO), Spire Global Inc.
3. What are the main segments of the Asia-Pacific Remote Sensing Satellites Market?
The market segments include Satellite Mass, Orbit Class, Satellite Subsystem, End User.
4. Can you provide details about the market size?
The market size is estimated to be USD 6654.7 million as of 2022.
5. What are some drivers contributing to market growth?
N/A
6. What are the notable trends driving market growth?
OTHER KEY INDUSTRY TRENDS COVERED IN THE REPORT.
7. Are there any restraints impacting market growth?
N/A
8. Can you provide examples of recent developments in the market?
March 2023: The Japan Aerospace Exploration Agency (JAXA) had scheduled the launch of the first H3 Launch Vehicle with the Advanced Land Observing Satellite "Daichi 3" (ALOS-3) onboard from the Tanegashima Space Center.February 2023: NASA and geographic information service provider Esri will grant wider access to the space agency's geospatial content for research and exploration purposes through the Space Act Agreement.January 2023: Axelspace announced an agreement with NorthStar Earth & Space Inc. Through this partnership, Axelspace will utilize five AxelGlobe Earth observation satellites, GRUS, to provide complementary satellite imaging data for NorthStar's space situational awareness (SSA) efforts.
9. What pricing options are available for accessing the report?
Pricing options include single-user, multi-user, and enterprise licenses priced at USD 3800, USD 4500, and USD 5800 respectively.
10. Is the market size provided in terms of value or volume?
The market size is provided in terms of value, measured in million.
11. Are there any specific market keywords associated with the report?
Yes, the market keyword associated with the report is "Asia-Pacific Remote Sensing Satellites Market," which aids in identifying and referencing the specific market segment covered.
12. How do I determine which pricing option suits my needs best?
The pricing options vary based on user requirements and access needs. Individual users may opt for single-user licenses, while businesses requiring broader access may choose multi-user or enterprise licenses for cost-effective access to the report.
13. Are there any additional resources or data provided in the Asia-Pacific Remote Sensing Satellites Market report?
While the report offers comprehensive insights, it's advisable to review the specific contents or supplementary materials provided to ascertain if additional resources or data are available.
14. How can I stay updated on further developments or reports in the Asia-Pacific Remote Sensing Satellites Market?
To stay informed about further developments, trends, and reports in the Asia-Pacific Remote Sensing Satellites Market, consider subscribing to industry newsletters, following relevant companies and organizations, or regularly checking reputable industry news sources and publications.
Methodology
Step 1 - Identification of Relevant Samples Size from Population Database


Step 2 - Approaches for Defining Global Market Size (Value, Volume* & Price*)

Note*: In applicable scenarios
Step 3 - Data Sources
Primary Research
- Web Analytics
- Survey Reports
- Research Institute
- Latest Research Reports
- Opinion Leaders
Secondary Research
- Annual Reports
- White Paper
- Latest Press Release
- Industry Association
- Paid Database
- Investor Presentations

Step 4 - Data Triangulation
Involves using different sources of information in order to increase the validity of a study
These sources are likely to be stakeholders in a program - participants, other researchers, program staff, other community members, and so on.
Then we put all data in single framework & apply various statistical tools to find out the dynamic on the market.
During the analysis stage, feedback from the stakeholder groups would be compared to determine areas of agreement as well as areas of divergence