

Key Insights
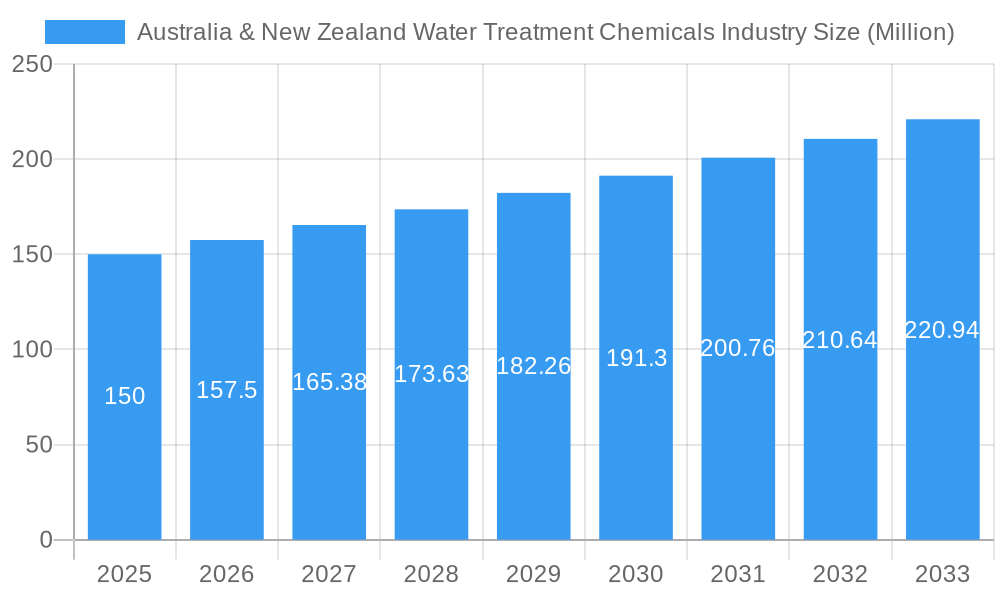
The Australia & New Zealand water treatment chemicals market, valued at $1.1 billion in 2024, is projected to grow at a CAGR of 5.6% through 2033. This robust expansion is driven by increasing urbanization, industrialization, and escalating demand for effective water management solutions. Stringent environmental regulations mandating high water discharge quality are compelling industries to adopt advanced, eco-friendly chemical treatments. Furthermore, a growing emphasis on water reuse and recycling initiatives significantly bolsters market demand. Innovations in chemical formulations, enhancing efficiency and minimizing environmental impact, are also key growth contributors. The market is segmented by product type, including biocides, coagulants, and corrosion inhibitors, and by end-user industry, such as power generation, mining, and food & beverage. The power generation and mining sectors are anticipated to exhibit particularly strong growth due to their substantial water consumption and the critical need for effective water treatment to ensure operational continuity and environmental compliance.
Australia & New Zealand Water Treatment Chemicals Industry Market Size (In Billion)
The future outlook for the Australia & New Zealand water treatment chemicals market is highly positive, with sustained growth anticipated. Potential challenges include raw material price volatility and the possibility of more stringent environmental regulations, which may affect profitability. Intense competition from established global players like Kemira Oyj and Ecolab, as well as emerging regional suppliers such as IWTS Group Pty Ltd and Aquasol, could exert price pressures. Nevertheless, the long-term trajectory remains favorable, underpinned by the persistent need for efficient and sustainable water treatment solutions in a resource-scarce global landscape. The market is expected to witness considerable innovation, with a pronounced focus on the development and adoption of sustainable and environmentally responsible chemical alternatives, further propelling market expansion throughout the forecast period.
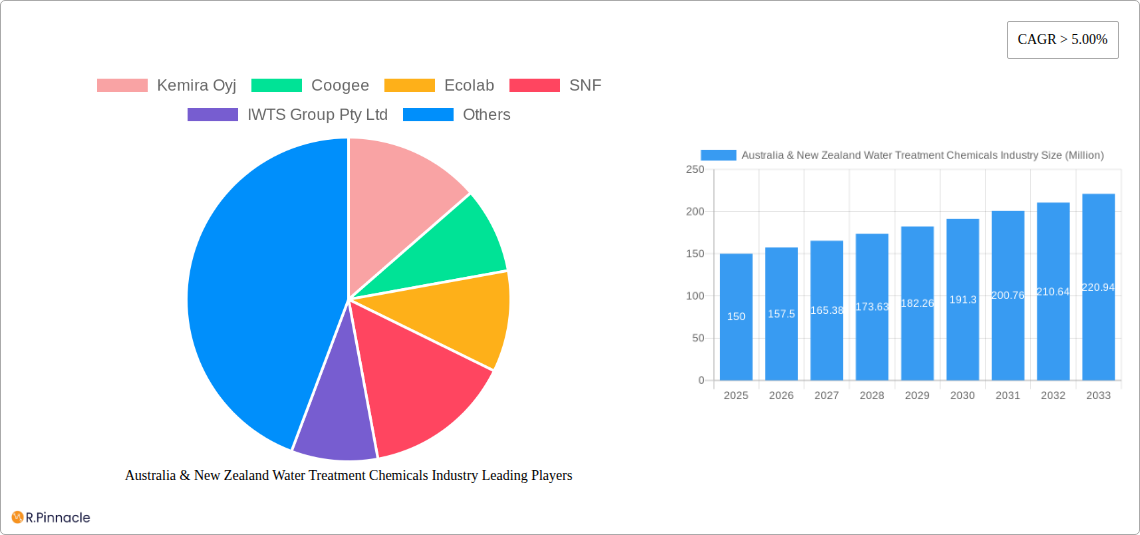
Australia & New Zealand Water Treatment Chemicals Industry Company Market Share
Australia & New Zealand Water Treatment Chemicals Industry: A Comprehensive Market Report (2019-2033)
This in-depth report provides a comprehensive analysis of the Australia & New Zealand water treatment chemicals industry, offering valuable insights for industry professionals, investors, and strategic planners. The study period covers 2019-2033, with 2025 as the base and estimated year. We project robust growth driven by several key factors explored within this report. The report's detailed segmentation, market sizing, and competitive landscape analysis will equip you with the knowledge to make informed decisions in this dynamic market.
Australia & New Zealand Water Treatment Chemicals Industry Market Structure & Innovation Trends
The Australian and New Zealand water treatment chemicals market is moderately concentrated, with key players like Kemira Oyj, Ecolab, and SNF holding significant market share. However, the presence of several regional and specialized players fosters competition. The market structure is influenced by factors such as stringent environmental regulations, increasing demand for sustainable solutions, and a growing focus on water conservation. Innovation is driven primarily by the need for more efficient, cost-effective, and environmentally friendly treatment solutions. This leads to advancements in areas like biocides with reduced environmental impact and intelligent water treatment systems.
Key Market Characteristics:
- Market Concentration: Moderately concentrated, with top 5 players holding approximately xx% market share (2025).
- Innovation Drivers: Stringent environmental regulations, demand for sustainable products, and advancements in water treatment technologies.
- Regulatory Framework: Compliance with Australian and New Zealand water quality standards is paramount, shaping product development and market dynamics.
- M&A Activity: The period 2019-2024 saw xx M&A deals valued at approximately $xx Million, indicating consolidation within the industry. Further activity is expected in the forecast period, driven by market expansion and strategic acquisitions.
- Product Substitutes: Competition exists from alternative treatment methods, including membrane filtration, impacting the growth of certain chemical segments.
Australia & New Zealand Water Treatment Chemicals Industry Market Dynamics & Trends
The Australia & New Zealand water treatment chemicals market is projected to experience a CAGR of xx% during 2025-2033. This growth is fueled by several key factors, including increasing industrialization, expanding urbanization, rising concerns regarding water scarcity, and stricter environmental regulations. Technological advancements, such as the development of advanced oxidation processes (AOPs) and the adoption of smart water management systems, are further accelerating market expansion. The market is witnessing a shift towards eco-friendly and sustainable solutions, influenced by changing consumer preferences and growing environmental consciousness. Competitive dynamics are characterized by both price competition and product differentiation, with companies focusing on developing innovative and high-performance products to maintain their market share. Market penetration of advanced treatment technologies, like membrane filtration, is gradually increasing, posing both opportunities and challenges for the chemical segment.
Dominant Regions & Segments in Australia & New Zealand Water Treatment Chemicals Industry
The market is geographically diverse, with significant demand across both Australia and New Zealand. However, certain regions within each country, based on industrial concentration and population density, show higher consumption rates.
Dominant Segments (2025):
- Product Type: Coagulants and Flocculants dominate, driven by their widespread application in various water treatment processes. The Biocides and Disinfectants segment is also experiencing significant growth due to increasing concerns about waterborne pathogens.
- End-user Industry: Municipal water treatment remains the largest segment, accounting for approximately xx% of the market. However, robust growth is expected in the industrial sector, particularly mining and mineral processing, driven by increased water demand and stricter environmental guidelines.
Key Drivers by Segment:
- Municipal: Government initiatives promoting water conservation and infrastructure upgrades fuel market expansion.
- Mining & Mineral Processing: The rise of mining activities, particularly in Australia, fuels the demand for efficient water treatment solutions.
- Power Generation: Stringent regulations governing wastewater discharge drive the adoption of advanced treatment technologies.
Australia & New Zealand Water Treatment Chemicals Industry Product Innovations
Recent innovations focus on developing more environmentally friendly chemicals, reducing energy consumption in treatment processes, and improving treatment efficiency. This includes the introduction of bio-based coagulants, advanced oxidation processes (AOPs) for enhanced disinfection, and intelligent dosing systems to optimize chemical usage. The market is witnessing a shift towards customized solutions tailored to specific water characteristics and end-user requirements, reflecting a growing emphasis on efficiency and sustainability.
Report Scope & Segmentation Analysis
This report segments the Australia & New Zealand water treatment chemicals market based on product type and end-user industry. Growth projections, market sizes, and competitive dynamics are analyzed for each segment. Market sizes are presented in Millions of dollars.
- Product Type: Biocides and Disinfectants (Market Size 2025: $xx Million, CAGR: xx%), Coagulants and Flocculants ($xx Million, CAGR: xx%), Corrosion and Scale Inhibitors ($xx Million, CAGR: xx%), Defoamers and Defoaming Agents ($xx Million, CAGR: xx%), pH Conditioners/Adjusters ($xx Million, CAGR: xx%), Other Product Types ($xx Million, CAGR: xx%).
- End-user Industry: Power Generation ($xx Million, CAGR: xx%), Oil and Gas ($xx Million, CAGR: xx%), Chemical Manufacturing ($xx Million, CAGR: xx%), Mining and Mineral Processing ($xx Million, CAGR: xx%), Municipal ($xx Million, CAGR: xx%), Food and Beverage ($xx Million, CAGR: xx%), Pulp and Paper ($xx Million, CAGR: xx%), Other End-user Industries ($xx Million, CAGR: xx%).
Key Drivers of Australia & New Zealand Water Treatment Chemicals Industry Growth
The growth of the Australian and New Zealand water treatment chemicals market is primarily driven by stringent environmental regulations promoting water conservation and improved water quality. Increasing urbanization and industrialization lead to greater water demand and wastewater generation, creating significant market opportunities. Furthermore, government initiatives investing in water infrastructure projects and advancements in water treatment technologies contribute significantly to market expansion.
Challenges in the Australia & New Zealand Water Treatment Chemicals Industry Sector
The industry faces challenges such as fluctuating raw material prices, stringent regulatory compliance requirements, and the potential for stricter environmental regulations impacting chemical usage. Supply chain disruptions can also influence market stability, while intense competition among established players and new entrants creates price pressure.
Emerging Opportunities in Australia & New Zealand Water Treatment Chemicals Industry
The industry sees opportunities in developing and deploying advanced treatment technologies, such as AOPs and membrane filtration systems. Growing demand for sustainable and eco-friendly solutions presents significant opportunities for companies offering bio-based and less harmful chemicals. The expanding industrial and municipal sectors, coupled with government initiatives promoting water conservation, create ample growth prospects.
Leading Players in the Australia & New Zealand Water Treatment Chemicals Industry Market
- Kemira Oyj
- Coogee
- Ecolab
- SNF
- IWTS Group Pty Ltd
- Solvay
- Buckman
- Aquasol
- Dow
- Solenis
- Ixom
- Albemarle Corporation
- Veolia (Veolia Water Technologies)
Key Developments in Australia & New Zealand Water Treatment Chemicals Industry
- 2022: Ecolab launched a new range of sustainable biocides for municipal water treatment.
- 2023: Kemira Oyj announced a strategic partnership with a local distributor to expand its reach in the Australian market.
- 2024: A major merger between two regional water treatment chemical companies occurred, consolidating market share. (Further details would be included in the full report)
Future Outlook for Australia & New Zealand Water Treatment Chemicals Industry Market
The Australia & New Zealand water treatment chemicals market is poised for continued growth, driven by increasing demand from various sectors and technological advancements. The focus on sustainable and environmentally friendly solutions will shape future product development and market dynamics. Companies investing in research and development, adopting innovative business strategies, and offering customized solutions are well-positioned to capitalize on the market's growth potential.
Australia & New Zealand Water Treatment Chemicals Industry Segmentation
-
1. Product Type
- 1.1. Biocides and Disinfectants
- 1.2. Coagulants and Flocculants
- 1.3. Corrosion and Scale Inhibitors
- 1.4. Defoamers and Defoaming Agents
- 1.5. pH Conditioners/Adjusters
- 1.6. Other Product Types
-
2. End-user Industry
- 2.1. Power Generation
- 2.2. Oil and Gas
- 2.3. Chemical Manufacturing
- 2.4. Mining and Mineral Processing
- 2.5. Municipal
- 2.6. Food and Beverage
- 2.7. Pulp and Paper
- 2.8. Other End-user Industries
Australia & New Zealand Water Treatment Chemicals Industry Segmentation By Geography
- 1. Australia
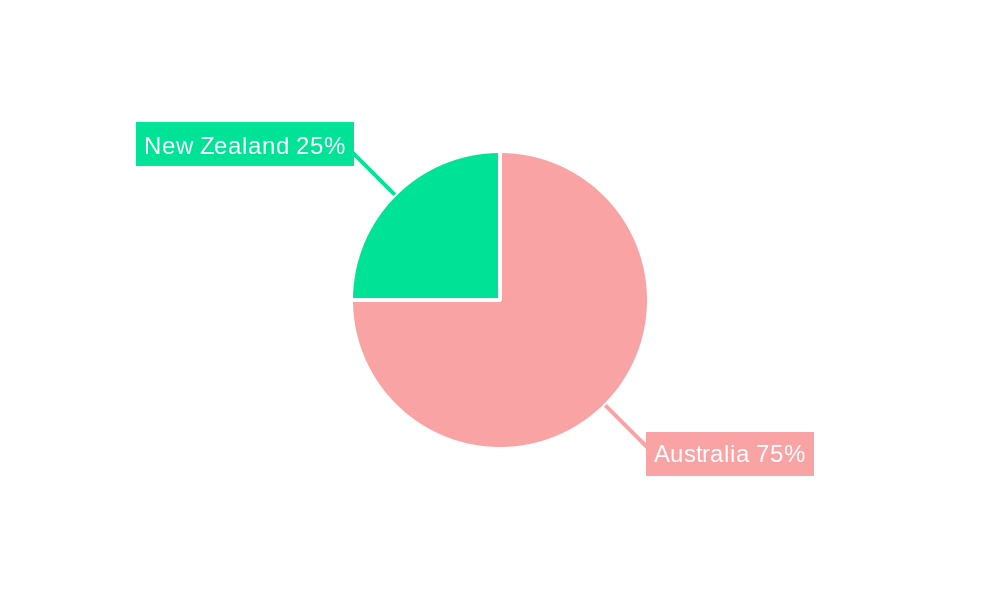
Australia & New Zealand Water Treatment Chemicals Industry Regional Market Share
Geographic Coverage of Australia & New Zealand Water Treatment Chemicals Industry
Australia & New Zealand Water Treatment Chemicals Industry REPORT HIGHLIGHTS
| Aspects | Details |
|---|---|
| Study Period | 2020-2034 |
| Base Year | 2025 |
| Estimated Year | 2026 |
| Forecast Period | 2026-2034 |
| Historical Period | 2020-2025 |
| Growth Rate | CAGR of 5.6% from 2020-2034 |
| Segmentation |
|
Table of Contents
- 1. Introduction
- 1.1. Research Scope
- 1.2. Market Segmentation
- 1.3. Research Objective
- 1.4. Definitions and Assumptions
- 2. Executive Summary
- 2.1. Market Snapshot
- 3. Market Dynamics
- 3.1. Market Drivers
- 3.2. Market Restrains
- 3.3. Market Trends
- 3.4. Market Opportunities
- 4. Market Factor Analysis
- 4.1. Porters Five Forces
- 4.1.1. Bargaining Power of Suppliers
- 4.1.2. Bargaining Power of Buyers
- 4.1.3. Threat of New Entrants
- 4.1.4. Threat of Substitutes
- 4.1.5. Competitive Rivalry
- 4.2. PESTEL analysis
- 4.3. BCG Analysis
- 4.3.1. Stars (High Growth, High Market Share)
- 4.3.2. Cash Cows (Low Growth, High Market Share)
- 4.3.3. Question Mark (High Growth, Low Market Share)
- 4.3.4. Dogs (Low Growth, Low Market Share)
- 4.4. Ansoff Matrix Analysis
- 4.5. Supply Chain Analysis
- 4.6. Regulatory Landscape
- 4.7. Current Market Potential and Opportunity Assessment (TAM–SAM–SOM Framework)
- 4.8. PRI Analyst Note
- 4.1. Porters Five Forces
- 5. Market Analysis, Insights and Forecast 2021-2033
- 5.1. Market Analysis, Insights and Forecast - by Product Type
- 5.1.1. Biocides and Disinfectants
- 5.1.2. Coagulants and Flocculants
- 5.1.3. Corrosion and Scale Inhibitors
- 5.1.4. Defoamers and Defoaming Agents
- 5.1.5. pH Conditioners/Adjusters
- 5.1.6. Other Product Types
- 5.2. Market Analysis, Insights and Forecast - by End-user Industry
- 5.2.1. Power Generation
- 5.2.2. Oil and Gas
- 5.2.3. Chemical Manufacturing
- 5.2.4. Mining and Mineral Processing
- 5.2.5. Municipal
- 5.2.6. Food and Beverage
- 5.2.7. Pulp and Paper
- 5.2.8. Other End-user Industries
- 5.3. Market Analysis, Insights and Forecast - by Region
- 5.3.1. Australia
- 5.1. Market Analysis, Insights and Forecast - by Product Type
- 6. Australia & New Zealand Water Treatment Chemicals Industry Analysis, Insights and Forecast, 2021-2033
- 6.1. Market Analysis, Insights and Forecast - by Product Type
- 6.1.1. Biocides and Disinfectants
- 6.1.2. Coagulants and Flocculants
- 6.1.3. Corrosion and Scale Inhibitors
- 6.1.4. Defoamers and Defoaming Agents
- 6.1.5. pH Conditioners/Adjusters
- 6.1.6. Other Product Types
- 6.2. Market Analysis, Insights and Forecast - by End-user Industry
- 6.2.1. Power Generation
- 6.2.2. Oil and Gas
- 6.2.3. Chemical Manufacturing
- 6.2.4. Mining and Mineral Processing
- 6.2.5. Municipal
- 6.2.6. Food and Beverage
- 6.2.7. Pulp and Paper
- 6.2.8. Other End-user Industries
- 6.1. Market Analysis, Insights and Forecast - by Product Type
- 7. Competitive Analysis
- 7.1. Company Profiles
- 7.1.1 Kemira Oyj
- 7.1.1.1. Company Overview
- 7.1.1.2. Products
- 7.1.1.3. Company Financials
- 7.1.1.4. SWOT Analysis
- 7.1.2 Coogee
- 7.1.2.1. Company Overview
- 7.1.2.2. Products
- 7.1.2.3. Company Financials
- 7.1.2.4. SWOT Analysis
- 7.1.3 Ecolab
- 7.1.3.1. Company Overview
- 7.1.3.2. Products
- 7.1.3.3. Company Financials
- 7.1.3.4. SWOT Analysis
- 7.1.4 SNF
- 7.1.4.1. Company Overview
- 7.1.4.2. Products
- 7.1.4.3. Company Financials
- 7.1.4.4. SWOT Analysis
- 7.1.5 IWTS Group Pty Ltd
- 7.1.5.1. Company Overview
- 7.1.5.2. Products
- 7.1.5.3. Company Financials
- 7.1.5.4. SWOT Analysis
- 7.1.6 Solvay
- 7.1.6.1. Company Overview
- 7.1.6.2. Products
- 7.1.6.3. Company Financials
- 7.1.6.4. SWOT Analysis
- 7.1.7 Buckman
- 7.1.7.1. Company Overview
- 7.1.7.2. Products
- 7.1.7.3. Company Financials
- 7.1.7.4. SWOT Analysis
- 7.1.8 Aquasol
- 7.1.8.1. Company Overview
- 7.1.8.2. Products
- 7.1.8.3. Company Financials
- 7.1.8.4. SWOT Analysis
- 7.1.9 Dow
- 7.1.9.1. Company Overview
- 7.1.9.2. Products
- 7.1.9.3. Company Financials
- 7.1.9.4. SWOT Analysis
- 7.1.10 Solenis
- 7.1.10.1. Company Overview
- 7.1.10.2. Products
- 7.1.10.3. Company Financials
- 7.1.10.4. SWOT Analysis
- 7.1.11 Ixom
- 7.1.11.1. Company Overview
- 7.1.11.2. Products
- 7.1.11.3. Company Financials
- 7.1.11.4. SWOT Analysis
- 7.1.12 Albemarle Corporation
- 7.1.12.1. Company Overview
- 7.1.12.2. Products
- 7.1.12.3. Company Financials
- 7.1.12.4. SWOT Analysis
- 7.1.13 Veolia (Veolia Water Technologies)
- 7.1.13.1. Company Overview
- 7.1.13.2. Products
- 7.1.13.3. Company Financials
- 7.1.13.4. SWOT Analysis
- 7.1.1 Kemira Oyj
- 7.2. Market Entropy
- 7.2.1 Company's Key Areas Served
- 7.2.2 Recent Developments
- 7.3. Company Market Share Analysis 2025
- 7.3.1 Top 5 Companies Market Share Analysis
- 7.3.2 Top 3 Companies Market Share Analysis
- 7.4. List of Potential Customers
- 8. Research Methodology
List of Figures
- Figure 1: Australia & New Zealand Water Treatment Chemicals Industry Revenue Breakdown (billion, %) by Product 2025 & 2033
- Figure 2: Australia & New Zealand Water Treatment Chemicals Industry Share (%) by Company 2025
List of Tables
- Table 1: Australia & New Zealand Water Treatment Chemicals Industry Revenue billion Forecast, by Product Type 2020 & 2033
- Table 2: Australia & New Zealand Water Treatment Chemicals Industry Volume K Tons Forecast, by Product Type 2020 & 2033
- Table 3: Australia & New Zealand Water Treatment Chemicals Industry Revenue billion Forecast, by End-user Industry 2020 & 2033
- Table 4: Australia & New Zealand Water Treatment Chemicals Industry Volume K Tons Forecast, by End-user Industry 2020 & 2033
- Table 5: Australia & New Zealand Water Treatment Chemicals Industry Revenue billion Forecast, by Region 2020 & 2033
- Table 6: Australia & New Zealand Water Treatment Chemicals Industry Volume K Tons Forecast, by Region 2020 & 2033
- Table 7: Australia & New Zealand Water Treatment Chemicals Industry Revenue billion Forecast, by Product Type 2020 & 2033
- Table 8: Australia & New Zealand Water Treatment Chemicals Industry Volume K Tons Forecast, by Product Type 2020 & 2033
- Table 9: Australia & New Zealand Water Treatment Chemicals Industry Revenue billion Forecast, by End-user Industry 2020 & 2033
- Table 10: Australia & New Zealand Water Treatment Chemicals Industry Volume K Tons Forecast, by End-user Industry 2020 & 2033
- Table 11: Australia & New Zealand Water Treatment Chemicals Industry Revenue billion Forecast, by Country 2020 & 2033
- Table 12: Australia & New Zealand Water Treatment Chemicals Industry Volume K Tons Forecast, by Country 2020 & 2033
Frequently Asked Questions
1. What is the projected Compound Annual Growth Rate (CAGR) of the Australia & New Zealand Water Treatment Chemicals Industry?
The projected CAGR is approximately 5.6%.
2. Which companies are prominent players in the Australia & New Zealand Water Treatment Chemicals Industry?
Key companies in the market include Kemira Oyj, Coogee, Ecolab, SNF, IWTS Group Pty Ltd, Solvay, Buckman, Aquasol, Dow, Solenis, Ixom, Albemarle Corporation, Veolia (Veolia Water Technologies).
3. What are the main segments of the Australia & New Zealand Water Treatment Chemicals Industry?
The market segments include Product Type, End-user Industry.
4. Can you provide details about the market size?
The market size is estimated to be USD 1.1 billion as of 2022.
5. What are some drivers contributing to market growth?
Rising Groundwater and Surface Water Pollution; Growing Demand From Power and Industrial Applications; Increasing Government Intervention in Reliable Wastewater Management; Substitution of Other Polyethylene Products.
6. What are the notable trends driving market growth?
Municipal End-user Industry to Dominate the Market.
7. Are there any restraints impacting market growth?
Hazardous Nature of Hydrazine; Emerging Alternatives to Water Treatment Chemicals.
8. Can you provide examples of recent developments in the market?
N/A
9. What pricing options are available for accessing the report?
Pricing options include single-user, multi-user, and enterprise licenses priced at USD 3,950, USD 4,950, and USD 6,950 respectively.
10. Is the market size provided in terms of value or volume?
The market size is provided in terms of value, measured in billion and volume, measured in K Tons.
11. Are there any specific market keywords associated with the report?
Yes, the market keyword associated with the report is "Australia & New Zealand Water Treatment Chemicals Industry," which aids in identifying and referencing the specific market segment covered.
12. How do I determine which pricing option suits my needs best?
The pricing options vary based on user requirements and access needs. Individual users may opt for single-user licenses, while businesses requiring broader access may choose multi-user or enterprise licenses for cost-effective access to the report.
13. Are there any additional resources or data provided in the Australia & New Zealand Water Treatment Chemicals Industry report?
While the report offers comprehensive insights, it's advisable to review the specific contents or supplementary materials provided to ascertain if additional resources or data are available.
14. How can I stay updated on further developments or reports in the Australia & New Zealand Water Treatment Chemicals Industry?
To stay informed about further developments, trends, and reports in the Australia & New Zealand Water Treatment Chemicals Industry, consider subscribing to industry newsletters, following relevant companies and organizations, or regularly checking reputable industry news sources and publications.
Methodology
Step 1 - Identification of Relevant Samples Size from Population Database


Step 2 - Approaches for Defining Global Market Size (Value, Volume* & Price*)

Note*: In applicable scenarios
Step 3 - Data Sources
Primary Research
- Web Analytics
- Survey Reports
- Research Institute
- Latest Research Reports
- Opinion Leaders
Secondary Research
- Annual Reports
- White Paper
- Latest Press Release
- Industry Association
- Paid Database
- Investor Presentations

Step 4 - Data Triangulation
Involves using different sources of information in order to increase the validity of a study
These sources are likely to be stakeholders in a program - participants, other researchers, program staff, other community members, and so on.
Then we put all data in single framework & apply various statistical tools to find out the dynamic on the market.
During the analysis stage, feedback from the stakeholder groups would be compared to determine areas of agreement as well as areas of divergence