

Key Insights
The automated visual inspection software market is poised for significant expansion, driven by an escalating demand for enhanced quality control and operational efficiency across diverse industries. Key growth catalysts include the widespread adoption of Industry 4.0 principles, the imperative for superior product quality, and the increasing integration of automation in manufacturing. Businesses are actively investing in advanced visual inspection systems to minimize defects, reduce waste, and optimize production throughput. This trend is particularly evident in critical sectors such as electronics, automotive, pharmaceuticals, and food processing, where precision is paramount. The market is rapidly evolving towards AI-powered solutions, offering unparalleled accuracy, speed, and adaptability over traditional methods. The incorporation of machine learning algorithms further facilitates continuous improvement and self-learning capabilities, leading to more precise defect detection and classification.
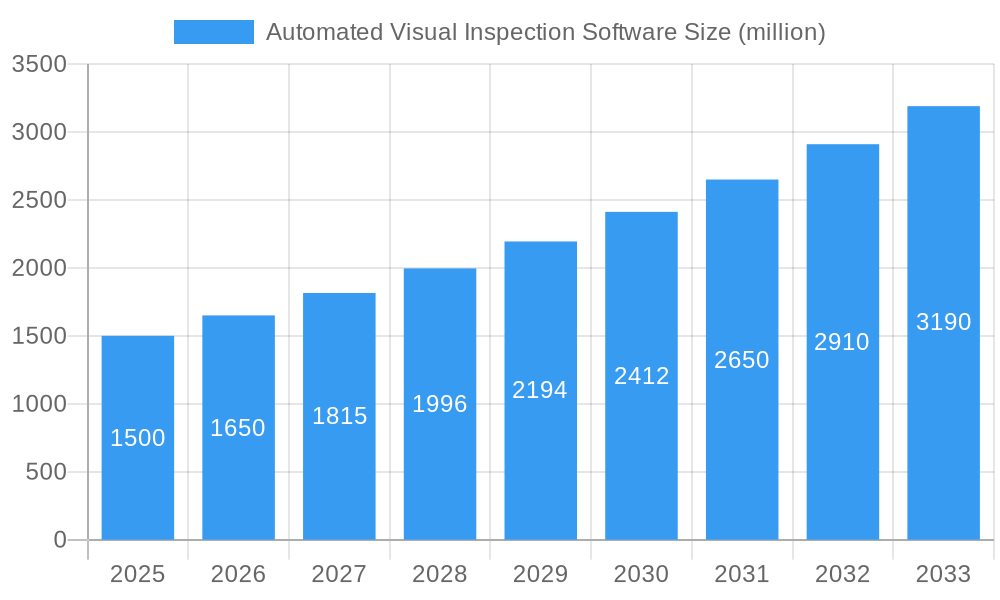
Automated Visual Inspection Software Market Size (In Billion)
Despite this promising outlook, the market encounters specific challenges. The substantial upfront investment required for sophisticated visual inspection systems can present a barrier for smaller enterprises. Additionally, the intricate process of integrating these systems into existing manufacturing environments, coupled with the need for specialized expertise, can complicate implementation. Nevertheless, the projected long-term cost reductions realized through minimized waste, improved product quality, and amplified efficiency are expected to surmount these initial hurdles. The competitive landscape is intensifying, with established players and emerging technology providers spurring innovation and enhancing affordability, ultimately benefiting end-users with a wider array of customized solutions. The market is projected to reach a size of $19.04 billion by the base year 2025, with a Compound Annual Growth Rate (CAGR) of 11.8% during the forecast period (2025-2033).
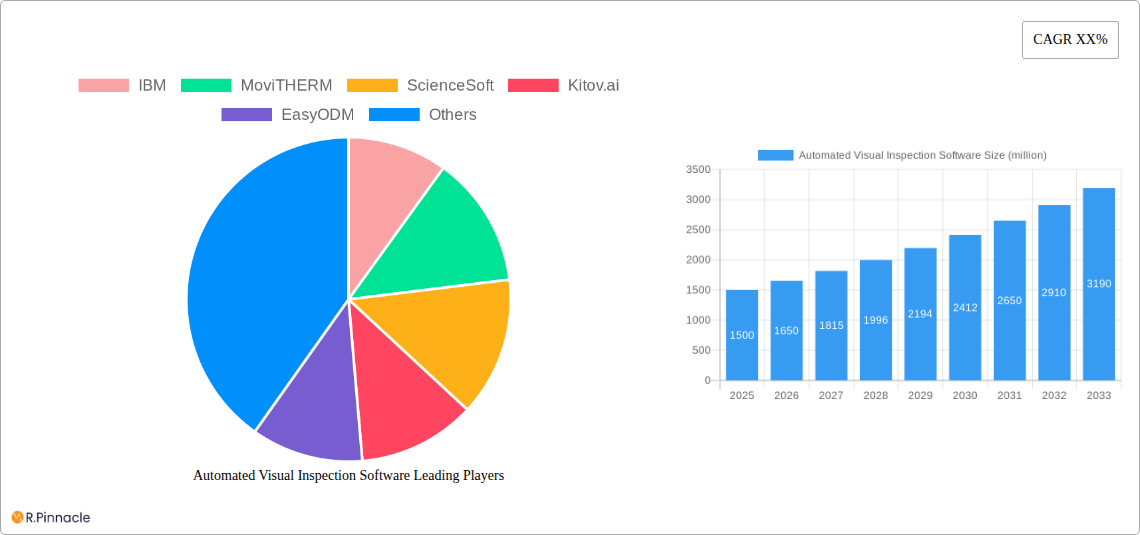
Automated Visual Inspection Software Company Market Share
Automated Visual Inspection Software Market Report: 2019-2033
This comprehensive report provides a detailed analysis of the Automated Visual Inspection Software market, projecting a robust growth trajectory over the forecast period (2025-2033). The study covers market structure, innovation trends, dynamics, regional dominance, product innovations, and future outlook, offering actionable insights for industry professionals. With a base year of 2025 and a study period spanning 2019-2033, this report leverages data from the historical period (2019-2024) to provide accurate estimations and predictions. The market is estimated to be worth $xx million in 2025.
Automated Visual Inspection Software Market Structure & Innovation Trends
The Automated Visual Inspection Software market exhibits a moderately consolidated structure, with key players like IBM, Cognex, Keyence, and Omron holding significant market share in 2025. The combined market share of these top 4 players is estimated at xx%. Innovation is primarily driven by advancements in AI, machine learning, and high-resolution imaging technologies. Stringent quality control regulations across various industries, particularly automotive and electronics, fuel market growth. Product substitutes include manual inspection methods, but the increasing demand for efficiency and accuracy favors automated solutions. End-users span diverse sectors including automotive, electronics, pharmaceuticals, and food processing. M&A activity has been moderate, with a total deal value of approximately $xx million recorded between 2019 and 2024, primarily focused on expanding technological capabilities and market reach.
- Market Concentration: Moderately consolidated with a few dominant players.
- Innovation Drivers: AI, Machine Learning, High-resolution imaging.
- Regulatory Frameworks: Stringent quality control standards in various industries.
- Product Substitutes: Manual inspection methods.
- End-User Demographics: Automotive, Electronics, Pharmaceuticals, Food Processing.
- M&A Activities: Moderate activity with a total deal value of approximately $xx million (2019-2024).
Automated Visual Inspection Software Market Dynamics & Trends
The Automated Visual Inspection Software market is poised for significant growth, with a projected Compound Annual Growth Rate (CAGR) of xx% during the forecast period (2025-2033). This growth is fueled by several key factors: increasing automation across industries, rising demand for enhanced product quality, and the need for improved efficiency. Technological disruptions, such as the integration of deep learning algorithms and advanced sensor technologies, are revolutionizing inspection processes. Consumer preferences for higher quality and defect-free products further drive market demand. Competitive dynamics are characterized by continuous innovation, strategic partnerships, and the emergence of new players, particularly in the niche areas of specific industry applications. Market penetration is expected to increase significantly, particularly in developing economies, driven by increasing adoption rates in manufacturing and quality control processes.
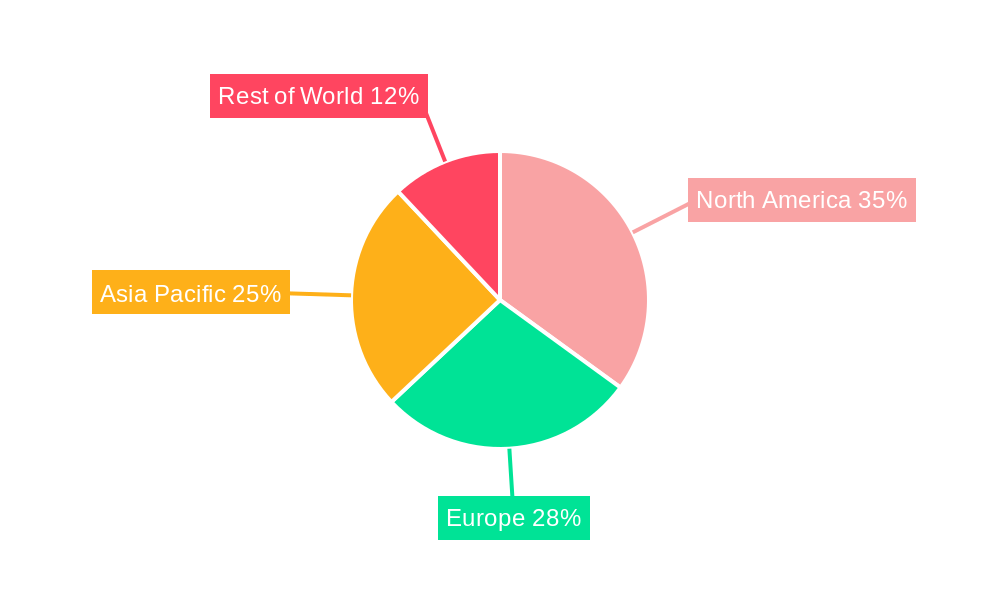
Dominant Regions & Segments in Automated Visual Inspection Software
The North American region holds the dominant position in the Automated Visual Inspection Software market, accounting for approximately xx% of the global market share in 2025. This dominance stems from factors such as:
- Strong Automotive & Electronics Industries: Large presence of leading automotive and electronics manufacturers creates substantial demand for automated inspection solutions.
- High Adoption of Advanced Technologies: Early adoption of advanced technologies and strong R&D investments contribute to market growth.
- Favorable Regulatory Environment: Supportive regulatory frameworks promote the adoption of automation and quality control measures.
Other regions, such as Europe and Asia-Pacific, are also experiencing significant growth, driven by increasing industrialization and the expanding manufacturing sector. Specific segments, such as the automotive and electronics sectors, demonstrate particularly high demand for automated visual inspection software, fueled by their stringent quality control requirements.
Automated Visual Inspection Software Product Innovations
Recent years have witnessed significant advancements in Automated Visual Inspection Software, particularly in the areas of AI-powered defect detection, improved image processing algorithms, and the integration of advanced sensor technologies. These innovations have led to greater accuracy, speed, and efficiency in inspection processes. New applications are emerging in diverse sectors, extending beyond traditional manufacturing to encompass areas like healthcare and logistics. Companies are focusing on developing user-friendly interfaces and customizable solutions to cater to the specific needs of different industries and applications. This creates a competitive advantage by enabling seamless integration into existing workflows and reducing implementation costs.
Report Scope & Segmentation Analysis
This report segments the Automated Visual Inspection Software market by various parameters including:
- By Technology: Machine Vision, AI-based systems.
- By Application: Automotive, Electronics, Pharmaceuticals, Food & Beverage, and others.
- By Deployment: On-premise, Cloud-based.
- By Region: North America, Europe, Asia Pacific, and Rest of the World.
Each segment presents unique growth trajectories and competitive landscapes. For instance, the AI-based systems segment is experiencing the fastest growth rate, driven by its superior accuracy and efficiency. Similarly, the automotive segment demonstrates high demand due to strict quality standards.
Key Drivers of Automated Visual Inspection Software Growth
The growth of the Automated Visual Inspection Software market is primarily driven by:
- Rising Demand for High-Quality Products: Consumer preference for high-quality, defect-free products drives the need for robust inspection systems.
- Increased Automation in Manufacturing: Industries are increasingly automating their processes to improve efficiency and reduce costs.
- Advancements in AI and Machine Learning: Improved algorithms enable more accurate and faster defect detection.
- Stringent Government Regulations: Stricter quality control regulations necessitate the use of advanced inspection technologies.
These factors collectively contribute to a significant increase in demand for automated visual inspection software.
Challenges in the Automated Visual Inspection Software Sector
The Automated Visual Inspection Software market faces several challenges:
- High Initial Investment Costs: Implementing automated systems can involve substantial upfront investments.
- Complexity of Integration: Integrating these systems into existing production lines can be complex.
- Skill Gap: A shortage of skilled personnel to operate and maintain these advanced systems poses a challenge.
- Data Security Concerns: Safeguarding sensitive data collected during inspections is crucial.
Emerging Opportunities in Automated Visual Inspection Software
The market presents several emerging opportunities:
- Expansion into New Industries: Application of automated inspection technologies in sectors like agriculture and aerospace.
- Development of Specialized Solutions: Creating tailored solutions to address the specific needs of diverse industries.
- Integration with IoT and Cloud Platforms: Connecting inspection systems to cloud platforms for remote monitoring and data analysis.
- Advancements in 3D Imaging and Deep Learning: Enhancing accuracy and efficiency through the incorporation of these emerging technologies.
Leading Players in the Automated Visual Inspection Software Market
Key Developments in Automated Visual Inspection Software Industry
- 2022 Q3: Cognex launched a new AI-powered vision system for improved defect detection.
- 2023 Q1: Keyence announced a partnership to expand its market reach in the automotive sector.
- 2024 Q2: IBM integrated its AI platform with a leading vision system manufacturer for enhanced software capabilities.
- (Further significant developments to be added based on available data.)
Future Outlook for Automated Visual Inspection Software Market
The Automated Visual Inspection Software market is expected to experience continued growth, driven by technological advancements, increasing automation across various industries, and rising demand for higher-quality products. Strategic partnerships, mergers and acquisitions, and the emergence of new innovative solutions will further shape the market landscape. The focus on AI-powered solutions, integration with IoT platforms, and expansion into new applications will drive market growth and create significant opportunities for industry players. The market is projected to reach $xx million by 2033.
Automated Visual Inspection Software Segmentation
-
1. Application
- 1.1. Consumer Electronics
- 1.2. Food
- 1.3. Pharmaceutical
- 1.4. Automotive
- 1.5. Medical
- 1.6. Others
-
2. Types
- 2.1. 3D Inspection
- 2.2. 2D Inspection
Automated Visual Inspection Software Segmentation By Geography
-
1. North America
- 1.1. United States
- 1.2. Canada
- 1.3. Mexico
-
2. South America
- 2.1. Brazil
- 2.2. Argentina
- 2.3. Rest of South America
-
3. Europe
- 3.1. United Kingdom
- 3.2. Germany
- 3.3. France
- 3.4. Italy
- 3.5. Spain
- 3.6. Russia
- 3.7. Benelux
- 3.8. Nordics
- 3.9. Rest of Europe
-
4. Middle East & Africa
- 4.1. Turkey
- 4.2. Israel
- 4.3. GCC
- 4.4. North Africa
- 4.5. South Africa
- 4.6. Rest of Middle East & Africa
-
5. Asia Pacific
- 5.1. China
- 5.2. India
- 5.3. Japan
- 5.4. South Korea
- 5.5. ASEAN
- 5.6. Oceania
- 5.7. Rest of Asia Pacific
Automated Visual Inspection Software Regional Market Share
Geographic Coverage of Automated Visual Inspection Software
Automated Visual Inspection Software REPORT HIGHLIGHTS
| Aspects | Details |
|---|---|
| Study Period | 2020-2034 |
| Base Year | 2025 |
| Estimated Year | 2026 |
| Forecast Period | 2026-2034 |
| Historical Period | 2020-2025 |
| Growth Rate | CAGR of 11.8% from 2020-2034 |
| Segmentation |
|
Table of Contents
- 1. Introduction
- 1.1. Research Scope
- 1.2. Market Segmentation
- 1.3. Research Methodology
- 1.4. Definitions and Assumptions
- 2. Executive Summary
- 2.1. Introduction
- 3. Market Dynamics
- 3.1. Introduction
- 3.2. Market Drivers
- 3.3. Market Restrains
- 3.4. Market Trends
- 4. Market Factor Analysis
- 4.1. Porters Five Forces
- 4.2. Supply/Value Chain
- 4.3. PESTEL analysis
- 4.4. Market Entropy
- 4.5. Patent/Trademark Analysis
- 5. Global Automated Visual Inspection Software Analysis, Insights and Forecast, 2020-2032
- 5.1. Market Analysis, Insights and Forecast - by Application
- 5.1.1. Consumer Electronics
- 5.1.2. Food
- 5.1.3. Pharmaceutical
- 5.1.4. Automotive
- 5.1.5. Medical
- 5.1.6. Others
- 5.2. Market Analysis, Insights and Forecast - by Types
- 5.2.1. 3D Inspection
- 5.2.2. 2D Inspection
- 5.3. Market Analysis, Insights and Forecast - by Region
- 5.3.1. North America
- 5.3.2. South America
- 5.3.3. Europe
- 5.3.4. Middle East & Africa
- 5.3.5. Asia Pacific
- 5.1. Market Analysis, Insights and Forecast - by Application
- 6. North America Automated Visual Inspection Software Analysis, Insights and Forecast, 2020-2032
- 6.1. Market Analysis, Insights and Forecast - by Application
- 6.1.1. Consumer Electronics
- 6.1.2. Food
- 6.1.3. Pharmaceutical
- 6.1.4. Automotive
- 6.1.5. Medical
- 6.1.6. Others
- 6.2. Market Analysis, Insights and Forecast - by Types
- 6.2.1. 3D Inspection
- 6.2.2. 2D Inspection
- 6.1. Market Analysis, Insights and Forecast - by Application
- 7. South America Automated Visual Inspection Software Analysis, Insights and Forecast, 2020-2032
- 7.1. Market Analysis, Insights and Forecast - by Application
- 7.1.1. Consumer Electronics
- 7.1.2. Food
- 7.1.3. Pharmaceutical
- 7.1.4. Automotive
- 7.1.5. Medical
- 7.1.6. Others
- 7.2. Market Analysis, Insights and Forecast - by Types
- 7.2.1. 3D Inspection
- 7.2.2. 2D Inspection
- 7.1. Market Analysis, Insights and Forecast - by Application
- 8. Europe Automated Visual Inspection Software Analysis, Insights and Forecast, 2020-2032
- 8.1. Market Analysis, Insights and Forecast - by Application
- 8.1.1. Consumer Electronics
- 8.1.2. Food
- 8.1.3. Pharmaceutical
- 8.1.4. Automotive
- 8.1.5. Medical
- 8.1.6. Others
- 8.2. Market Analysis, Insights and Forecast - by Types
- 8.2.1. 3D Inspection
- 8.2.2. 2D Inspection
- 8.1. Market Analysis, Insights and Forecast - by Application
- 9. Middle East & Africa Automated Visual Inspection Software Analysis, Insights and Forecast, 2020-2032
- 9.1. Market Analysis, Insights and Forecast - by Application
- 9.1.1. Consumer Electronics
- 9.1.2. Food
- 9.1.3. Pharmaceutical
- 9.1.4. Automotive
- 9.1.5. Medical
- 9.1.6. Others
- 9.2. Market Analysis, Insights and Forecast - by Types
- 9.2.1. 3D Inspection
- 9.2.2. 2D Inspection
- 9.1. Market Analysis, Insights and Forecast - by Application
- 10. Asia Pacific Automated Visual Inspection Software Analysis, Insights and Forecast, 2020-2032
- 10.1. Market Analysis, Insights and Forecast - by Application
- 10.1.1. Consumer Electronics
- 10.1.2. Food
- 10.1.3. Pharmaceutical
- 10.1.4. Automotive
- 10.1.5. Medical
- 10.1.6. Others
- 10.2. Market Analysis, Insights and Forecast - by Types
- 10.2.1. 3D Inspection
- 10.2.2. 2D Inspection
- 10.1. Market Analysis, Insights and Forecast - by Application
- 11. Competitive Analysis
- 11.1. Global Market Share Analysis 2025
- 11.2. Company Profiles
- 11.2.1 IBM
- 11.2.1.1. Overview
- 11.2.1.2. Products
- 11.2.1.3. SWOT Analysis
- 11.2.1.4. Recent Developments
- 11.2.1.5. Financials (Based on Availability)
- 11.2.2 MoviTHERM
- 11.2.2.1. Overview
- 11.2.2.2. Products
- 11.2.2.3. SWOT Analysis
- 11.2.2.4. Recent Developments
- 11.2.2.5. Financials (Based on Availability)
- 11.2.3 ScienceSoft
- 11.2.3.1. Overview
- 11.2.3.2. Products
- 11.2.3.3. SWOT Analysis
- 11.2.3.4. Recent Developments
- 11.2.3.5. Financials (Based on Availability)
- 11.2.4 Kitov.ai
- 11.2.4.1. Overview
- 11.2.4.2. Products
- 11.2.4.3. SWOT Analysis
- 11.2.4.4. Recent Developments
- 11.2.4.5. Financials (Based on Availability)
- 11.2.5 EasyODM
- 11.2.5.1. Overview
- 11.2.5.2. Products
- 11.2.5.3. SWOT Analysis
- 11.2.5.4. Recent Developments
- 11.2.5.5. Financials (Based on Availability)
- 11.2.6 Syntegon
- 11.2.6.1. Overview
- 11.2.6.2. Products
- 11.2.6.3. SWOT Analysis
- 11.2.6.4. Recent Developments
- 11.2.6.5. Financials (Based on Availability)
- 11.2.7 Inspekto
- 11.2.7.1. Overview
- 11.2.7.2. Products
- 11.2.7.3. SWOT Analysis
- 11.2.7.4. Recent Developments
- 11.2.7.5. Financials (Based on Availability)
- 11.2.8 Panasonic
- 11.2.8.1. Overview
- 11.2.8.2. Products
- 11.2.8.3. SWOT Analysis
- 11.2.8.4. Recent Developments
- 11.2.8.5. Financials (Based on Availability)
- 11.2.9 Omron
- 11.2.9.1. Overview
- 11.2.9.2. Products
- 11.2.9.3. SWOT Analysis
- 11.2.9.4. Recent Developments
- 11.2.9.5. Financials (Based on Availability)
- 11.2.10 Cognex
- 11.2.10.1. Overview
- 11.2.10.2. Products
- 11.2.10.3. SWOT Analysis
- 11.2.10.4. Recent Developments
- 11.2.10.5. Financials (Based on Availability)
- 11.2.11 Keyence
- 11.2.11.1. Overview
- 11.2.11.2. Products
- 11.2.11.3. SWOT Analysis
- 11.2.11.4. Recent Developments
- 11.2.11.5. Financials (Based on Availability)
- 11.2.12 Data Logic
- 11.2.12.1. Overview
- 11.2.12.2. Products
- 11.2.12.3. SWOT Analysis
- 11.2.12.4. Recent Developments
- 11.2.12.5. Financials (Based on Availability)
- 11.2.13 National lnstruments
- 11.2.13.1. Overview
- 11.2.13.2. Products
- 11.2.13.3. SWOT Analysis
- 11.2.13.4. Recent Developments
- 11.2.13.5. Financials (Based on Availability)
- 11.2.14 Baumer
- 11.2.14.1. Overview
- 11.2.14.2. Products
- 11.2.14.3. SWOT Analysis
- 11.2.14.4. Recent Developments
- 11.2.14.5. Financials (Based on Availability)
- 11.2.15 Sick
- 11.2.15.1. Overview
- 11.2.15.2. Products
- 11.2.15.3. SWOT Analysis
- 11.2.15.4. Recent Developments
- 11.2.15.5. Financials (Based on Availability)
- 11.2.16 ISRA VISION
- 11.2.16.1. Overview
- 11.2.16.2. Products
- 11.2.16.3. SWOT Analysis
- 11.2.16.4. Recent Developments
- 11.2.16.5. Financials (Based on Availability)
- 11.2.17 Hermary
- 11.2.17.1. Overview
- 11.2.17.2. Products
- 11.2.17.3. SWOT Analysis
- 11.2.17.4. Recent Developments
- 11.2.17.5. Financials (Based on Availability)
- 11.2.18 FLIR Systems
- 11.2.18.1. Overview
- 11.2.18.2. Products
- 11.2.18.3. SWOT Analysis
- 11.2.18.4. Recent Developments
- 11.2.18.5. Financials (Based on Availability)
- 11.2.19 IDS Imaging
- 11.2.19.1. Overview
- 11.2.19.2. Products
- 11.2.19.3. SWOT Analysis
- 11.2.19.4. Recent Developments
- 11.2.19.5. Financials (Based on Availability)
- 11.2.20 LMI Technologies
- 11.2.20.1. Overview
- 11.2.20.2. Products
- 11.2.20.3. SWOT Analysis
- 11.2.20.4. Recent Developments
- 11.2.20.5. Financials (Based on Availability)
- 11.2.21 AccuSentry
- 11.2.21.1. Overview
- 11.2.21.2. Products
- 11.2.21.3. SWOT Analysis
- 11.2.21.4. Recent Developments
- 11.2.21.5. Financials (Based on Availability)
- 11.2.22 Boulder Imaging
- 11.2.22.1. Overview
- 11.2.22.2. Products
- 11.2.22.3. SWOT Analysis
- 11.2.22.4. Recent Developments
- 11.2.22.5. Financials (Based on Availability)
- 11.2.23 Cincinnati Automation
- 11.2.23.1. Overview
- 11.2.23.2. Products
- 11.2.23.3. SWOT Analysis
- 11.2.23.4. Recent Developments
- 11.2.23.5. Financials (Based on Availability)
- 11.2.24 Industrial Vision Systems
- 11.2.24.1. Overview
- 11.2.24.2. Products
- 11.2.24.3. SWOT Analysis
- 11.2.24.4. Recent Developments
- 11.2.24.5. Financials (Based on Availability)
- 11.2.1 IBM
List of Figures
- Figure 1: Global Automated Visual Inspection Software Revenue Breakdown (billion, %) by Region 2025 & 2033
- Figure 2: North America Automated Visual Inspection Software Revenue (billion), by Application 2025 & 2033
- Figure 3: North America Automated Visual Inspection Software Revenue Share (%), by Application 2025 & 2033
- Figure 4: North America Automated Visual Inspection Software Revenue (billion), by Types 2025 & 2033
- Figure 5: North America Automated Visual Inspection Software Revenue Share (%), by Types 2025 & 2033
- Figure 6: North America Automated Visual Inspection Software Revenue (billion), by Country 2025 & 2033
- Figure 7: North America Automated Visual Inspection Software Revenue Share (%), by Country 2025 & 2033
- Figure 8: South America Automated Visual Inspection Software Revenue (billion), by Application 2025 & 2033
- Figure 9: South America Automated Visual Inspection Software Revenue Share (%), by Application 2025 & 2033
- Figure 10: South America Automated Visual Inspection Software Revenue (billion), by Types 2025 & 2033
- Figure 11: South America Automated Visual Inspection Software Revenue Share (%), by Types 2025 & 2033
- Figure 12: South America Automated Visual Inspection Software Revenue (billion), by Country 2025 & 2033
- Figure 13: South America Automated Visual Inspection Software Revenue Share (%), by Country 2025 & 2033
- Figure 14: Europe Automated Visual Inspection Software Revenue (billion), by Application 2025 & 2033
- Figure 15: Europe Automated Visual Inspection Software Revenue Share (%), by Application 2025 & 2033
- Figure 16: Europe Automated Visual Inspection Software Revenue (billion), by Types 2025 & 2033
- Figure 17: Europe Automated Visual Inspection Software Revenue Share (%), by Types 2025 & 2033
- Figure 18: Europe Automated Visual Inspection Software Revenue (billion), by Country 2025 & 2033
- Figure 19: Europe Automated Visual Inspection Software Revenue Share (%), by Country 2025 & 2033
- Figure 20: Middle East & Africa Automated Visual Inspection Software Revenue (billion), by Application 2025 & 2033
- Figure 21: Middle East & Africa Automated Visual Inspection Software Revenue Share (%), by Application 2025 & 2033
- Figure 22: Middle East & Africa Automated Visual Inspection Software Revenue (billion), by Types 2025 & 2033
- Figure 23: Middle East & Africa Automated Visual Inspection Software Revenue Share (%), by Types 2025 & 2033
- Figure 24: Middle East & Africa Automated Visual Inspection Software Revenue (billion), by Country 2025 & 2033
- Figure 25: Middle East & Africa Automated Visual Inspection Software Revenue Share (%), by Country 2025 & 2033
- Figure 26: Asia Pacific Automated Visual Inspection Software Revenue (billion), by Application 2025 & 2033
- Figure 27: Asia Pacific Automated Visual Inspection Software Revenue Share (%), by Application 2025 & 2033
- Figure 28: Asia Pacific Automated Visual Inspection Software Revenue (billion), by Types 2025 & 2033
- Figure 29: Asia Pacific Automated Visual Inspection Software Revenue Share (%), by Types 2025 & 2033
- Figure 30: Asia Pacific Automated Visual Inspection Software Revenue (billion), by Country 2025 & 2033
- Figure 31: Asia Pacific Automated Visual Inspection Software Revenue Share (%), by Country 2025 & 2033
List of Tables
- Table 1: Global Automated Visual Inspection Software Revenue billion Forecast, by Application 2020 & 2033
- Table 2: Global Automated Visual Inspection Software Revenue billion Forecast, by Types 2020 & 2033
- Table 3: Global Automated Visual Inspection Software Revenue billion Forecast, by Region 2020 & 2033
- Table 4: Global Automated Visual Inspection Software Revenue billion Forecast, by Application 2020 & 2033
- Table 5: Global Automated Visual Inspection Software Revenue billion Forecast, by Types 2020 & 2033
- Table 6: Global Automated Visual Inspection Software Revenue billion Forecast, by Country 2020 & 2033
- Table 7: United States Automated Visual Inspection Software Revenue (billion) Forecast, by Application 2020 & 2033
- Table 8: Canada Automated Visual Inspection Software Revenue (billion) Forecast, by Application 2020 & 2033
- Table 9: Mexico Automated Visual Inspection Software Revenue (billion) Forecast, by Application 2020 & 2033
- Table 10: Global Automated Visual Inspection Software Revenue billion Forecast, by Application 2020 & 2033
- Table 11: Global Automated Visual Inspection Software Revenue billion Forecast, by Types 2020 & 2033
- Table 12: Global Automated Visual Inspection Software Revenue billion Forecast, by Country 2020 & 2033
- Table 13: Brazil Automated Visual Inspection Software Revenue (billion) Forecast, by Application 2020 & 2033
- Table 14: Argentina Automated Visual Inspection Software Revenue (billion) Forecast, by Application 2020 & 2033
- Table 15: Rest of South America Automated Visual Inspection Software Revenue (billion) Forecast, by Application 2020 & 2033
- Table 16: Global Automated Visual Inspection Software Revenue billion Forecast, by Application 2020 & 2033
- Table 17: Global Automated Visual Inspection Software Revenue billion Forecast, by Types 2020 & 2033
- Table 18: Global Automated Visual Inspection Software Revenue billion Forecast, by Country 2020 & 2033
- Table 19: United Kingdom Automated Visual Inspection Software Revenue (billion) Forecast, by Application 2020 & 2033
- Table 20: Germany Automated Visual Inspection Software Revenue (billion) Forecast, by Application 2020 & 2033
- Table 21: France Automated Visual Inspection Software Revenue (billion) Forecast, by Application 2020 & 2033
- Table 22: Italy Automated Visual Inspection Software Revenue (billion) Forecast, by Application 2020 & 2033
- Table 23: Spain Automated Visual Inspection Software Revenue (billion) Forecast, by Application 2020 & 2033
- Table 24: Russia Automated Visual Inspection Software Revenue (billion) Forecast, by Application 2020 & 2033
- Table 25: Benelux Automated Visual Inspection Software Revenue (billion) Forecast, by Application 2020 & 2033
- Table 26: Nordics Automated Visual Inspection Software Revenue (billion) Forecast, by Application 2020 & 2033
- Table 27: Rest of Europe Automated Visual Inspection Software Revenue (billion) Forecast, by Application 2020 & 2033
- Table 28: Global Automated Visual Inspection Software Revenue billion Forecast, by Application 2020 & 2033
- Table 29: Global Automated Visual Inspection Software Revenue billion Forecast, by Types 2020 & 2033
- Table 30: Global Automated Visual Inspection Software Revenue billion Forecast, by Country 2020 & 2033
- Table 31: Turkey Automated Visual Inspection Software Revenue (billion) Forecast, by Application 2020 & 2033
- Table 32: Israel Automated Visual Inspection Software Revenue (billion) Forecast, by Application 2020 & 2033
- Table 33: GCC Automated Visual Inspection Software Revenue (billion) Forecast, by Application 2020 & 2033
- Table 34: North Africa Automated Visual Inspection Software Revenue (billion) Forecast, by Application 2020 & 2033
- Table 35: South Africa Automated Visual Inspection Software Revenue (billion) Forecast, by Application 2020 & 2033
- Table 36: Rest of Middle East & Africa Automated Visual Inspection Software Revenue (billion) Forecast, by Application 2020 & 2033
- Table 37: Global Automated Visual Inspection Software Revenue billion Forecast, by Application 2020 & 2033
- Table 38: Global Automated Visual Inspection Software Revenue billion Forecast, by Types 2020 & 2033
- Table 39: Global Automated Visual Inspection Software Revenue billion Forecast, by Country 2020 & 2033
- Table 40: China Automated Visual Inspection Software Revenue (billion) Forecast, by Application 2020 & 2033
- Table 41: India Automated Visual Inspection Software Revenue (billion) Forecast, by Application 2020 & 2033
- Table 42: Japan Automated Visual Inspection Software Revenue (billion) Forecast, by Application 2020 & 2033
- Table 43: South Korea Automated Visual Inspection Software Revenue (billion) Forecast, by Application 2020 & 2033
- Table 44: ASEAN Automated Visual Inspection Software Revenue (billion) Forecast, by Application 2020 & 2033
- Table 45: Oceania Automated Visual Inspection Software Revenue (billion) Forecast, by Application 2020 & 2033
- Table 46: Rest of Asia Pacific Automated Visual Inspection Software Revenue (billion) Forecast, by Application 2020 & 2033
Frequently Asked Questions
1. What is the projected Compound Annual Growth Rate (CAGR) of the Automated Visual Inspection Software?
The projected CAGR is approximately 11.8%.
2. Which companies are prominent players in the Automated Visual Inspection Software?
Key companies in the market include IBM, MoviTHERM, ScienceSoft, Kitov.ai, EasyODM, Syntegon, Inspekto, Panasonic, Omron, Cognex, Keyence, Data Logic, National lnstruments, Baumer, Sick, ISRA VISION, Hermary, FLIR Systems, IDS Imaging, LMI Technologies, AccuSentry, Boulder Imaging, Cincinnati Automation, Industrial Vision Systems.
3. What are the main segments of the Automated Visual Inspection Software?
The market segments include Application, Types.
4. Can you provide details about the market size?
The market size is estimated to be USD 19.04 billion as of 2022.
5. What are some drivers contributing to market growth?
N/A
6. What are the notable trends driving market growth?
N/A
7. Are there any restraints impacting market growth?
N/A
8. Can you provide examples of recent developments in the market?
N/A
9. What pricing options are available for accessing the report?
Pricing options include single-user, multi-user, and enterprise licenses priced at USD 4350.00, USD 6525.00, and USD 8700.00 respectively.
10. Is the market size provided in terms of value or volume?
The market size is provided in terms of value, measured in billion.
11. Are there any specific market keywords associated with the report?
Yes, the market keyword associated with the report is "Automated Visual Inspection Software," which aids in identifying and referencing the specific market segment covered.
12. How do I determine which pricing option suits my needs best?
The pricing options vary based on user requirements and access needs. Individual users may opt for single-user licenses, while businesses requiring broader access may choose multi-user or enterprise licenses for cost-effective access to the report.
13. Are there any additional resources or data provided in the Automated Visual Inspection Software report?
While the report offers comprehensive insights, it's advisable to review the specific contents or supplementary materials provided to ascertain if additional resources or data are available.
14. How can I stay updated on further developments or reports in the Automated Visual Inspection Software?
To stay informed about further developments, trends, and reports in the Automated Visual Inspection Software, consider subscribing to industry newsletters, following relevant companies and organizations, or regularly checking reputable industry news sources and publications.
Methodology
Step 1 - Identification of Relevant Samples Size from Population Database


Step 2 - Approaches for Defining Global Market Size (Value, Volume* & Price*)

Note*: In applicable scenarios
Step 3 - Data Sources
Primary Research
- Web Analytics
- Survey Reports
- Research Institute
- Latest Research Reports
- Opinion Leaders
Secondary Research
- Annual Reports
- White Paper
- Latest Press Release
- Industry Association
- Paid Database
- Investor Presentations

Step 4 - Data Triangulation
Involves using different sources of information in order to increase the validity of a study
These sources are likely to be stakeholders in a program - participants, other researchers, program staff, other community members, and so on.
Then we put all data in single framework & apply various statistical tools to find out the dynamic on the market.
During the analysis stage, feedback from the stakeholder groups would be compared to determine areas of agreement as well as areas of divergence