

Key Insights
The global automotive third-party logistics (3PL) market is poised for significant expansion, driven by the increasing complexity of automotive supply chains and the demand for optimized, cost-effective logistics. The market is projected to reach $1260.98 billion by 2033, growing at a Compound Annual Growth Rate (CAGR) of 9.1% from a base year of 2025. Key growth catalysts include the globalization of automotive production, the widespread adoption of just-in-time inventory strategies, and the escalating need for specialized handling and storage of sensitive automotive components. Significant growth is anticipated in regions with robust automotive manufacturing hubs, such as Asia-Pacific and North America. The market is segmented by service type (transportation, warehousing, distribution, inventory management), vehicle type (finished vehicles, auto components), and geography. Industry leaders are actively investing in technological innovations like automation and data analytics to boost operational efficiency and refine supply chain management. However, challenges such as volatile fuel prices, geopolitical uncertainties, and evolving environmental regulations persist. The competitive landscape features a mix of large global corporations and agile regional specialists, fostering intense competition and a strong emphasis on innovation.
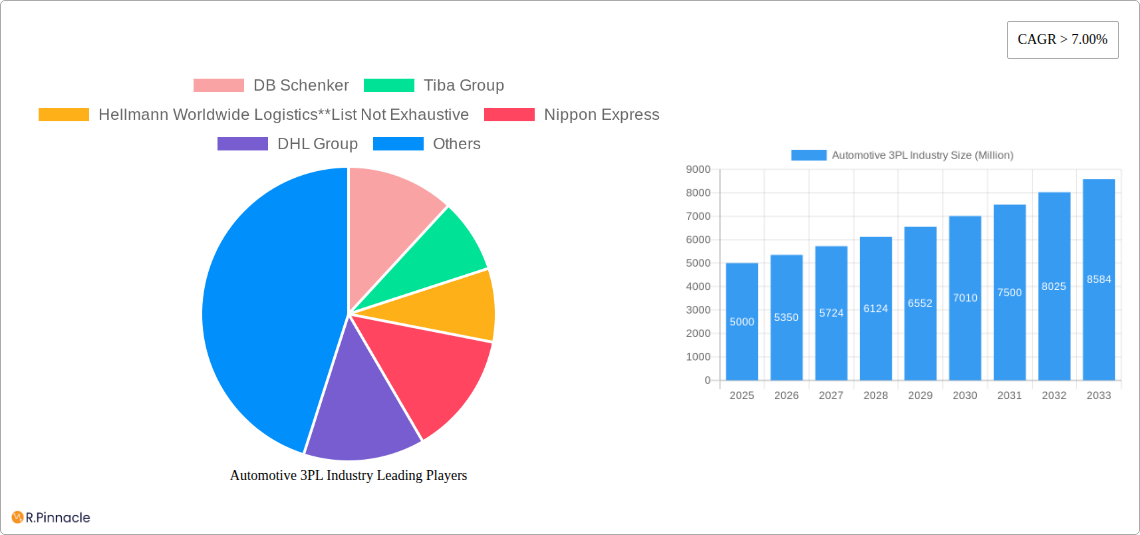
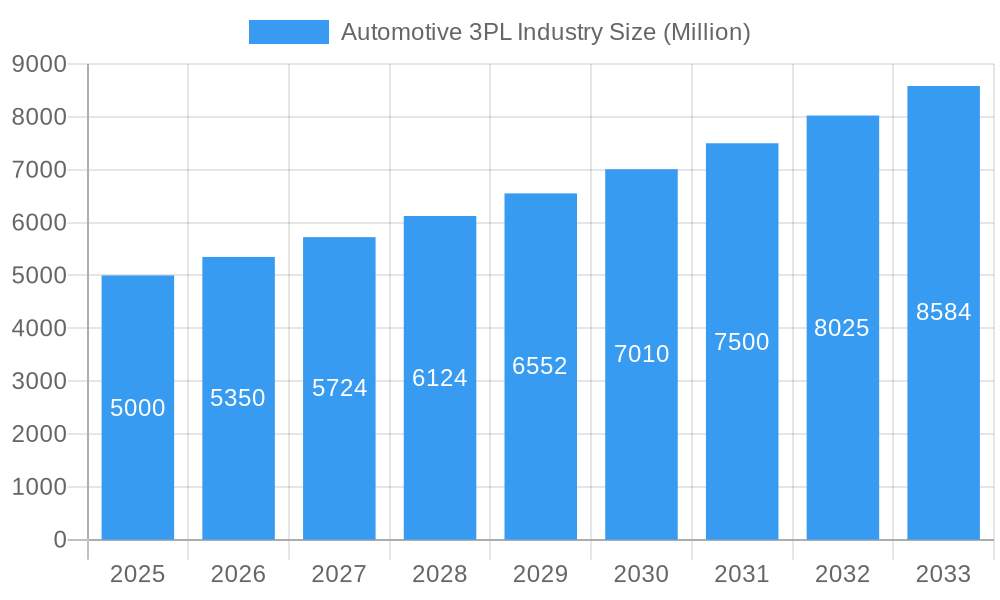
Automotive 3PL Industry Market Size (In Million)
The rapid growth in electric vehicle (EV) manufacturing is expected to further accelerate market expansion, requiring specialized logistics for battery components and charging infrastructure. An increasing focus on sustainability within the automotive sector is also compelling 3PL providers to implement eco-friendly practices, including the use of alternative fuels and route optimization to minimize carbon footprints. Future market success will depend on the adaptability of 3PL providers to technological advancements, their ability to meet evolving client needs, and their proactive risk management within a dynamic global environment. This necessitates robust strategies to mitigate disruptions from port congestion, labor shortages, and natural disasters. Strategic partnerships and acquisitions within the sector underscore a trend towards consolidation and a continuous drive to scale operations to meet escalating demand.
Automotive 3PL Industry Company Market Share
Automotive 3PL Industry Market Report: 2019-2033
This comprehensive report provides an in-depth analysis of the Automotive 3PL industry, offering invaluable insights for industry professionals, investors, and strategic planners. With a study period spanning 2019-2033, a base year of 2025, and a forecast period of 2025-2033, this report utilizes extensive data and analysis to paint a clear picture of the market's current state and future trajectory. The global Automotive 3PL market is projected to reach $XX Million by 2033, exhibiting a robust CAGR of XX% during the forecast period.
Automotive 3PL Industry Market Structure & Innovation Trends
The Automotive 3PL market exhibits a moderately consolidated structure, with key players like DB Schenker, Tiba Group, Hellmann Worldwide Logistics, Nippon Express, DHL Group, XPO Logistics, CEVA Logistics, GEFCO, Kerry Logistics, and DSV holding significant market share. However, the market also features numerous smaller regional players. Market share data for 2024 indicates DB Schenker holds approximately XX% market share, followed by DHL Group at XX% and XPO Logistics at XX%. The remaining share is distributed among other players.
Innovation in the sector is driven by technological advancements such as automation, AI-powered logistics solutions, and blockchain technology for enhanced transparency and security. Stringent regulatory frameworks concerning emissions, safety, and data privacy significantly impact operations. Product substitutes, such as in-house logistics management, are limited due to the cost and expertise required. The automotive industry's demographic shifts, particularly towards electric vehicles and autonomous driving, influence the demand for specialized 3PL services. The period 2019-2024 witnessed significant M&A activity, with total deal values exceeding $XX Million. Notable examples include the CEVA Logistics acquisition of GEFCO in 2023.
- Market Concentration: Moderately Consolidated
- Key Players Market Share (2024): DB Schenker (XX%), DHL Group (XX%), XPO Logistics (XX%), Others (XX%)
- M&A Deal Value (2019-2024): $XX Million
Automotive 3PL Industry Market Dynamics & Trends
The Automotive 3PL market is experiencing substantial growth, propelled by several factors. The increasing complexity of global supply chains, the rising demand for just-in-time inventory management, and the growth of e-commerce are key drivers. Technological disruptions, such as the adoption of advanced analytics and automation, are transforming operational efficiency and cost-effectiveness. Consumer preferences for faster delivery times and increased transparency are influencing the demand for sophisticated 3PL solutions. Intense competition among existing players and the emergence of new entrants create a dynamic market landscape. The market's CAGR is projected to remain robust at XX% during 2025-2033, with market penetration expected to increase by XX% in key regions.
Dominant Regions & Segments in Automotive 3PL Industry
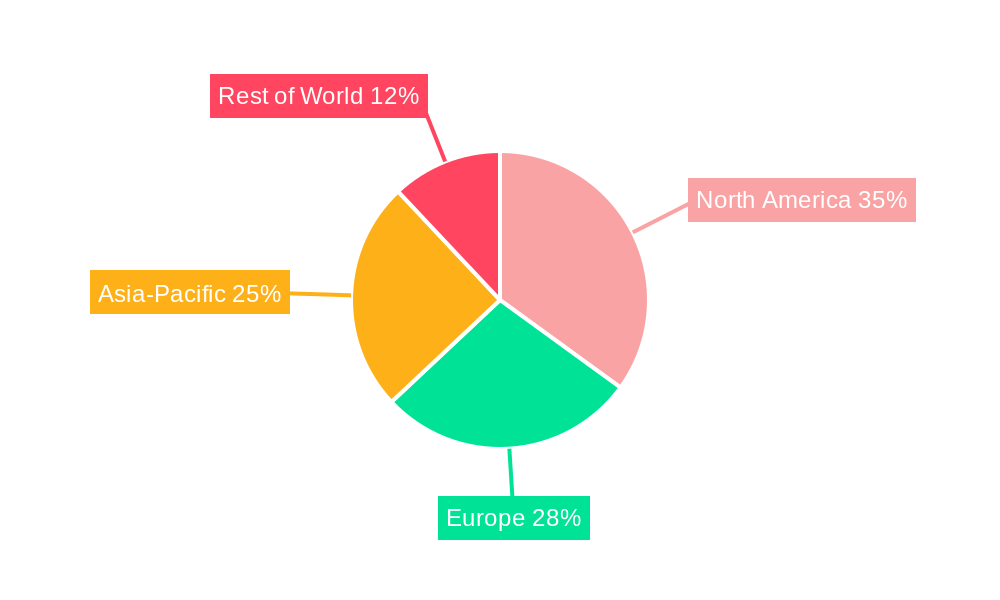
North America and Europe currently dominate the Automotive 3PL market, driven by robust automotive manufacturing industries and well-developed logistics infrastructure. However, the Asia-Pacific region is witnessing significant growth, propelled by rising vehicle production in countries like China and India. Within the segments, Finished Vehicle logistics commands a larger market share compared to Auto Component logistics, attributed to higher value and complexity. Transportation services currently hold the largest market share among service types, followed by warehousing and distribution, while inventory management is experiencing rapid growth.
Key Drivers:
North America: Strong automotive manufacturing base, advanced logistics infrastructure, high consumer demand.
Europe: Established automotive industry, efficient transportation networks, stringent regulations driving innovation.
Asia-Pacific: Rapid growth of automotive manufacturing, expanding middle class increasing demand, government support for infrastructure development.
Finished Vehicle: High value, complex logistics requirements.
Auto Components: Volume-driven, cost-sensitive logistics needs.
Transportation: Core service, high demand across all segments.
Warehousing: Essential for inventory management and distribution.
Distribution & Inventory Management: Growing demand due to evolving supply chain strategies.
Automotive 3PL Industry Product Innovations
Recent innovations focus on enhancing visibility, efficiency, and security throughout the supply chain. Technological advancements such as real-time tracking, predictive analytics, and automated warehousing systems are improving operational efficiency and reducing costs. The integration of blockchain technology enhances security and transparency, while the adoption of AI-powered solutions optimizes routes and improves decision-making. These innovations address the market's need for speed, reliability, and cost-effectiveness, resulting in improved customer satisfaction and competitive advantages.
Report Scope & Segmentation Analysis
This report covers the global Automotive 3PL market, segmented by region (North America, Mexico, South America, Rest of South America, Asia-Pacific, Rest of Asia-Pacific, Middle East and Africa, Rest of Middle East and Africa, Europe), by type (Finished Vehicle, Auto Component), and by service (Transportation, Warehousing, Distribution, Inventory Management). Each segment's growth projections, market size, and competitive dynamics are analyzed, offering a granular understanding of market opportunities. The report also includes detailed profiles of major players, evaluating their strategies, strengths, and weaknesses.
Key Drivers of Automotive 3PL Industry Growth
The Automotive 3PL industry’s growth is driven by several factors:
- Rising Global Vehicle Production: Increased demand for automobiles fuels the need for efficient logistics solutions.
- E-commerce Expansion: The growth of online car sales necessitates robust delivery and logistics networks.
- Technological Advancements: Automation and AI are improving efficiency and reducing costs.
- Just-in-Time Inventory Management: The need for timely delivery necessitates sophisticated 3PL solutions.
Challenges in the Automotive 3PL Industry Sector
The Automotive 3PL industry faces several challenges:
- Geopolitical Instability: International trade tensions and regional conflicts can disrupt supply chains.
- Supply Chain Disruptions: Unexpected events like pandemics or natural disasters can cause significant delays.
- Fluctuating Fuel Prices: Fuel costs represent a significant expense for transportation services.
- Driver Shortages: The industry faces a persistent shortage of qualified drivers.
Emerging Opportunities in Automotive 3PL Industry
Significant opportunities exist for growth and innovation within the Automotive 3PL market:
- Expansion into Emerging Markets: Growing economies in Asia and Africa offer considerable potential.
- Sustainable Logistics Solutions: Increasing focus on environmental concerns creates opportunities for green logistics.
- Last-Mile Delivery Optimization: Meeting the demands of e-commerce requires efficient last-mile delivery solutions.
- Specialized Services: Demand for niche services catering to electric vehicles and autonomous driving is increasing.
Leading Players in the Automotive 3PL Industry Market
- DB Schenker
- Tiba Group
- Hellmann Worldwide Logistics
- Nippon Express
- DHL Group
- XPO Logistics
- CEVA Logistics
- GEFCO
- Kerry Logistics
- DSV
Key Developments in Automotive 3PL Industry
- January 2023: CEVA Logistics acquires GEFCO, creating a significant player in finished vehicle logistics.
- October 2022: Red Arts Capital's Partners Warehouse acquires FLEX Logistics, expanding its West Coast warehousing and distribution capabilities.
Future Outlook for Automotive 3PL Industry Market
The Automotive 3PL market is poised for continued growth, driven by technological innovation, evolving consumer preferences, and the expansion of the global automotive industry. Strategic partnerships, investments in advanced technologies, and a focus on sustainable practices will be crucial for success. The market's future potential is significant, particularly in emerging markets and segments focused on specialized services.
Automotive 3PL Industry Segmentation
-
1. Type
- 1.1. Finished Vehicle
- 1.2. Auto Component
-
2. Service
- 2.1. Transportation
- 2.2. Warehous
Automotive 3PL Industry Segmentation By Geography
-
1. North America
- 1.1. United States
- 1.2. Canada
- 1.3. Mexico
-
2. South America
- 2.1. Brazil
- 2.2. Argentina
- 2.3. Rest of South America
-
3. Europe
- 3.1. United Kingdom
- 3.2. Germany
- 3.3. France
- 3.4. Italy
- 3.5. Spain
- 3.6. Russia
- 3.7. Benelux
- 3.8. Nordics
- 3.9. Rest of Europe
-
4. Middle East & Africa
- 4.1. Turkey
- 4.2. Israel
- 4.3. GCC
- 4.4. North Africa
- 4.5. South Africa
- 4.6. Rest of Middle East & Africa
-
5. Asia Pacific
- 5.1. China
- 5.2. India
- 5.3. Japan
- 5.4. South Korea
- 5.5. ASEAN
- 5.6. Oceania
- 5.7. Rest of Asia Pacific
Automotive 3PL Industry Regional Market Share
Geographic Coverage of Automotive 3PL Industry
Automotive 3PL Industry REPORT HIGHLIGHTS
| Aspects | Details |
|---|---|
| Study Period | 2020-2034 |
| Base Year | 2025 |
| Estimated Year | 2026 |
| Forecast Period | 2026-2034 |
| Historical Period | 2020-2025 |
| Growth Rate | CAGR of 9.1% from 2020-2034 |
| Segmentation |
|
Table of Contents
- 1. Introduction
- 1.1. Research Scope
- 1.2. Market Segmentation
- 1.3. Research Objective
- 1.4. Definitions and Assumptions
- 2. Executive Summary
- 2.1. Market Snapshot
- 3. Market Dynamics
- 3.1. Market Drivers
- 3.2. Market Restrains
- 3.3. Market Trends
- 3.4. Market Opportunities
- 4. Market Factor Analysis
- 4.1. Porters Five Forces
- 4.1.1. Bargaining Power of Suppliers
- 4.1.2. Bargaining Power of Buyers
- 4.1.3. Threat of New Entrants
- 4.1.4. Threat of Substitutes
- 4.1.5. Competitive Rivalry
- 4.2. PESTEL analysis
- 4.3. BCG Analysis
- 4.3.1. Stars (High Growth, High Market Share)
- 4.3.2. Cash Cows (Low Growth, High Market Share)
- 4.3.3. Question Mark (High Growth, Low Market Share)
- 4.3.4. Dogs (Low Growth, Low Market Share)
- 4.4. Ansoff Matrix Analysis
- 4.5. Supply Chain Analysis
- 4.6. Regulatory Landscape
- 4.7. Current Market Potential and Opportunity Assessment (TAM–SAM–SOM Framework)
- 4.8. PRI Analyst Note
- 4.1. Porters Five Forces
- 5. Market Analysis, Insights and Forecast 2021-2033
- 5.1. Market Analysis, Insights and Forecast - by Type
- 5.1.1. Finished Vehicle
- 5.1.2. Auto Component
- 5.2. Market Analysis, Insights and Forecast - by Service
- 5.2.1. Transportation
- 5.2.2. Warehous
- 5.3. Market Analysis, Insights and Forecast - by Region
- 5.3.1. North America
- 5.3.2. South America
- 5.3.3. Europe
- 5.3.4. Middle East & Africa
- 5.3.5. Asia Pacific
- 5.1. Market Analysis, Insights and Forecast - by Type
- 6. Global Automotive 3PL Industry Analysis, Insights and Forecast, 2021-2033
- 6.1. Market Analysis, Insights and Forecast - by Type
- 6.1.1. Finished Vehicle
- 6.1.2. Auto Component
- 6.2. Market Analysis, Insights and Forecast - by Service
- 6.2.1. Transportation
- 6.2.2. Warehous
- 6.1. Market Analysis, Insights and Forecast - by Type
- 7. North America Automotive 3PL Industry Analysis, Insights and Forecast, 2020-2032
- 7.1. Market Analysis, Insights and Forecast - by Type
- 7.1.1. Finished Vehicle
- 7.1.2. Auto Component
- 7.2. Market Analysis, Insights and Forecast - by Service
- 7.2.1. Transportation
- 7.2.2. Warehous
- 7.1. Market Analysis, Insights and Forecast - by Type
- 8. South America Automotive 3PL Industry Analysis, Insights and Forecast, 2020-2032
- 8.1. Market Analysis, Insights and Forecast - by Type
- 8.1.1. Finished Vehicle
- 8.1.2. Auto Component
- 8.2. Market Analysis, Insights and Forecast - by Service
- 8.2.1. Transportation
- 8.2.2. Warehous
- 8.1. Market Analysis, Insights and Forecast - by Type
- 9. Europe Automotive 3PL Industry Analysis, Insights and Forecast, 2020-2032
- 9.1. Market Analysis, Insights and Forecast - by Type
- 9.1.1. Finished Vehicle
- 9.1.2. Auto Component
- 9.2. Market Analysis, Insights and Forecast - by Service
- 9.2.1. Transportation
- 9.2.2. Warehous
- 9.1. Market Analysis, Insights and Forecast - by Type
- 10. Middle East & Africa Automotive 3PL Industry Analysis, Insights and Forecast, 2020-2032
- 10.1. Market Analysis, Insights and Forecast - by Type
- 10.1.1. Finished Vehicle
- 10.1.2. Auto Component
- 10.2. Market Analysis, Insights and Forecast - by Service
- 10.2.1. Transportation
- 10.2.2. Warehous
- 10.1. Market Analysis, Insights and Forecast - by Type
- 11. Asia Pacific Automotive 3PL Industry Analysis, Insights and Forecast, 2020-2032
- 11.1. Market Analysis, Insights and Forecast - by Type
- 11.1.1. Finished Vehicle
- 11.1.2. Auto Component
- 11.2. Market Analysis, Insights and Forecast - by Service
- 11.2.1. Transportation
- 11.2.2. Warehous
- 11.1. Market Analysis, Insights and Forecast - by Type
- 12. Competitive Analysis
- 12.1. Company Profiles
- 12.1.1 DB Schenker
- 12.1.1.1. Company Overview
- 12.1.1.2. Products
- 12.1.1.3. Company Financials
- 12.1.1.4. SWOT Analysis
- 12.1.2 Tiba Group
- 12.1.2.1. Company Overview
- 12.1.2.2. Products
- 12.1.2.3. Company Financials
- 12.1.2.4. SWOT Analysis
- 12.1.3 Hellmann Worldwide Logistics**List Not Exhaustive
- 12.1.3.1. Company Overview
- 12.1.3.2. Products
- 12.1.3.3. Company Financials
- 12.1.3.4. SWOT Analysis
- 12.1.4 Nippon Express
- 12.1.4.1. Company Overview
- 12.1.4.2. Products
- 12.1.4.3. Company Financials
- 12.1.4.4. SWOT Analysis
- 12.1.5 DHL Group
- 12.1.5.1. Company Overview
- 12.1.5.2. Products
- 12.1.5.3. Company Financials
- 12.1.5.4. SWOT Analysis
- 12.1.6 XPO Logistics
- 12.1.6.1. Company Overview
- 12.1.6.2. Products
- 12.1.6.3. Company Financials
- 12.1.6.4. SWOT Analysis
- 12.1.7 CEVA Logistics
- 12.1.7.1. Company Overview
- 12.1.7.2. Products
- 12.1.7.3. Company Financials
- 12.1.7.4. SWOT Analysis
- 12.1.8 GEFCO
- 12.1.8.1. Company Overview
- 12.1.8.2. Products
- 12.1.8.3. Company Financials
- 12.1.8.4. SWOT Analysis
- 12.1.9 Kerry Logistics
- 12.1.9.1. Company Overview
- 12.1.9.2. Products
- 12.1.9.3. Company Financials
- 12.1.9.4. SWOT Analysis
- 12.1.10 DSV
- 12.1.10.1. Company Overview
- 12.1.10.2. Products
- 12.1.10.3. Company Financials
- 12.1.10.4. SWOT Analysis
- 12.1.1 DB Schenker
- 12.2. Market Entropy
- 12.2.1 Company's Key Areas Served
- 12.2.2 Recent Developments
- 12.3. Company Market Share Analysis 2025
- 12.3.1 Top 5 Companies Market Share Analysis
- 12.3.2 Top 3 Companies Market Share Analysis
- 12.4. List of Potential Customers
- 13. Research Methodology
List of Figures
- Figure 1: Global Automotive 3PL Industry Revenue Breakdown (billion, %) by Region 2025 & 2033
- Figure 2: North America Automotive 3PL Industry Revenue (billion), by Type 2025 & 2033
- Figure 3: North America Automotive 3PL Industry Revenue Share (%), by Type 2025 & 2033
- Figure 4: North America Automotive 3PL Industry Revenue (billion), by Service 2025 & 2033
- Figure 5: North America Automotive 3PL Industry Revenue Share (%), by Service 2025 & 2033
- Figure 6: North America Automotive 3PL Industry Revenue (billion), by Country 2025 & 2033
- Figure 7: North America Automotive 3PL Industry Revenue Share (%), by Country 2025 & 2033
- Figure 8: South America Automotive 3PL Industry Revenue (billion), by Type 2025 & 2033
- Figure 9: South America Automotive 3PL Industry Revenue Share (%), by Type 2025 & 2033
- Figure 10: South America Automotive 3PL Industry Revenue (billion), by Service 2025 & 2033
- Figure 11: South America Automotive 3PL Industry Revenue Share (%), by Service 2025 & 2033
- Figure 12: South America Automotive 3PL Industry Revenue (billion), by Country 2025 & 2033
- Figure 13: South America Automotive 3PL Industry Revenue Share (%), by Country 2025 & 2033
- Figure 14: Europe Automotive 3PL Industry Revenue (billion), by Type 2025 & 2033
- Figure 15: Europe Automotive 3PL Industry Revenue Share (%), by Type 2025 & 2033
- Figure 16: Europe Automotive 3PL Industry Revenue (billion), by Service 2025 & 2033
- Figure 17: Europe Automotive 3PL Industry Revenue Share (%), by Service 2025 & 2033
- Figure 18: Europe Automotive 3PL Industry Revenue (billion), by Country 2025 & 2033
- Figure 19: Europe Automotive 3PL Industry Revenue Share (%), by Country 2025 & 2033
- Figure 20: Middle East & Africa Automotive 3PL Industry Revenue (billion), by Type 2025 & 2033
- Figure 21: Middle East & Africa Automotive 3PL Industry Revenue Share (%), by Type 2025 & 2033
- Figure 22: Middle East & Africa Automotive 3PL Industry Revenue (billion), by Service 2025 & 2033
- Figure 23: Middle East & Africa Automotive 3PL Industry Revenue Share (%), by Service 2025 & 2033
- Figure 24: Middle East & Africa Automotive 3PL Industry Revenue (billion), by Country 2025 & 2033
- Figure 25: Middle East & Africa Automotive 3PL Industry Revenue Share (%), by Country 2025 & 2033
- Figure 26: Asia Pacific Automotive 3PL Industry Revenue (billion), by Type 2025 & 2033
- Figure 27: Asia Pacific Automotive 3PL Industry Revenue Share (%), by Type 2025 & 2033
- Figure 28: Asia Pacific Automotive 3PL Industry Revenue (billion), by Service 2025 & 2033
- Figure 29: Asia Pacific Automotive 3PL Industry Revenue Share (%), by Service 2025 & 2033
- Figure 30: Asia Pacific Automotive 3PL Industry Revenue (billion), by Country 2025 & 2033
- Figure 31: Asia Pacific Automotive 3PL Industry Revenue Share (%), by Country 2025 & 2033
List of Tables
- Table 1: Global Automotive 3PL Industry Revenue billion Forecast, by Type 2020 & 2033
- Table 2: Global Automotive 3PL Industry Revenue billion Forecast, by Service 2020 & 2033
- Table 3: Global Automotive 3PL Industry Revenue billion Forecast, by Region 2020 & 2033
- Table 4: Global Automotive 3PL Industry Revenue billion Forecast, by Type 2020 & 2033
- Table 5: Global Automotive 3PL Industry Revenue billion Forecast, by Service 2020 & 2033
- Table 6: Global Automotive 3PL Industry Revenue billion Forecast, by Country 2020 & 2033
- Table 7: United States Automotive 3PL Industry Revenue (billion) Forecast, by Application 2020 & 2033
- Table 8: Canada Automotive 3PL Industry Revenue (billion) Forecast, by Application 2020 & 2033
- Table 9: Mexico Automotive 3PL Industry Revenue (billion) Forecast, by Application 2020 & 2033
- Table 10: Global Automotive 3PL Industry Revenue billion Forecast, by Type 2020 & 2033
- Table 11: Global Automotive 3PL Industry Revenue billion Forecast, by Service 2020 & 2033
- Table 12: Global Automotive 3PL Industry Revenue billion Forecast, by Country 2020 & 2033
- Table 13: Brazil Automotive 3PL Industry Revenue (billion) Forecast, by Application 2020 & 2033
- Table 14: Argentina Automotive 3PL Industry Revenue (billion) Forecast, by Application 2020 & 2033
- Table 15: Rest of South America Automotive 3PL Industry Revenue (billion) Forecast, by Application 2020 & 2033
- Table 16: Global Automotive 3PL Industry Revenue billion Forecast, by Type 2020 & 2033
- Table 17: Global Automotive 3PL Industry Revenue billion Forecast, by Service 2020 & 2033
- Table 18: Global Automotive 3PL Industry Revenue billion Forecast, by Country 2020 & 2033
- Table 19: United Kingdom Automotive 3PL Industry Revenue (billion) Forecast, by Application 2020 & 2033
- Table 20: Germany Automotive 3PL Industry Revenue (billion) Forecast, by Application 2020 & 2033
- Table 21: France Automotive 3PL Industry Revenue (billion) Forecast, by Application 2020 & 2033
- Table 22: Italy Automotive 3PL Industry Revenue (billion) Forecast, by Application 2020 & 2033
- Table 23: Spain Automotive 3PL Industry Revenue (billion) Forecast, by Application 2020 & 2033
- Table 24: Russia Automotive 3PL Industry Revenue (billion) Forecast, by Application 2020 & 2033
- Table 25: Benelux Automotive 3PL Industry Revenue (billion) Forecast, by Application 2020 & 2033
- Table 26: Nordics Automotive 3PL Industry Revenue (billion) Forecast, by Application 2020 & 2033
- Table 27: Rest of Europe Automotive 3PL Industry Revenue (billion) Forecast, by Application 2020 & 2033
- Table 28: Global Automotive 3PL Industry Revenue billion Forecast, by Type 2020 & 2033
- Table 29: Global Automotive 3PL Industry Revenue billion Forecast, by Service 2020 & 2033
- Table 30: Global Automotive 3PL Industry Revenue billion Forecast, by Country 2020 & 2033
- Table 31: Turkey Automotive 3PL Industry Revenue (billion) Forecast, by Application 2020 & 2033
- Table 32: Israel Automotive 3PL Industry Revenue (billion) Forecast, by Application 2020 & 2033
- Table 33: GCC Automotive 3PL Industry Revenue (billion) Forecast, by Application 2020 & 2033
- Table 34: North Africa Automotive 3PL Industry Revenue (billion) Forecast, by Application 2020 & 2033
- Table 35: South Africa Automotive 3PL Industry Revenue (billion) Forecast, by Application 2020 & 2033
- Table 36: Rest of Middle East & Africa Automotive 3PL Industry Revenue (billion) Forecast, by Application 2020 & 2033
- Table 37: Global Automotive 3PL Industry Revenue billion Forecast, by Type 2020 & 2033
- Table 38: Global Automotive 3PL Industry Revenue billion Forecast, by Service 2020 & 2033
- Table 39: Global Automotive 3PL Industry Revenue billion Forecast, by Country 2020 & 2033
- Table 40: China Automotive 3PL Industry Revenue (billion) Forecast, by Application 2020 & 2033
- Table 41: India Automotive 3PL Industry Revenue (billion) Forecast, by Application 2020 & 2033
- Table 42: Japan Automotive 3PL Industry Revenue (billion) Forecast, by Application 2020 & 2033
- Table 43: South Korea Automotive 3PL Industry Revenue (billion) Forecast, by Application 2020 & 2033
- Table 44: ASEAN Automotive 3PL Industry Revenue (billion) Forecast, by Application 2020 & 2033
- Table 45: Oceania Automotive 3PL Industry Revenue (billion) Forecast, by Application 2020 & 2033
- Table 46: Rest of Asia Pacific Automotive 3PL Industry Revenue (billion) Forecast, by Application 2020 & 2033
Frequently Asked Questions
1. What is the projected Compound Annual Growth Rate (CAGR) of the Automotive 3PL Industry?
The projected CAGR is approximately 9.1%.
2. Which companies are prominent players in the Automotive 3PL Industry?
Key companies in the market include DB Schenker, Tiba Group, Hellmann Worldwide Logistics**List Not Exhaustive, Nippon Express, DHL Group, XPO Logistics, CEVA Logistics, GEFCO, Kerry Logistics, DSV.
3. What are the main segments of the Automotive 3PL Industry?
The market segments include Type, Service.
4. Can you provide details about the market size?
The market size is estimated to be USD 1260.98 billion as of 2022.
5. What are some drivers contributing to market growth?
Pharmaceutical Industry Demands Advanced Cold-Chain Services; E-commerce driving the cold chain logistics.
6. What are the notable trends driving market growth?
Increasing partnerships between automotive manufacturers and logistics companies.
7. Are there any restraints impacting market growth?
Damaged Goods; Increasing Transportation Cost.
8. Can you provide examples of recent developments in the market?
January 2023: CEVA Logistics, a member of the CMA CGM group, has successfully acquired GEFCO. As part of this adjustment and its merger with GEFCO, CEVA Logistics has announced the formation of a specific finished vehicle logistics organization.
9. What pricing options are available for accessing the report?
Pricing options include single-user, multi-user, and enterprise licenses priced at USD 3800, USD 4500, and USD 5800 respectively.
10. Is the market size provided in terms of value or volume?
The market size is provided in terms of value, measured in billion.
11. Are there any specific market keywords associated with the report?
Yes, the market keyword associated with the report is "Automotive 3PL Industry," which aids in identifying and referencing the specific market segment covered.
12. How do I determine which pricing option suits my needs best?
The pricing options vary based on user requirements and access needs. Individual users may opt for single-user licenses, while businesses requiring broader access may choose multi-user or enterprise licenses for cost-effective access to the report.
13. Are there any additional resources or data provided in the Automotive 3PL Industry report?
While the report offers comprehensive insights, it's advisable to review the specific contents or supplementary materials provided to ascertain if additional resources or data are available.
14. How can I stay updated on further developments or reports in the Automotive 3PL Industry?
To stay informed about further developments, trends, and reports in the Automotive 3PL Industry, consider subscribing to industry newsletters, following relevant companies and organizations, or regularly checking reputable industry news sources and publications.
Methodology
Step 1 - Identification of Relevant Samples Size from Population Database


Step 2 - Approaches for Defining Global Market Size (Value, Volume* & Price*)

Note*: In applicable scenarios
Step 3 - Data Sources
Primary Research
- Web Analytics
- Survey Reports
- Research Institute
- Latest Research Reports
- Opinion Leaders
Secondary Research
- Annual Reports
- White Paper
- Latest Press Release
- Industry Association
- Paid Database
- Investor Presentations

Step 4 - Data Triangulation
Involves using different sources of information in order to increase the validity of a study
These sources are likely to be stakeholders in a program - participants, other researchers, program staff, other community members, and so on.
Then we put all data in single framework & apply various statistical tools to find out the dynamic on the market.
During the analysis stage, feedback from the stakeholder groups would be compared to determine areas of agreement as well as areas of divergence