

Key Insights
The automotive e-tailing market is experiencing significant expansion, driven by escalating e-commerce adoption, consumer convenience, and the growing reach of online platforms. This dynamic sector is projected to achieve a compound annual growth rate (CAGR) of 14.2% from a market size of $17.1 billion in the base year 2025, indicating substantial future growth. Key drivers include the increasing preference for online purchasing among younger demographics, the widespread availability of smartphones and high-speed internet, and a continuously expanding selection of automotive parts and accessories online. The rise of direct-to-consumer (DTC) sales by Original Equipment Manufacturers (OEMs) further accelerates this market trajectory. The market is segmented by component type (e.g., electrical, infotainment, engine, tires), vehicle type (passenger cars, commercial vehicles, two-wheelers), and vendor type (OEMs and third-party vendors). Geographically, North America and Asia-Pacific currently lead, supported by high vehicle ownership and robust e-commerce infrastructure, with Europe also demonstrating strong performance.
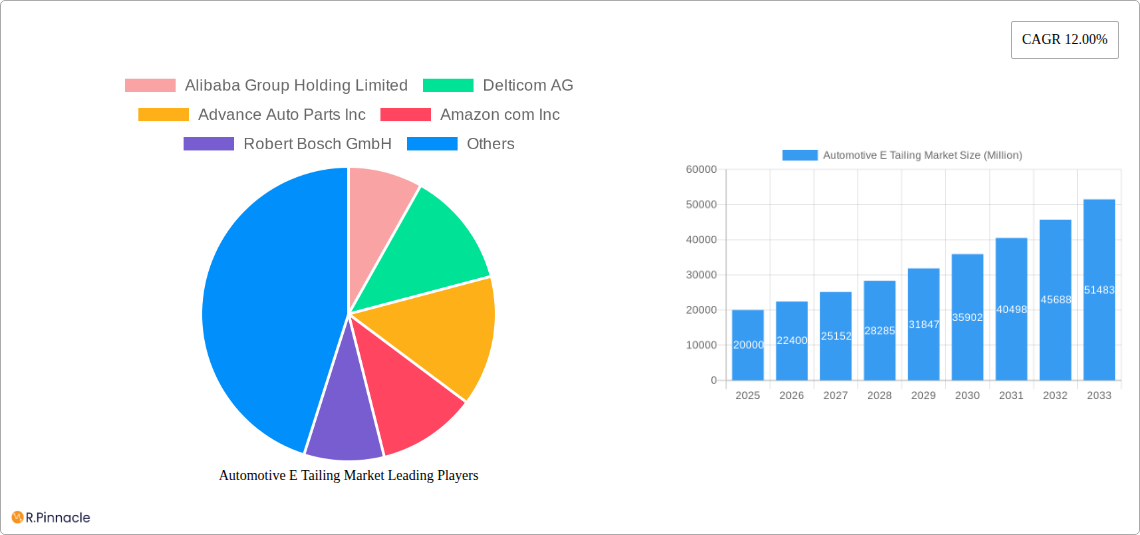
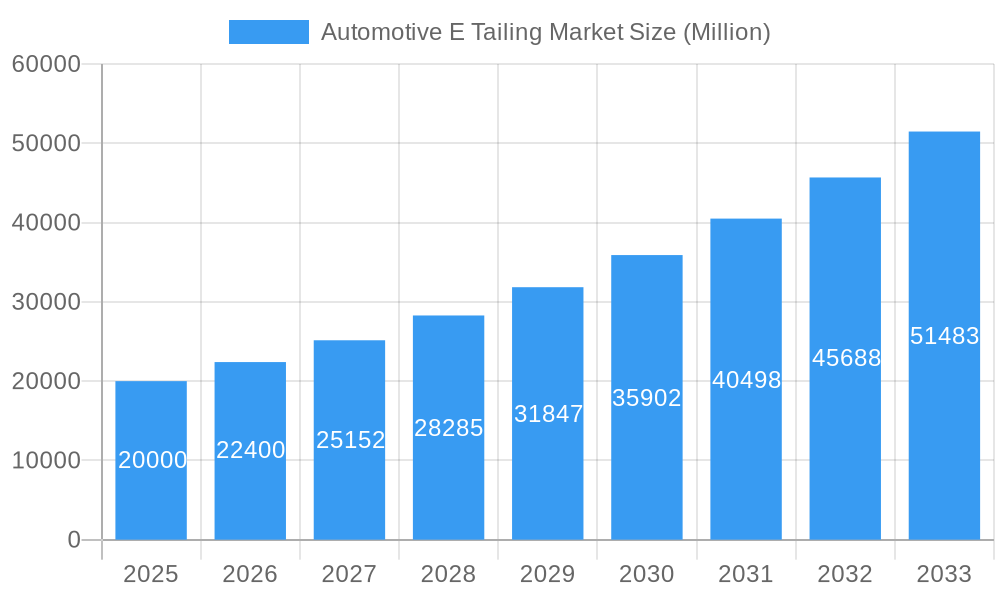
Automotive E Tailing Market Market Size (In Billion)
Despite the positive outlook, logistical complexities for bulky items like tires and engine components present notable challenges. Effective customer service and transparent return policies are crucial for addressing consumer concerns related to online purchases. The prevalence of counterfeit parts and evolving security concerns also pose risks for both consumers and vendors. Nevertheless, the long-term forecast for automotive e-tailing remains highly optimistic, with advancements in e-commerce logistics and the persistent shift towards online shopping expected to fuel continued expansion. Developing economies, with their rising vehicle ownership and internet penetration, represent significant growth opportunities. Intensifying competition among established players such as Amazon, Alibaba, and specialized automotive retailers is anticipated to drive innovation, leading to more competitive pricing and an even wider array of product offerings for consumers.
Automotive E Tailing Market Company Market Share
Automotive E-Tailing Market Report: 2019-2033
This comprehensive report provides a detailed analysis of the Automotive E-Tailing Market, offering valuable insights for industry professionals, investors, and strategic decision-makers. Covering the period from 2019 to 2033, with a focus on 2025, this report examines market dynamics, key players, and future growth potential. The market is segmented by component type, vehicle type, and vendor type, providing granular data for informed business strategies. The report also analyzes key industry developments, highlighting recent partnerships and market expansions. Expect detailed analysis of market size (in Millions), CAGR, and market penetration across various segments and regions.
Automotive E-Tailing Market Market Structure & Innovation Trends
The automotive e-tailing market exhibits a moderately concentrated structure, with key players like Alibaba Group Holding Limited, Amazon.com Inc, and Walmart Inc. holding significant market share (exact figures detailed in the full report). However, the market is also characterized by the presence of numerous smaller, specialized players, particularly in niche segments like specialized parts or regional markets. Innovation is driven by advancements in e-commerce technologies, including AI-powered recommendation engines, improved logistics and delivery systems, and the integration of augmented reality (AR) for product visualization. Regulatory frameworks, such as data privacy regulations and consumer protection laws, significantly influence market operations. Product substitutes, such as traditional brick-and-mortar auto parts stores, continue to compete, albeit with decreasing market share. End-user demographics are diverse, spanning DIY enthusiasts, professional mechanics, and businesses. M&A activity has been moderate, with deal values ranging from xx Million to xx Million (specific deals and values detailed within the report).
- Market Concentration: Moderately concentrated, with several dominant players and numerous smaller competitors.
- Innovation Drivers: AI, AR, improved logistics, e-commerce platform enhancements.
- Regulatory Frameworks: Data privacy, consumer protection laws.
- Product Substitutes: Traditional brick-and-mortar stores.
- End-User Demographics: DIY enthusiasts, professionals, businesses.
- M&A Activity: Moderate activity, with deal values ranging from xx Million to xx Million.
Automotive E-Tailing Market Market Dynamics & Trends
The automotive e-tailing market is experiencing robust growth, driven by the increasing adoption of online shopping, the rising popularity of DIY car maintenance, and the expansion of e-commerce infrastructure globally. Technological disruptions, such as the integration of blockchain technology for supply chain transparency and the use of big data analytics for personalized marketing, are further shaping market dynamics. Consumer preferences are shifting towards convenient online purchasing, personalized recommendations, and fast, reliable delivery. Competitive dynamics are intense, with established e-commerce giants competing with specialized auto parts retailers and emerging players. The market is expected to witness a CAGR of xx% during the forecast period (2025-2033), with market penetration increasing significantly in developing economies.
Dominant Regions & Segments in Automotive E-Tailing Market
Leading Region: North America currently dominates the market, followed by Asia-Pacific. This dominance is attributed to factors such as high internet penetration, strong e-commerce infrastructure, and a large base of vehicle owners. However, Asia-Pacific is expected to experience significant growth due to the rising middle class and increasing vehicle ownership. Europe is also a key region.
Leading Segment (By Component Type): Electrical Components hold the largest market share due to high demand and increasing vehicle electrification. Tires and Wheels are another significant segment.
Leading Segment (By Vehicle Type): Passenger cars dominate the market share, driven by high vehicle ownership, however, the commercial vehicles segment is also exhibiting strong growth potential.
Leading Segment (By Vendor Type): Third-party vendors currently hold a larger market share due to their wider product range and reach.
Key Drivers (by region):
- North America: Strong e-commerce infrastructure, high internet penetration, large vehicle ownership.
- Asia-Pacific: Rising middle class, increasing vehicle ownership, growing e-commerce adoption.
- Europe: Established e-commerce markets, high consumer spending.
Automotive E-Tailing Market Product Innovations
Recent innovations in the automotive e-tailing market include the use of AI-powered chatbots for customer service, virtual reality (VR) for product visualization, and drone delivery for faster shipping. These innovations enhance the customer experience, improve operational efficiency, and create competitive advantages for businesses. Market fit for these innovations is strong, as consumers increasingly demand seamless and personalized online shopping experiences.
Report Scope & Segmentation Analysis
This report segments the automotive e-tailing market by:
Component Type: Electrical Components, Infotainment and Multimedia, Engine Components, Tires and Wheels, Other Component Types (each segment’s market size, growth projections, and competitive dynamics are detailed in the full report).
Vehicle Type: Passenger Cars, Commercial Vehicles, Two-wheelers (each segment’s market size, growth projections, and competitive dynamics are detailed in the full report).
Vendor Type: OEM, Third-party Vendor (each segment’s market size, growth projections, and competitive dynamics are detailed in the full report).
Key Drivers of Automotive E-Tailing Market Growth
The growth of the automotive e-tailing market is fueled by several factors: the rising adoption of e-commerce, increased vehicle ownership globally, the growing popularity of DIY car maintenance, and advancements in technology such as AI and AR. Government initiatives promoting digitalization and favorable economic conditions in several regions also contribute significantly.
Challenges in the Automotive E-Tailing Market Sector
Challenges faced by the automotive e-tailing market include the complexities of logistics and delivery of bulky automotive parts, concerns about counterfeit products, and the need to address cyber security risks. The need for significant investment in technology and logistics and intense competition from established players and new entrants also pose significant hurdles.
Emerging Opportunities in Automotive E-Tailing Market
Emerging opportunities include the expansion into new markets, particularly in developing economies, the integration of IoT and telematics in the automotive e-tailing ecosystem, and the development of subscription-based services for auto parts. The use of data analytics for personalized marketing and the growth of electric vehicles also represent significant opportunities.
Leading Players in the Automotive E-Tailing Market Market
Key Developments in Automotive E-Tailing Market Industry
- February 2021: CarParts.com partnered with McDowell and Front Row Motorsports (FRM) for increased brand engagement.
- February 2021: Advance Auto Parts partnered with NASCAR and Team Penske for marketing and brand visibility.
- November 2021: Advance Auto Parts launched Carquest by Advance, targeting DIY automotive repair.
- December 2021: Alibaba Group Holding Ltd. reorganized its e-commerce businesses for accelerated growth.
Future Outlook for Automotive E-Tailing Market Market
The automotive e-tailing market is poised for continued growth, driven by technological advancements, increasing e-commerce adoption, and the expansion of the global vehicle market. Strategic partnerships, investments in logistics and technology, and a focus on customer experience will be key to success in this dynamic market. New business models, such as subscription services and personalized maintenance packages, are also expected to gain traction.
Automotive E Tailing Market Segmentation
-
1. Component Type
- 1.1. Electrical Components
- 1.2. Infotainment and Multimedia
- 1.3. Engine Components
- 1.4. Tires and Wheel
- 1.5. Other Component Types
-
2. Vehicle Type
- 2.1. Passenger Cars
- 2.2. Commercial Vehicles
- 2.3. Two-wheelers
-
3. Vendor Type
- 3.1. OEM
- 3.2. Third-party Vendor
Automotive E Tailing Market Segmentation By Geography
-
1. North America
- 1.1. United States
- 1.2. Canada
- 1.3. Rest of North America
-
2. Europe
- 2.1. Germany
- 2.2. United Kingdom
- 2.3. France
- 2.4. Italy
- 2.5. Rest of Europe
-
3. Asia Pacific
- 3.1. India
- 3.2. China
- 3.3. Japan
- 3.4. South Korea
- 3.5. Rest of Asia Pacific
-
4. Rest of the World
- 4.1. South America
- 4.2. Middle East and Africa
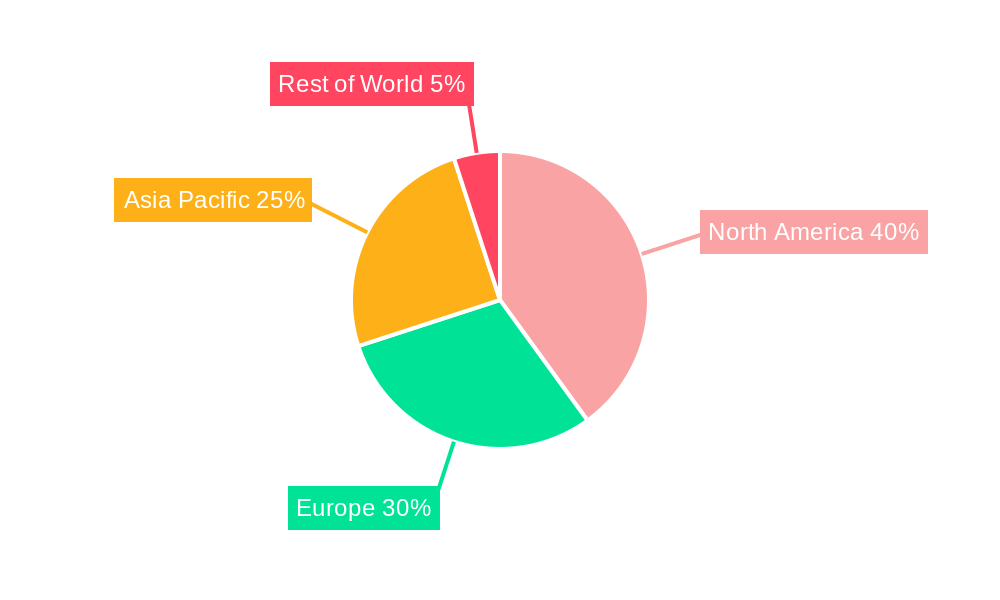
Automotive E Tailing Market Regional Market Share
Geographic Coverage of Automotive E Tailing Market
Automotive E Tailing Market REPORT HIGHLIGHTS
| Aspects | Details |
|---|---|
| Study Period | 2020-2034 |
| Base Year | 2025 |
| Estimated Year | 2026 |
| Forecast Period | 2026-2034 |
| Historical Period | 2020-2025 |
| Growth Rate | CAGR of 14.2% from 2020-2034 |
| Segmentation |
|
Table of Contents
- 1. Introduction
- 1.1. Research Scope
- 1.2. Market Segmentation
- 1.3. Research Objective
- 1.4. Definitions and Assumptions
- 2. Executive Summary
- 2.1. Market Snapshot
- 3. Market Dynamics
- 3.1. Market Drivers
- 3.2. Market Restrains
- 3.3. Market Trends
- 3.4. Market Opportunities
- 4. Market Factor Analysis
- 4.1. Porters Five Forces
- 4.1.1. Bargaining Power of Suppliers
- 4.1.2. Bargaining Power of Buyers
- 4.1.3. Threat of New Entrants
- 4.1.4. Threat of Substitutes
- 4.1.5. Competitive Rivalry
- 4.2. PESTEL analysis
- 4.3. BCG Analysis
- 4.3.1. Stars (High Growth, High Market Share)
- 4.3.2. Cash Cows (Low Growth, High Market Share)
- 4.3.3. Question Mark (High Growth, Low Market Share)
- 4.3.4. Dogs (Low Growth, Low Market Share)
- 4.4. Ansoff Matrix Analysis
- 4.5. Supply Chain Analysis
- 4.6. Regulatory Landscape
- 4.7. Current Market Potential and Opportunity Assessment (TAM–SAM–SOM Framework)
- 4.8. PRI Analyst Note
- 4.1. Porters Five Forces
- 5. Market Analysis, Insights and Forecast 2021-2033
- 5.1. Market Analysis, Insights and Forecast - by Component Type
- 5.1.1. Electrical Components
- 5.1.2. Infotainment and Multimedia
- 5.1.3. Engine Components
- 5.1.4. Tires and Wheel
- 5.1.5. Other Component Types
- 5.2. Market Analysis, Insights and Forecast - by Vehicle Type
- 5.2.1. Passenger Cars
- 5.2.2. Commercial Vehicles
- 5.2.3. Two-wheelers
- 5.3. Market Analysis, Insights and Forecast - by Vendor Type
- 5.3.1. OEM
- 5.3.2. Third-party Vendor
- 5.4. Market Analysis, Insights and Forecast - by Region
- 5.4.1. North America
- 5.4.2. Europe
- 5.4.3. Asia Pacific
- 5.4.4. Rest of the World
- 5.1. Market Analysis, Insights and Forecast - by Component Type
- 6. Global Automotive E Tailing Market Analysis, Insights and Forecast, 2021-2033
- 6.1. Market Analysis, Insights and Forecast - by Component Type
- 6.1.1. Electrical Components
- 6.1.2. Infotainment and Multimedia
- 6.1.3. Engine Components
- 6.1.4. Tires and Wheel
- 6.1.5. Other Component Types
- 6.2. Market Analysis, Insights and Forecast - by Vehicle Type
- 6.2.1. Passenger Cars
- 6.2.2. Commercial Vehicles
- 6.2.3. Two-wheelers
- 6.3. Market Analysis, Insights and Forecast - by Vendor Type
- 6.3.1. OEM
- 6.3.2. Third-party Vendor
- 6.1. Market Analysis, Insights and Forecast - by Component Type
- 7. North America Automotive E Tailing Market Analysis, Insights and Forecast, 2020-2032
- 7.1. Market Analysis, Insights and Forecast - by Component Type
- 7.1.1. Electrical Components
- 7.1.2. Infotainment and Multimedia
- 7.1.3. Engine Components
- 7.1.4. Tires and Wheel
- 7.1.5. Other Component Types
- 7.2. Market Analysis, Insights and Forecast - by Vehicle Type
- 7.2.1. Passenger Cars
- 7.2.2. Commercial Vehicles
- 7.2.3. Two-wheelers
- 7.3. Market Analysis, Insights and Forecast - by Vendor Type
- 7.3.1. OEM
- 7.3.2. Third-party Vendor
- 7.1. Market Analysis, Insights and Forecast - by Component Type
- 8. Europe Automotive E Tailing Market Analysis, Insights and Forecast, 2020-2032
- 8.1. Market Analysis, Insights and Forecast - by Component Type
- 8.1.1. Electrical Components
- 8.1.2. Infotainment and Multimedia
- 8.1.3. Engine Components
- 8.1.4. Tires and Wheel
- 8.1.5. Other Component Types
- 8.2. Market Analysis, Insights and Forecast - by Vehicle Type
- 8.2.1. Passenger Cars
- 8.2.2. Commercial Vehicles
- 8.2.3. Two-wheelers
- 8.3. Market Analysis, Insights and Forecast - by Vendor Type
- 8.3.1. OEM
- 8.3.2. Third-party Vendor
- 8.1. Market Analysis, Insights and Forecast - by Component Type
- 9. Asia Pacific Automotive E Tailing Market Analysis, Insights and Forecast, 2020-2032
- 9.1. Market Analysis, Insights and Forecast - by Component Type
- 9.1.1. Electrical Components
- 9.1.2. Infotainment and Multimedia
- 9.1.3. Engine Components
- 9.1.4. Tires and Wheel
- 9.1.5. Other Component Types
- 9.2. Market Analysis, Insights and Forecast - by Vehicle Type
- 9.2.1. Passenger Cars
- 9.2.2. Commercial Vehicles
- 9.2.3. Two-wheelers
- 9.3. Market Analysis, Insights and Forecast - by Vendor Type
- 9.3.1. OEM
- 9.3.2. Third-party Vendor
- 9.1. Market Analysis, Insights and Forecast - by Component Type
- 10. Rest of the World Automotive E Tailing Market Analysis, Insights and Forecast, 2020-2032
- 10.1. Market Analysis, Insights and Forecast - by Component Type
- 10.1.1. Electrical Components
- 10.1.2. Infotainment and Multimedia
- 10.1.3. Engine Components
- 10.1.4. Tires and Wheel
- 10.1.5. Other Component Types
- 10.2. Market Analysis, Insights and Forecast - by Vehicle Type
- 10.2.1. Passenger Cars
- 10.2.2. Commercial Vehicles
- 10.2.3. Two-wheelers
- 10.3. Market Analysis, Insights and Forecast - by Vendor Type
- 10.3.1. OEM
- 10.3.2. Third-party Vendor
- 10.1. Market Analysis, Insights and Forecast - by Component Type
- 11. Competitive Analysis
- 11.1. Company Profiles
- 11.1.1 Alibaba Group Holding Limited
- 11.1.1.1. Company Overview
- 11.1.1.2. Products
- 11.1.1.3. Company Financials
- 11.1.1.4. SWOT Analysis
- 11.1.2 Delticom AG
- 11.1.2.1. Company Overview
- 11.1.2.2. Products
- 11.1.2.3. Company Financials
- 11.1.2.4. SWOT Analysis
- 11.1.3 Advance Auto Parts Inc
- 11.1.3.1. Company Overview
- 11.1.3.2. Products
- 11.1.3.3. Company Financials
- 11.1.3.4. SWOT Analysis
- 11.1.4 Amazon com Inc
- 11.1.4.1. Company Overview
- 11.1.4.2. Products
- 11.1.4.3. Company Financials
- 11.1.4.4. SWOT Analysis
- 11.1.5 Robert Bosch GmbH
- 11.1.5.1. Company Overview
- 11.1.5.2. Products
- 11.1.5.3. Company Financials
- 11.1.5.4. SWOT Analysis
- 11.1.6 AutoZone Inc
- 11.1.6.1. Company Overview
- 11.1.6.2. Products
- 11.1.6.3. Company Financials
- 11.1.6.4. SWOT Analysis
- 11.1.7 Flipkart*List Not Exhaustive
- 11.1.7.1. Company Overview
- 11.1.7.2. Products
- 11.1.7.3. Company Financials
- 11.1.7.4. SWOT Analysis
- 11.1.8 eBay Inc
- 11.1.8.1. Company Overview
- 11.1.8.2. Products
- 11.1.8.3. Company Financials
- 11.1.8.4. SWOT Analysis
- 11.1.9 O'reilly Automotive Inc
- 11.1.9.1. Company Overview
- 11.1.9.2. Products
- 11.1.9.3. Company Financials
- 11.1.9.4. SWOT Analysis
- 11.1.10 Walmart Inc
- 11.1.10.1. Company Overview
- 11.1.10.2. Products
- 11.1.10.3. Company Financials
- 11.1.10.4. SWOT Analysis
- 11.1.1 Alibaba Group Holding Limited
- 11.2. Market Entropy
- 11.2.1 Company's Key Areas Served
- 11.2.2 Recent Developments
- 11.3. Company Market Share Analysis 2025
- 11.3.1 Top 5 Companies Market Share Analysis
- 11.3.2 Top 3 Companies Market Share Analysis
- 11.4. List of Potential Customers
- 12. Research Methodology
List of Figures
- Figure 1: Global Automotive E Tailing Market Revenue Breakdown (billion, %) by Region 2025 & 2033
- Figure 2: North America Automotive E Tailing Market Revenue (billion), by Component Type 2025 & 2033
- Figure 3: North America Automotive E Tailing Market Revenue Share (%), by Component Type 2025 & 2033
- Figure 4: North America Automotive E Tailing Market Revenue (billion), by Vehicle Type 2025 & 2033
- Figure 5: North America Automotive E Tailing Market Revenue Share (%), by Vehicle Type 2025 & 2033
- Figure 6: North America Automotive E Tailing Market Revenue (billion), by Vendor Type 2025 & 2033
- Figure 7: North America Automotive E Tailing Market Revenue Share (%), by Vendor Type 2025 & 2033
- Figure 8: North America Automotive E Tailing Market Revenue (billion), by Country 2025 & 2033
- Figure 9: North America Automotive E Tailing Market Revenue Share (%), by Country 2025 & 2033
- Figure 10: Europe Automotive E Tailing Market Revenue (billion), by Component Type 2025 & 2033
- Figure 11: Europe Automotive E Tailing Market Revenue Share (%), by Component Type 2025 & 2033
- Figure 12: Europe Automotive E Tailing Market Revenue (billion), by Vehicle Type 2025 & 2033
- Figure 13: Europe Automotive E Tailing Market Revenue Share (%), by Vehicle Type 2025 & 2033
- Figure 14: Europe Automotive E Tailing Market Revenue (billion), by Vendor Type 2025 & 2033
- Figure 15: Europe Automotive E Tailing Market Revenue Share (%), by Vendor Type 2025 & 2033
- Figure 16: Europe Automotive E Tailing Market Revenue (billion), by Country 2025 & 2033
- Figure 17: Europe Automotive E Tailing Market Revenue Share (%), by Country 2025 & 2033
- Figure 18: Asia Pacific Automotive E Tailing Market Revenue (billion), by Component Type 2025 & 2033
- Figure 19: Asia Pacific Automotive E Tailing Market Revenue Share (%), by Component Type 2025 & 2033
- Figure 20: Asia Pacific Automotive E Tailing Market Revenue (billion), by Vehicle Type 2025 & 2033
- Figure 21: Asia Pacific Automotive E Tailing Market Revenue Share (%), by Vehicle Type 2025 & 2033
- Figure 22: Asia Pacific Automotive E Tailing Market Revenue (billion), by Vendor Type 2025 & 2033
- Figure 23: Asia Pacific Automotive E Tailing Market Revenue Share (%), by Vendor Type 2025 & 2033
- Figure 24: Asia Pacific Automotive E Tailing Market Revenue (billion), by Country 2025 & 2033
- Figure 25: Asia Pacific Automotive E Tailing Market Revenue Share (%), by Country 2025 & 2033
- Figure 26: Rest of the World Automotive E Tailing Market Revenue (billion), by Component Type 2025 & 2033
- Figure 27: Rest of the World Automotive E Tailing Market Revenue Share (%), by Component Type 2025 & 2033
- Figure 28: Rest of the World Automotive E Tailing Market Revenue (billion), by Vehicle Type 2025 & 2033
- Figure 29: Rest of the World Automotive E Tailing Market Revenue Share (%), by Vehicle Type 2025 & 2033
- Figure 30: Rest of the World Automotive E Tailing Market Revenue (billion), by Vendor Type 2025 & 2033
- Figure 31: Rest of the World Automotive E Tailing Market Revenue Share (%), by Vendor Type 2025 & 2033
- Figure 32: Rest of the World Automotive E Tailing Market Revenue (billion), by Country 2025 & 2033
- Figure 33: Rest of the World Automotive E Tailing Market Revenue Share (%), by Country 2025 & 2033
List of Tables
- Table 1: Global Automotive E Tailing Market Revenue billion Forecast, by Component Type 2020 & 2033
- Table 2: Global Automotive E Tailing Market Revenue billion Forecast, by Vehicle Type 2020 & 2033
- Table 3: Global Automotive E Tailing Market Revenue billion Forecast, by Vendor Type 2020 & 2033
- Table 4: Global Automotive E Tailing Market Revenue billion Forecast, by Region 2020 & 2033
- Table 5: Global Automotive E Tailing Market Revenue billion Forecast, by Component Type 2020 & 2033
- Table 6: Global Automotive E Tailing Market Revenue billion Forecast, by Vehicle Type 2020 & 2033
- Table 7: Global Automotive E Tailing Market Revenue billion Forecast, by Vendor Type 2020 & 2033
- Table 8: Global Automotive E Tailing Market Revenue billion Forecast, by Country 2020 & 2033
- Table 9: United States Automotive E Tailing Market Revenue (billion) Forecast, by Application 2020 & 2033
- Table 10: Canada Automotive E Tailing Market Revenue (billion) Forecast, by Application 2020 & 2033
- Table 11: Rest of North America Automotive E Tailing Market Revenue (billion) Forecast, by Application 2020 & 2033
- Table 12: Global Automotive E Tailing Market Revenue billion Forecast, by Component Type 2020 & 2033
- Table 13: Global Automotive E Tailing Market Revenue billion Forecast, by Vehicle Type 2020 & 2033
- Table 14: Global Automotive E Tailing Market Revenue billion Forecast, by Vendor Type 2020 & 2033
- Table 15: Global Automotive E Tailing Market Revenue billion Forecast, by Country 2020 & 2033
- Table 16: Germany Automotive E Tailing Market Revenue (billion) Forecast, by Application 2020 & 2033
- Table 17: United Kingdom Automotive E Tailing Market Revenue (billion) Forecast, by Application 2020 & 2033
- Table 18: France Automotive E Tailing Market Revenue (billion) Forecast, by Application 2020 & 2033
- Table 19: Italy Automotive E Tailing Market Revenue (billion) Forecast, by Application 2020 & 2033
- Table 20: Rest of Europe Automotive E Tailing Market Revenue (billion) Forecast, by Application 2020 & 2033
- Table 21: Global Automotive E Tailing Market Revenue billion Forecast, by Component Type 2020 & 2033
- Table 22: Global Automotive E Tailing Market Revenue billion Forecast, by Vehicle Type 2020 & 2033
- Table 23: Global Automotive E Tailing Market Revenue billion Forecast, by Vendor Type 2020 & 2033
- Table 24: Global Automotive E Tailing Market Revenue billion Forecast, by Country 2020 & 2033
- Table 25: India Automotive E Tailing Market Revenue (billion) Forecast, by Application 2020 & 2033
- Table 26: China Automotive E Tailing Market Revenue (billion) Forecast, by Application 2020 & 2033
- Table 27: Japan Automotive E Tailing Market Revenue (billion) Forecast, by Application 2020 & 2033
- Table 28: South Korea Automotive E Tailing Market Revenue (billion) Forecast, by Application 2020 & 2033
- Table 29: Rest of Asia Pacific Automotive E Tailing Market Revenue (billion) Forecast, by Application 2020 & 2033
- Table 30: Global Automotive E Tailing Market Revenue billion Forecast, by Component Type 2020 & 2033
- Table 31: Global Automotive E Tailing Market Revenue billion Forecast, by Vehicle Type 2020 & 2033
- Table 32: Global Automotive E Tailing Market Revenue billion Forecast, by Vendor Type 2020 & 2033
- Table 33: Global Automotive E Tailing Market Revenue billion Forecast, by Country 2020 & 2033
- Table 34: South America Automotive E Tailing Market Revenue (billion) Forecast, by Application 2020 & 2033
- Table 35: Middle East and Africa Automotive E Tailing Market Revenue (billion) Forecast, by Application 2020 & 2033
Frequently Asked Questions
1. What is the projected Compound Annual Growth Rate (CAGR) of the Automotive E Tailing Market?
The projected CAGR is approximately 14.2%.
2. Which companies are prominent players in the Automotive E Tailing Market?
Key companies in the market include Alibaba Group Holding Limited, Delticom AG, Advance Auto Parts Inc, Amazon com Inc, Robert Bosch GmbH, AutoZone Inc, Flipkart*List Not Exhaustive, eBay Inc, O'reilly Automotive Inc, Walmart Inc.
3. What are the main segments of the Automotive E Tailing Market?
The market segments include Component Type, Vehicle Type, Vendor Type.
4. Can you provide details about the market size?
The market size is estimated to be USD 17.1 billion as of 2022.
5. What are some drivers contributing to market growth?
Rise in Vehicle Electrification.
6. What are the notable trends driving market growth?
The Infotainment and Multimedia Segment to Hold Major Share in the Market.
7. Are there any restraints impacting market growth?
The Cost of Raw Materials Used in the Manufacturing of Switches is High.
8. Can you provide examples of recent developments in the market?
In February 2021, CarParts.com Partnered with McDowell and Front Row Motorsports (FRM) CarParts.com partnered with Front Row Motorsports (FRM) and McDowell on several contests, sweepstakes, promotions, and other activities to get more involved in the spark engagement and sport.
9. What pricing options are available for accessing the report?
Pricing options include single-user, multi-user, and enterprise licenses priced at USD 4750, USD 5250, and USD 8750 respectively.
10. Is the market size provided in terms of value or volume?
The market size is provided in terms of value, measured in billion.
11. Are there any specific market keywords associated with the report?
Yes, the market keyword associated with the report is "Automotive E Tailing Market," which aids in identifying and referencing the specific market segment covered.
12. How do I determine which pricing option suits my needs best?
The pricing options vary based on user requirements and access needs. Individual users may opt for single-user licenses, while businesses requiring broader access may choose multi-user or enterprise licenses for cost-effective access to the report.
13. Are there any additional resources or data provided in the Automotive E Tailing Market report?
While the report offers comprehensive insights, it's advisable to review the specific contents or supplementary materials provided to ascertain if additional resources or data are available.
14. How can I stay updated on further developments or reports in the Automotive E Tailing Market?
To stay informed about further developments, trends, and reports in the Automotive E Tailing Market, consider subscribing to industry newsletters, following relevant companies and organizations, or regularly checking reputable industry news sources and publications.
Methodology
Step 1 - Identification of Relevant Samples Size from Population Database


Step 2 - Approaches for Defining Global Market Size (Value, Volume* & Price*)

Note*: In applicable scenarios
Step 3 - Data Sources
Primary Research
- Web Analytics
- Survey Reports
- Research Institute
- Latest Research Reports
- Opinion Leaders
Secondary Research
- Annual Reports
- White Paper
- Latest Press Release
- Industry Association
- Paid Database
- Investor Presentations

Step 4 - Data Triangulation
Involves using different sources of information in order to increase the validity of a study
These sources are likely to be stakeholders in a program - participants, other researchers, program staff, other community members, and so on.
Then we put all data in single framework & apply various statistical tools to find out the dynamic on the market.
During the analysis stage, feedback from the stakeholder groups would be compared to determine areas of agreement as well as areas of divergence