

Key Insights
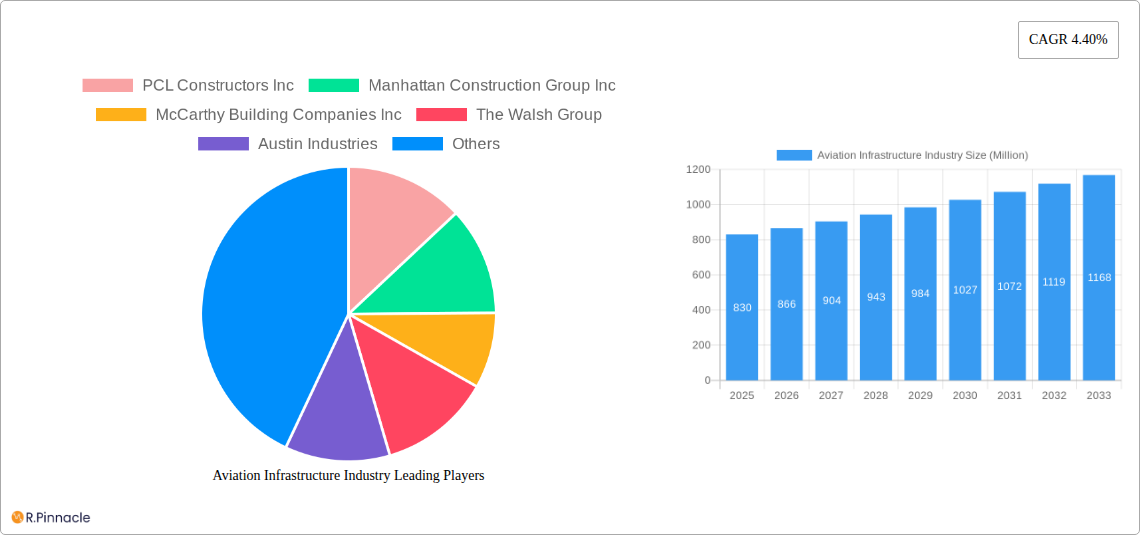
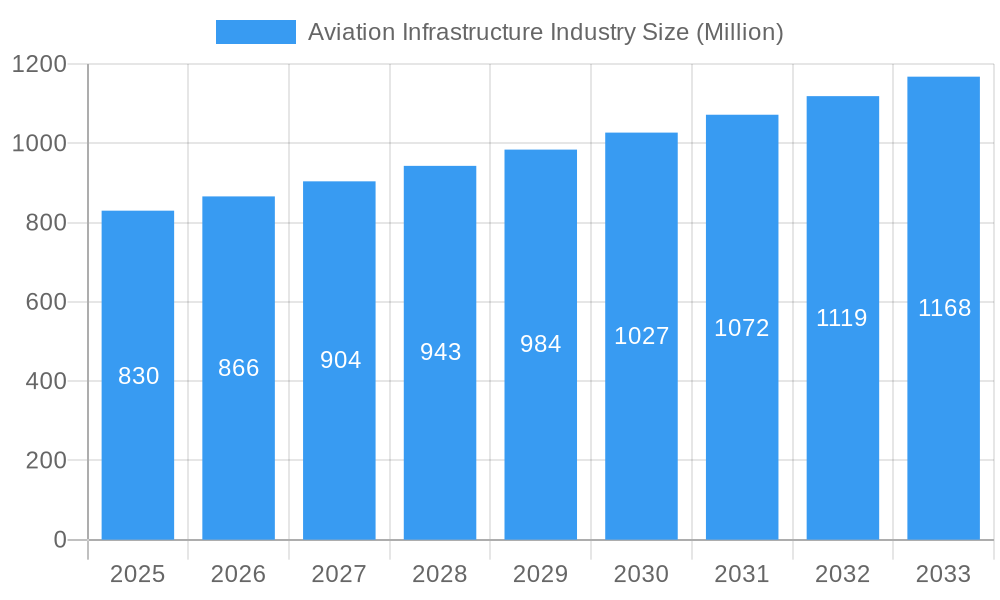
The global aviation infrastructure market, valued at $0.83 billion in 2025, is poised for robust growth, exhibiting a Compound Annual Growth Rate (CAGR) of 4.40% from 2025 to 2033. This expansion is driven by several key factors. Increased air passenger traffic globally necessitates the construction and modernization of airports, leading to significant investment in terminal expansions, upgraded runways and taxiways, and advanced air traffic control systems. The growing demand for efficient cargo handling also fuels infrastructure development. Furthermore, the increasing adoption of sustainable aviation practices is driving investment in eco-friendly infrastructure solutions, such as solar-powered lighting systems and improved waste management facilities. Government initiatives promoting air travel and tourism, coupled with private sector investments in new airport construction and expansion projects worldwide, contribute further to market growth. Regional variations exist, with North America and Asia-Pacific anticipated to be leading markets due to their large economies and high passenger volumes. However, the market may face constraints such as rising construction costs, supply chain disruptions, and potential regulatory hurdles related to environmental impact assessments and land acquisition.
Aviation Infrastructure Industry Market Size (In Million)
Segmentation within the aviation infrastructure market highlights significant opportunities across various infrastructure types (terminals, control towers, runways, aprons, hangars) and airport classifications (commercial, military, general aviation). Commercial airports are expected to dominate the market, driven by the continuous expansion of air travel. However, investments in military and general aviation infrastructure are also anticipated to contribute meaningfully to overall market growth. Key players in the industry, such as PCL Constructors Inc., Manhattan Construction Group Inc., and AECOM, are leveraging technological advancements and innovative construction methodologies to enhance efficiency and reduce project timelines. The competitive landscape is characterized by both large multinational corporations and specialized regional contractors. The focus on public-private partnerships and innovative financing models will likely shape the future trajectory of the aviation infrastructure market.
Aviation Infrastructure Industry Company Market Share
Aviation Infrastructure Industry Report: 2019-2033 Forecast
This comprehensive report provides an in-depth analysis of the Aviation Infrastructure Industry, offering invaluable insights for industry professionals, investors, and strategic planners. Covering the period from 2019 to 2033, with a focus on 2025, this report meticulously examines market dynamics, key players, and future growth potential. The total market size in 2025 is estimated at $XX Million, with a projected Compound Annual Growth Rate (CAGR) of XX% from 2025 to 2033.
Aviation Infrastructure Industry Market Structure & Innovation Trends
This section analyzes the competitive landscape, encompassing market concentration, innovation drivers, and regulatory influences within the $XX Million aviation infrastructure market. We examine the impact of mergers and acquisitions (M&A) activities, with a focus on deal values and market share changes. Key players like PCL Constructors Inc, Manhattan Construction Group Inc, and McCarthy Building Companies Inc, amongst others, are assessed for their strategic positioning and market influence. The report also details the regulatory frameworks shaping innovation and the role of product substitutes in influencing market dynamics. End-user demographics (commercial, military, general aviation) are segmented to identify growth pockets.
- Market Concentration: The market exhibits a moderately concentrated structure, with the top 5 players holding an estimated XX% market share in 2025.
- M&A Activity: The historical period (2019-2024) witnessed approximately XX M&A deals, with a total value exceeding $XX Million. The forecast period is anticipated to see increased consolidation.
- Innovation Drivers: Technological advancements in materials, construction techniques, and air traffic management systems are key drivers of innovation.
- Regulatory Frameworks: Stringent safety regulations and environmental considerations significantly influence market dynamics.
Aviation Infrastructure Industry Market Dynamics & Trends
This section delves into the factors driving market growth, including increasing air passenger traffic, expansion of airport infrastructure globally, and the adoption of advanced technologies. We analyze technological disruptions, such as the integration of smart technologies and sustainable building materials, and their impact on market penetration. Consumer preferences for enhanced passenger experiences and efficient airport operations influence infrastructure design and development. The competitive landscape is characterized by intense rivalry, with companies vying for market share through technological innovation and strategic partnerships. The report quantifies these dynamics through detailed analysis of market growth drivers, market penetration rates, and CAGR projections.
Dominant Regions & Segments in Aviation Infrastructure Industry
This section identifies the leading regions and segments within the aviation infrastructure market. We analyze the dominance of specific geographic areas and infrastructure types (Terminals, Control Towers, Taxiways & Runways, Aprons, Hangars, and Other Infrastructure Types), categorized by airport type (Commercial, Military, General Aviation). The analysis will consider factors that drive growth such as robust economic policies, substantial government investments in infrastructure development, and the increasing need for modernization of existing facilities.
Leading Region: [Name of Leading Region] dominates the market due to [Reasons for Dominance].
Dominant Infrastructure Type: [Name of Dominant Infrastructure Type] accounts for a significant share due to [Reasons for Dominance].
Leading Airport Type: [Name of Dominant Airport Type] exhibits high growth potential due to [Reasons for Dominance].
Key Drivers for [Specific Region/Segment]:
- [Bullet Point Driver 1]
- [Bullet Point Driver 2]
- [Bullet Point Driver 3]
Aviation Infrastructure Industry Product Innovations
This section highlights recent product developments, focusing on technological advancements that improve efficiency, sustainability, and safety within aviation infrastructure. We explore the competitive advantages offered by these innovations, examining their market fit and potential impact on future market trends. For example, the integration of AI-powered systems for air traffic management or the adoption of sustainable building materials are analyzed.
Report Scope & Segmentation Analysis
This report comprehensively segments the aviation infrastructure market by infrastructure type (Terminal, Control Tower, Taxiway and Runway, Apron, Hangar, Other Infrastructure Types) and airport type (Commercial Airport, Military Airport, General Aviation Airport). Each segment's growth projections, market size (in $ Million), and competitive landscape are analyzed. Detailed market sizing and projections for each segment are included for the forecast period (2025-2033).
Key Drivers of Aviation Infrastructure Industry Growth
The growth of the aviation infrastructure industry is propelled by several key factors. Increased air passenger traffic, coupled with expanding global air travel, fuels the demand for new and improved airport facilities. Government investments in infrastructure projects, coupled with supportive economic policies, further contribute to market expansion. Technological advancements in construction materials and airport management systems also play a significant role in driving growth. Finally, the rising focus on enhancing passenger experience and improving operational efficiency continuously stimulate innovation and expansion within the sector.
Challenges in the Aviation Infrastructure Industry Sector
The aviation infrastructure sector faces several challenges, including stringent regulatory requirements, complex and often lengthy approval processes, and supply chain disruptions that may impact construction timelines and budgets. Competition among industry players, coupled with fluctuations in the global economy, can affect overall market stability. These challenges lead to increased project costs and potential delays in project completion. Quantifiable impacts of these challenges are analyzed within the report.
Emerging Opportunities in Aviation Infrastructure Industry
The aviation infrastructure industry presents several compelling opportunities, including the development of sustainable and environmentally friendly airport facilities. Growing demand for advanced technologies, such as AI-powered air traffic management systems and smart building technologies, create lucrative markets for innovative solutions. Expansion into emerging markets with rapidly growing air travel sectors presents significant growth potential.
Leading Players in the Aviation Infrastructure Industry Market
- PCL Constructors Inc
- Manhattan Construction Group Inc
- McCarthy Building Companies Inc
- The Walsh Group
- Austin Industries
- Hill International Inc
- The Sundt Companies Inc
- Hensel Phelps
- Royal BAM Group NV
- Turner Construction Company
- J E Dunn Construction Company
- Skanska
- BIC Contracting LLC
- TAV Construction
- AECOM
- ALEC Engineering and Contracting
Key Developments in Aviation Infrastructure Industry
- [Month, Year]: [Development Description and Impact]
- [Month, Year]: [Development Description and Impact]
- [Month, Year]: [Development Description and Impact]
- [Month, Year]: [Development Description and Impact]
Future Outlook for Aviation Infrastructure Industry Market
The future outlook for the aviation infrastructure industry is positive, driven by sustained growth in air passenger traffic and increasing investments in airport infrastructure globally. Technological advancements will continue to shape the sector, improving efficiency, sustainability, and passenger experience. Strategic partnerships and mergers & acquisitions will likely increase market consolidation. The industry is poised for sustained growth over the forecast period, presenting significant opportunities for companies that can adapt to changing market dynamics and embrace innovation.
Aviation Infrastructure Industry Segmentation
-
1. Airport Type
- 1.1. Commercial Airport
- 1.2. Military Airport
- 1.3. General Aviation Airport
-
2. Infrastructure Type
- 2.1. Terminal
- 2.2. Control Tower
- 2.3. Taxiway and Runway
- 2.4. Apron
- 2.5. Hangar
- 2.6. Other Infrastructure Types
Aviation Infrastructure Industry Segmentation By Geography
-
1. North America
- 1.1. United States
- 1.2. Canada
-
2. Europe
- 2.1. United Kingdom
- 2.2. Germany
- 2.3. France
- 2.4. Rest of Europe
-
3. Asia Pacific
- 3.1. China
- 3.2. India
- 3.3. Japan
- 3.4. South Korea
- 3.5. Rest of Asia Pacific
-
4. Latin America
- 4.1. Brazil
- 4.2. Rest of Latin America
-
5. Middle East and Africa
- 5.1. United Arab Emirates
- 5.2. Saudi Arabia
- 5.3. Rest of Middle East and Africa
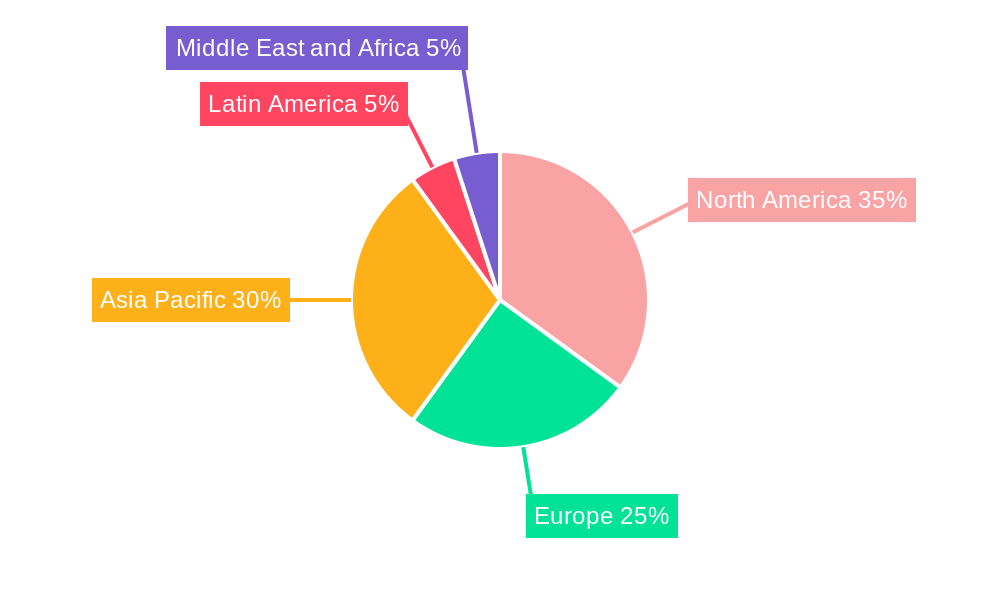
Aviation Infrastructure Industry Regional Market Share
Geographic Coverage of Aviation Infrastructure Industry
Aviation Infrastructure Industry REPORT HIGHLIGHTS
| Aspects | Details |
|---|---|
| Study Period | 2020-2034 |
| Base Year | 2025 |
| Estimated Year | 2026 |
| Forecast Period | 2026-2034 |
| Historical Period | 2020-2025 |
| Growth Rate | CAGR of 4.40% from 2020-2034 |
| Segmentation |
|
Table of Contents
- 1. Introduction
- 1.1. Research Scope
- 1.2. Market Segmentation
- 1.3. Research Objective
- 1.4. Definitions and Assumptions
- 2. Executive Summary
- 2.1. Market Snapshot
- 3. Market Dynamics
- 3.1. Market Drivers
- 3.2. Market Restrains
- 3.3. Market Trends
- 3.4. Market Opportunities
- 4. Market Factor Analysis
- 4.1. Porters Five Forces
- 4.1.1. Bargaining Power of Suppliers
- 4.1.2. Bargaining Power of Buyers
- 4.1.3. Threat of New Entrants
- 4.1.4. Threat of Substitutes
- 4.1.5. Competitive Rivalry
- 4.2. PESTEL analysis
- 4.3. BCG Analysis
- 4.3.1. Stars (High Growth, High Market Share)
- 4.3.2. Cash Cows (Low Growth, High Market Share)
- 4.3.3. Question Mark (High Growth, Low Market Share)
- 4.3.4. Dogs (Low Growth, Low Market Share)
- 4.4. Ansoff Matrix Analysis
- 4.5. Supply Chain Analysis
- 4.6. Regulatory Landscape
- 4.7. Current Market Potential and Opportunity Assessment (TAM–SAM–SOM Framework)
- 4.8. PRI Analyst Note
- 4.1. Porters Five Forces
- 5. Market Analysis, Insights and Forecast 2021-2033
- 5.1. Market Analysis, Insights and Forecast - by Airport Type
- 5.1.1. Commercial Airport
- 5.1.2. Military Airport
- 5.1.3. General Aviation Airport
- 5.2. Market Analysis, Insights and Forecast - by Infrastructure Type
- 5.2.1. Terminal
- 5.2.2. Control Tower
- 5.2.3. Taxiway and Runway
- 5.2.4. Apron
- 5.2.5. Hangar
- 5.2.6. Other Infrastructure Types
- 5.3. Market Analysis, Insights and Forecast - by Region
- 5.3.1. North America
- 5.3.2. Europe
- 5.3.3. Asia Pacific
- 5.3.4. Latin America
- 5.3.5. Middle East and Africa
- 5.1. Market Analysis, Insights and Forecast - by Airport Type
- 6. Global Aviation Infrastructure Industry Analysis, Insights and Forecast, 2021-2033
- 6.1. Market Analysis, Insights and Forecast - by Airport Type
- 6.1.1. Commercial Airport
- 6.1.2. Military Airport
- 6.1.3. General Aviation Airport
- 6.2. Market Analysis, Insights and Forecast - by Infrastructure Type
- 6.2.1. Terminal
- 6.2.2. Control Tower
- 6.2.3. Taxiway and Runway
- 6.2.4. Apron
- 6.2.5. Hangar
- 6.2.6. Other Infrastructure Types
- 6.1. Market Analysis, Insights and Forecast - by Airport Type
- 7. North America Aviation Infrastructure Industry Analysis, Insights and Forecast, 2020-2032
- 7.1. Market Analysis, Insights and Forecast - by Airport Type
- 7.1.1. Commercial Airport
- 7.1.2. Military Airport
- 7.1.3. General Aviation Airport
- 7.2. Market Analysis, Insights and Forecast - by Infrastructure Type
- 7.2.1. Terminal
- 7.2.2. Control Tower
- 7.2.3. Taxiway and Runway
- 7.2.4. Apron
- 7.2.5. Hangar
- 7.2.6. Other Infrastructure Types
- 7.1. Market Analysis, Insights and Forecast - by Airport Type
- 8. Europe Aviation Infrastructure Industry Analysis, Insights and Forecast, 2020-2032
- 8.1. Market Analysis, Insights and Forecast - by Airport Type
- 8.1.1. Commercial Airport
- 8.1.2. Military Airport
- 8.1.3. General Aviation Airport
- 8.2. Market Analysis, Insights and Forecast - by Infrastructure Type
- 8.2.1. Terminal
- 8.2.2. Control Tower
- 8.2.3. Taxiway and Runway
- 8.2.4. Apron
- 8.2.5. Hangar
- 8.2.6. Other Infrastructure Types
- 8.1. Market Analysis, Insights and Forecast - by Airport Type
- 9. Asia Pacific Aviation Infrastructure Industry Analysis, Insights and Forecast, 2020-2032
- 9.1. Market Analysis, Insights and Forecast - by Airport Type
- 9.1.1. Commercial Airport
- 9.1.2. Military Airport
- 9.1.3. General Aviation Airport
- 9.2. Market Analysis, Insights and Forecast - by Infrastructure Type
- 9.2.1. Terminal
- 9.2.2. Control Tower
- 9.2.3. Taxiway and Runway
- 9.2.4. Apron
- 9.2.5. Hangar
- 9.2.6. Other Infrastructure Types
- 9.1. Market Analysis, Insights and Forecast - by Airport Type
- 10. Latin America Aviation Infrastructure Industry Analysis, Insights and Forecast, 2020-2032
- 10.1. Market Analysis, Insights and Forecast - by Airport Type
- 10.1.1. Commercial Airport
- 10.1.2. Military Airport
- 10.1.3. General Aviation Airport
- 10.2. Market Analysis, Insights and Forecast - by Infrastructure Type
- 10.2.1. Terminal
- 10.2.2. Control Tower
- 10.2.3. Taxiway and Runway
- 10.2.4. Apron
- 10.2.5. Hangar
- 10.2.6. Other Infrastructure Types
- 10.1. Market Analysis, Insights and Forecast - by Airport Type
- 11. Middle East and Africa Aviation Infrastructure Industry Analysis, Insights and Forecast, 2020-2032
- 11.1. Market Analysis, Insights and Forecast - by Airport Type
- 11.1.1. Commercial Airport
- 11.1.2. Military Airport
- 11.1.3. General Aviation Airport
- 11.2. Market Analysis, Insights and Forecast - by Infrastructure Type
- 11.2.1. Terminal
- 11.2.2. Control Tower
- 11.2.3. Taxiway and Runway
- 11.2.4. Apron
- 11.2.5. Hangar
- 11.2.6. Other Infrastructure Types
- 11.1. Market Analysis, Insights and Forecast - by Airport Type
- 12. Competitive Analysis
- 12.1. Company Profiles
- 12.1.1 PCL Constructors Inc
- 12.1.1.1. Company Overview
- 12.1.1.2. Products
- 12.1.1.3. Company Financials
- 12.1.1.4. SWOT Analysis
- 12.1.2 Manhattan Construction Group Inc
- 12.1.2.1. Company Overview
- 12.1.2.2. Products
- 12.1.2.3. Company Financials
- 12.1.2.4. SWOT Analysis
- 12.1.3 McCarthy Building Companies Inc
- 12.1.3.1. Company Overview
- 12.1.3.2. Products
- 12.1.3.3. Company Financials
- 12.1.3.4. SWOT Analysis
- 12.1.4 The Walsh Group
- 12.1.4.1. Company Overview
- 12.1.4.2. Products
- 12.1.4.3. Company Financials
- 12.1.4.4. SWOT Analysis
- 12.1.5 Austin Industries
- 12.1.5.1. Company Overview
- 12.1.5.2. Products
- 12.1.5.3. Company Financials
- 12.1.5.4. SWOT Analysis
- 12.1.6 Hill International Inc
- 12.1.6.1. Company Overview
- 12.1.6.2. Products
- 12.1.6.3. Company Financials
- 12.1.6.4. SWOT Analysis
- 12.1.7 The Sundt Companies Inc
- 12.1.7.1. Company Overview
- 12.1.7.2. Products
- 12.1.7.3. Company Financials
- 12.1.7.4. SWOT Analysis
- 12.1.8 Hensel Phelps
- 12.1.8.1. Company Overview
- 12.1.8.2. Products
- 12.1.8.3. Company Financials
- 12.1.8.4. SWOT Analysis
- 12.1.9 Royal BAM Group NV
- 12.1.9.1. Company Overview
- 12.1.9.2. Products
- 12.1.9.3. Company Financials
- 12.1.9.4. SWOT Analysis
- 12.1.10 Turner Construction Company
- 12.1.10.1. Company Overview
- 12.1.10.2. Products
- 12.1.10.3. Company Financials
- 12.1.10.4. SWOT Analysis
- 12.1.11 J E Dunn Construction Company
- 12.1.11.1. Company Overview
- 12.1.11.2. Products
- 12.1.11.3. Company Financials
- 12.1.11.4. SWOT Analysis
- 12.1.12 Skanska
- 12.1.12.1. Company Overview
- 12.1.12.2. Products
- 12.1.12.3. Company Financials
- 12.1.12.4. SWOT Analysis
- 12.1.13 BIC Contracting LLC
- 12.1.13.1. Company Overview
- 12.1.13.2. Products
- 12.1.13.3. Company Financials
- 12.1.13.4. SWOT Analysis
- 12.1.14 TAV Construction
- 12.1.14.1. Company Overview
- 12.1.14.2. Products
- 12.1.14.3. Company Financials
- 12.1.14.4. SWOT Analysis
- 12.1.15 AECOM
- 12.1.15.1. Company Overview
- 12.1.15.2. Products
- 12.1.15.3. Company Financials
- 12.1.15.4. SWOT Analysis
- 12.1.16 ALEC Engineering and Contracting
- 12.1.16.1. Company Overview
- 12.1.16.2. Products
- 12.1.16.3. Company Financials
- 12.1.16.4. SWOT Analysis
- 12.1.1 PCL Constructors Inc
- 12.2. Market Entropy
- 12.2.1 Company's Key Areas Served
- 12.2.2 Recent Developments
- 12.3. Company Market Share Analysis 2025
- 12.3.1 Top 5 Companies Market Share Analysis
- 12.3.2 Top 3 Companies Market Share Analysis
- 12.4. List of Potential Customers
- 13. Research Methodology
List of Figures
- Figure 1: Global Aviation Infrastructure Industry Revenue Breakdown (Million, %) by Region 2025 & 2033
- Figure 2: North America Aviation Infrastructure Industry Revenue (Million), by Airport Type 2025 & 2033
- Figure 3: North America Aviation Infrastructure Industry Revenue Share (%), by Airport Type 2025 & 2033
- Figure 4: North America Aviation Infrastructure Industry Revenue (Million), by Infrastructure Type 2025 & 2033
- Figure 5: North America Aviation Infrastructure Industry Revenue Share (%), by Infrastructure Type 2025 & 2033
- Figure 6: North America Aviation Infrastructure Industry Revenue (Million), by Country 2025 & 2033
- Figure 7: North America Aviation Infrastructure Industry Revenue Share (%), by Country 2025 & 2033
- Figure 8: Europe Aviation Infrastructure Industry Revenue (Million), by Airport Type 2025 & 2033
- Figure 9: Europe Aviation Infrastructure Industry Revenue Share (%), by Airport Type 2025 & 2033
- Figure 10: Europe Aviation Infrastructure Industry Revenue (Million), by Infrastructure Type 2025 & 2033
- Figure 11: Europe Aviation Infrastructure Industry Revenue Share (%), by Infrastructure Type 2025 & 2033
- Figure 12: Europe Aviation Infrastructure Industry Revenue (Million), by Country 2025 & 2033
- Figure 13: Europe Aviation Infrastructure Industry Revenue Share (%), by Country 2025 & 2033
- Figure 14: Asia Pacific Aviation Infrastructure Industry Revenue (Million), by Airport Type 2025 & 2033
- Figure 15: Asia Pacific Aviation Infrastructure Industry Revenue Share (%), by Airport Type 2025 & 2033
- Figure 16: Asia Pacific Aviation Infrastructure Industry Revenue (Million), by Infrastructure Type 2025 & 2033
- Figure 17: Asia Pacific Aviation Infrastructure Industry Revenue Share (%), by Infrastructure Type 2025 & 2033
- Figure 18: Asia Pacific Aviation Infrastructure Industry Revenue (Million), by Country 2025 & 2033
- Figure 19: Asia Pacific Aviation Infrastructure Industry Revenue Share (%), by Country 2025 & 2033
- Figure 20: Latin America Aviation Infrastructure Industry Revenue (Million), by Airport Type 2025 & 2033
- Figure 21: Latin America Aviation Infrastructure Industry Revenue Share (%), by Airport Type 2025 & 2033
- Figure 22: Latin America Aviation Infrastructure Industry Revenue (Million), by Infrastructure Type 2025 & 2033
- Figure 23: Latin America Aviation Infrastructure Industry Revenue Share (%), by Infrastructure Type 2025 & 2033
- Figure 24: Latin America Aviation Infrastructure Industry Revenue (Million), by Country 2025 & 2033
- Figure 25: Latin America Aviation Infrastructure Industry Revenue Share (%), by Country 2025 & 2033
- Figure 26: Middle East and Africa Aviation Infrastructure Industry Revenue (Million), by Airport Type 2025 & 2033
- Figure 27: Middle East and Africa Aviation Infrastructure Industry Revenue Share (%), by Airport Type 2025 & 2033
- Figure 28: Middle East and Africa Aviation Infrastructure Industry Revenue (Million), by Infrastructure Type 2025 & 2033
- Figure 29: Middle East and Africa Aviation Infrastructure Industry Revenue Share (%), by Infrastructure Type 2025 & 2033
- Figure 30: Middle East and Africa Aviation Infrastructure Industry Revenue (Million), by Country 2025 & 2033
- Figure 31: Middle East and Africa Aviation Infrastructure Industry Revenue Share (%), by Country 2025 & 2033
List of Tables
- Table 1: Global Aviation Infrastructure Industry Revenue Million Forecast, by Airport Type 2020 & 2033
- Table 2: Global Aviation Infrastructure Industry Revenue Million Forecast, by Infrastructure Type 2020 & 2033
- Table 3: Global Aviation Infrastructure Industry Revenue Million Forecast, by Region 2020 & 2033
- Table 4: Global Aviation Infrastructure Industry Revenue Million Forecast, by Airport Type 2020 & 2033
- Table 5: Global Aviation Infrastructure Industry Revenue Million Forecast, by Infrastructure Type 2020 & 2033
- Table 6: Global Aviation Infrastructure Industry Revenue Million Forecast, by Country 2020 & 2033
- Table 7: United States Aviation Infrastructure Industry Revenue (Million) Forecast, by Application 2020 & 2033
- Table 8: Canada Aviation Infrastructure Industry Revenue (Million) Forecast, by Application 2020 & 2033
- Table 9: Global Aviation Infrastructure Industry Revenue Million Forecast, by Airport Type 2020 & 2033
- Table 10: Global Aviation Infrastructure Industry Revenue Million Forecast, by Infrastructure Type 2020 & 2033
- Table 11: Global Aviation Infrastructure Industry Revenue Million Forecast, by Country 2020 & 2033
- Table 12: United Kingdom Aviation Infrastructure Industry Revenue (Million) Forecast, by Application 2020 & 2033
- Table 13: Germany Aviation Infrastructure Industry Revenue (Million) Forecast, by Application 2020 & 2033
- Table 14: France Aviation Infrastructure Industry Revenue (Million) Forecast, by Application 2020 & 2033
- Table 15: Rest of Europe Aviation Infrastructure Industry Revenue (Million) Forecast, by Application 2020 & 2033
- Table 16: Global Aviation Infrastructure Industry Revenue Million Forecast, by Airport Type 2020 & 2033
- Table 17: Global Aviation Infrastructure Industry Revenue Million Forecast, by Infrastructure Type 2020 & 2033
- Table 18: Global Aviation Infrastructure Industry Revenue Million Forecast, by Country 2020 & 2033
- Table 19: China Aviation Infrastructure Industry Revenue (Million) Forecast, by Application 2020 & 2033
- Table 20: India Aviation Infrastructure Industry Revenue (Million) Forecast, by Application 2020 & 2033
- Table 21: Japan Aviation Infrastructure Industry Revenue (Million) Forecast, by Application 2020 & 2033
- Table 22: South Korea Aviation Infrastructure Industry Revenue (Million) Forecast, by Application 2020 & 2033
- Table 23: Rest of Asia Pacific Aviation Infrastructure Industry Revenue (Million) Forecast, by Application 2020 & 2033
- Table 24: Global Aviation Infrastructure Industry Revenue Million Forecast, by Airport Type 2020 & 2033
- Table 25: Global Aviation Infrastructure Industry Revenue Million Forecast, by Infrastructure Type 2020 & 2033
- Table 26: Global Aviation Infrastructure Industry Revenue Million Forecast, by Country 2020 & 2033
- Table 27: Brazil Aviation Infrastructure Industry Revenue (Million) Forecast, by Application 2020 & 2033
- Table 28: Rest of Latin America Aviation Infrastructure Industry Revenue (Million) Forecast, by Application 2020 & 2033
- Table 29: Global Aviation Infrastructure Industry Revenue Million Forecast, by Airport Type 2020 & 2033
- Table 30: Global Aviation Infrastructure Industry Revenue Million Forecast, by Infrastructure Type 2020 & 2033
- Table 31: Global Aviation Infrastructure Industry Revenue Million Forecast, by Country 2020 & 2033
- Table 32: United Arab Emirates Aviation Infrastructure Industry Revenue (Million) Forecast, by Application 2020 & 2033
- Table 33: Saudi Arabia Aviation Infrastructure Industry Revenue (Million) Forecast, by Application 2020 & 2033
- Table 34: Rest of Middle East and Africa Aviation Infrastructure Industry Revenue (Million) Forecast, by Application 2020 & 2033
Frequently Asked Questions
1. What is the projected Compound Annual Growth Rate (CAGR) of the Aviation Infrastructure Industry?
The projected CAGR is approximately 4.40%.
2. Which companies are prominent players in the Aviation Infrastructure Industry?
Key companies in the market include PCL Constructors Inc, Manhattan Construction Group Inc, McCarthy Building Companies Inc, The Walsh Group, Austin Industries, Hill International Inc, The Sundt Companies Inc, Hensel Phelps, Royal BAM Group NV, Turner Construction Company, J E Dunn Construction Company, Skanska, BIC Contracting LLC, TAV Construction, AECOM, ALEC Engineering and Contracting.
3. What are the main segments of the Aviation Infrastructure Industry?
The market segments include Airport Type, Infrastructure Type.
4. Can you provide details about the market size?
The market size is estimated to be USD 0.83 Million as of 2022.
5. What are some drivers contributing to market growth?
N/A
6. What are the notable trends driving market growth?
Terminal Segment Will Showcase Remarkable Growth During the Forecast Period.
7. Are there any restraints impacting market growth?
N/A
8. Can you provide examples of recent developments in the market?
N/A
9. What pricing options are available for accessing the report?
Pricing options include single-user, multi-user, and enterprise licenses priced at USD 4750, USD 5250, and USD 8750 respectively.
10. Is the market size provided in terms of value or volume?
The market size is provided in terms of value, measured in Million.
11. Are there any specific market keywords associated with the report?
Yes, the market keyword associated with the report is "Aviation Infrastructure Industry," which aids in identifying and referencing the specific market segment covered.
12. How do I determine which pricing option suits my needs best?
The pricing options vary based on user requirements and access needs. Individual users may opt for single-user licenses, while businesses requiring broader access may choose multi-user or enterprise licenses for cost-effective access to the report.
13. Are there any additional resources or data provided in the Aviation Infrastructure Industry report?
While the report offers comprehensive insights, it's advisable to review the specific contents or supplementary materials provided to ascertain if additional resources or data are available.
14. How can I stay updated on further developments or reports in the Aviation Infrastructure Industry?
To stay informed about further developments, trends, and reports in the Aviation Infrastructure Industry, consider subscribing to industry newsletters, following relevant companies and organizations, or regularly checking reputable industry news sources and publications.
Methodology
Step 1 - Identification of Relevant Samples Size from Population Database


Step 2 - Approaches for Defining Global Market Size (Value, Volume* & Price*)

Note*: In applicable scenarios
Step 3 - Data Sources
Primary Research
- Web Analytics
- Survey Reports
- Research Institute
- Latest Research Reports
- Opinion Leaders
Secondary Research
- Annual Reports
- White Paper
- Latest Press Release
- Industry Association
- Paid Database
- Investor Presentations

Step 4 - Data Triangulation
Involves using different sources of information in order to increase the validity of a study
These sources are likely to be stakeholders in a program - participants, other researchers, program staff, other community members, and so on.
Then we put all data in single framework & apply various statistical tools to find out the dynamic on the market.
During the analysis stage, feedback from the stakeholder groups would be compared to determine areas of agreement as well as areas of divergence