

Key Insights
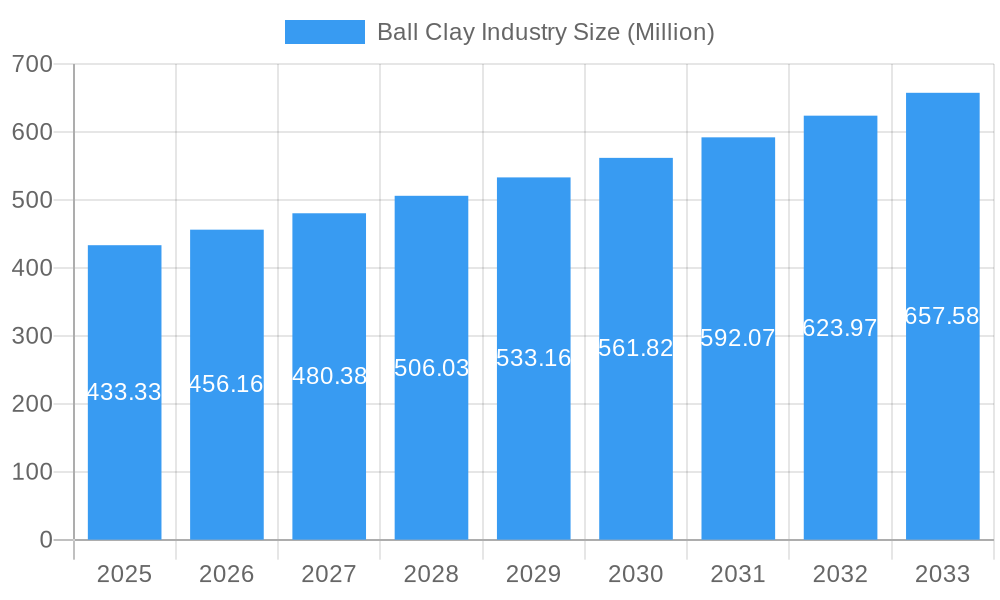
The global ball clay market, valued at $433.33 million in 2025, is projected to experience robust growth, driven by a Compound Annual Growth Rate (CAGR) of 5.07% from 2025 to 2033. This expansion is fueled by the increasing demand from key end-use sectors, primarily the ceramics industry, particularly in construction ceramics and refractories. The rising global construction activities, coupled with the growing popularity of ceramic tiles and sanitaryware, are significant market drivers. Furthermore, the inherent properties of ball clay, such as its plasticity, contribute to its widespread use in diverse applications, including paper coatings and casting. Technological advancements in ceramic manufacturing processes are further enhancing the efficiency and quality of ball clay utilization, boosting market growth. However, fluctuations in raw material prices and environmental concerns related to mining and processing could pose challenges to sustained market expansion.
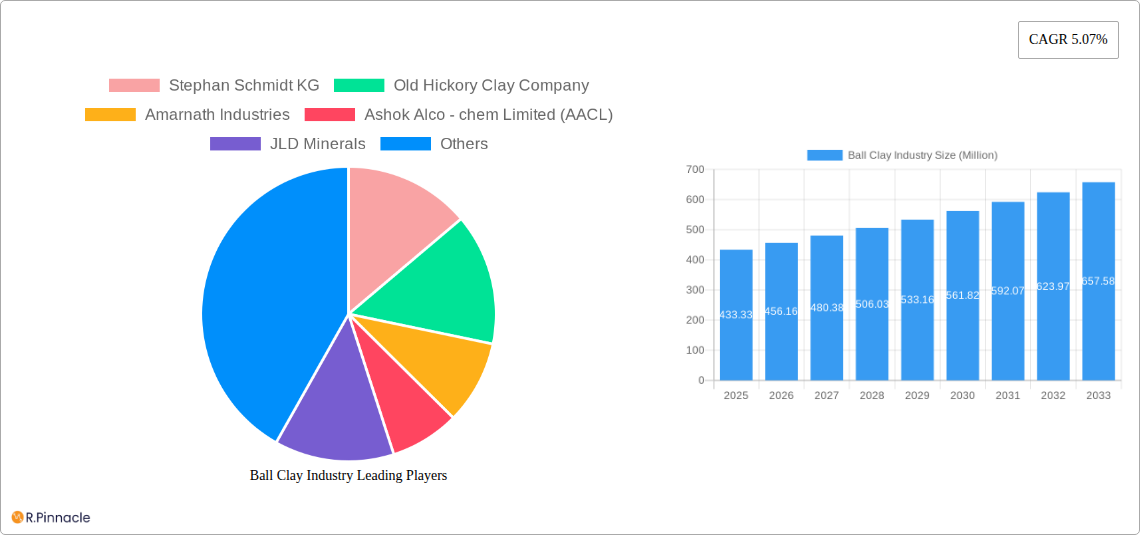
Ball Clay Industry Market Size (In Million)
The market is segmented by end-use into ceramic and non-ceramic applications. The ceramic segment dominates, encompassing construction ceramics (like bricks and tiles) and refractories (used in high-temperature applications). The non-ceramic segment, though smaller, exhibits promising growth potential due to its increasing utilization in the paper industry. Geographically, Asia-Pacific, particularly China and India, represents a significant market share due to robust construction activity and expanding ceramic manufacturing industries. North America and Europe also contribute substantially, driven by established ceramic industries and high consumer demand. Companies like Imerys and Sibelco, established players with significant market presence, are actively contributing to innovation and market expansion through investments in research and development and strategic partnerships. The forecast period of 2025-2033 presents considerable opportunities for market players to capitalize on the growing demand and technological advancements within this dynamic sector.
Ball Clay Industry Company Market Share
Ball Clay Industry Report: 2019-2033 Forecast
This comprehensive report provides an in-depth analysis of the global ball clay industry, offering invaluable insights for industry professionals, investors, and strategic decision-makers. The report covers the period 2019-2033, with a focus on the forecast period 2025-2033 and a base year of 2025. The global market size is projected to reach xx Million by 2033, exhibiting a CAGR of xx% during the forecast period.
Ball Clay Industry Market Structure & Innovation Trends
This section analyzes the competitive landscape of the ball clay industry, examining market concentration, innovation drivers, regulatory frameworks, and key industry trends. The report assesses the market share of major players such as Imerys, Sibelco, and others, revealing a moderately concentrated market with significant opportunities for growth and consolidation. The analysis also delves into the impact of M&A activities on market dynamics, estimating total M&A deal values at approximately xx Million during the historical period (2019-2024).
- Market Concentration: Moderate, with Imerys and Sibelco holding significant market share.
- Innovation Drivers: Increasing demand for high-performance ceramics, advancements in processing techniques.
- Regulatory Frameworks: Environmental regulations impacting mining and processing operations.
- Product Substitutes: Limited, with ball clay possessing unique properties crucial in various applications.
- End-User Demographics: Primarily focused on the ceramics industry, with growing demand from other sectors.
- M&A Activities: Significant consolidation observed during the historical period, with potential for further activity in the forecast period.
Ball Clay Industry Market Dynamics & Trends
This section explores the key factors driving market growth, including technological advancements, evolving consumer preferences, and competitive dynamics. The report highlights the increasing demand for high-quality ball clay driven by the expansion of the construction and ceramic industries, along with the impact of technological advancements in processing and application techniques. The CAGR for the forecast period (2025-2033) is estimated at xx%, with market penetration expected to increase in developing economies. The analysis incorporates details on pricing trends, supply chain dynamics, and emerging challenges for industry participants.
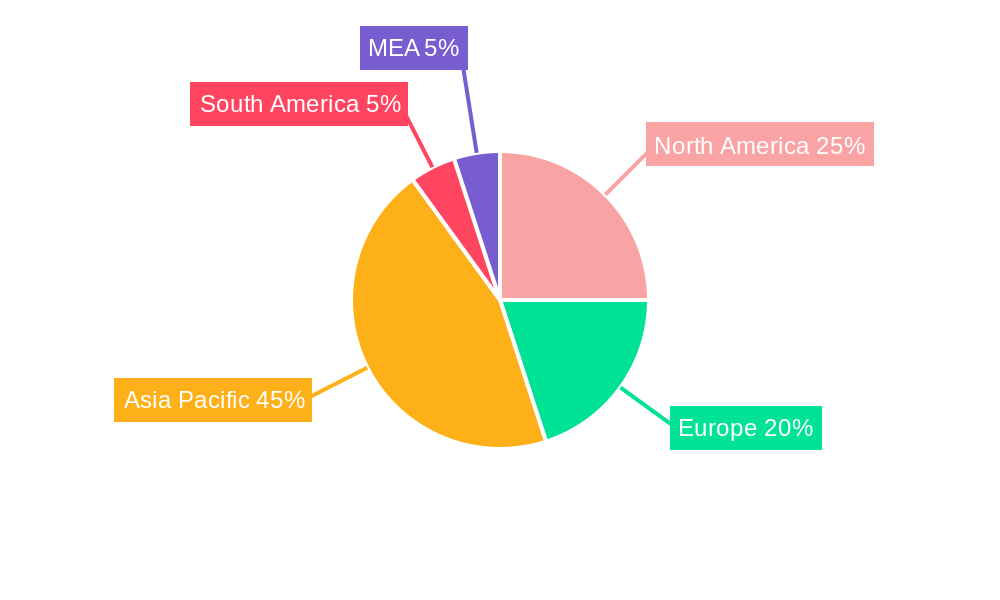
Dominant Regions & Segments in Ball Clay Industry
This section identifies the leading regions and segments within the ball clay industry. Based on our analysis, Asia-Pacific is the dominant region, driven by robust economic growth and expanding construction sectors.
Key Drivers of Dominance:
- Asia-Pacific: Rapid industrialization, rising disposable incomes, and substantial infrastructure development projects.
- North America: Well-established ceramics industry, technological innovation, and relatively stable demand.
Segment Dominance:
- Ceramic: The Ceramic segment dominates the market, accounting for xx% of total market value in 2025, driven by the significant use of ball clay in the manufacturing of tiles, sanitaryware, and tableware.
- Other Ceramics (Construction Ceramics and Refractories): This segment shows steady growth, driven by ongoing infrastructure projects and industrial construction.
- Non-ceramic: This niche segment holds xx% market share, and displays potential for expansion in specialized applications.
Ball Clay Industry Product Innovations
Recent innovations focus on enhancing the properties of ball clay to meet the evolving needs of various applications. This includes the development of refined grades with improved plasticity, strength, and whiteness. These advancements allow for the creation of high-performance ceramic products with superior durability and aesthetic appeal. The adoption of sustainable processing techniques is also gaining traction, aligning with growing environmental concerns.
Report Scope & Segmentation Analysis
The report segments the ball clay market by end-use, including Ceramic, Other Ceramics (Construction Ceramics and Refractories), and Non-ceramic. Each segment is analyzed in detail, considering market size, growth projections, and competitive dynamics. Market size projections are provided for each segment for the forecast period, indicating significant growth potential across all segments, although the Ceramic segment retains its dominant position.
Key Drivers of Ball Clay Industry Growth
The growth of the ball clay industry is propelled by several key factors. The expansion of the construction sector globally, fueled by urbanization and infrastructure development, represents a primary driver. The increasing demand for high-quality ceramics in diverse applications, including tiles, sanitaryware, and tableware, also significantly contributes to market expansion. Furthermore, technological advancements in ball clay processing and refinement enhance product quality and efficiency.
Challenges in the Ball Clay Industry Sector
The ball clay industry faces several challenges, including fluctuating raw material prices, environmental regulations impacting mining operations, and intense competition from alternative materials. Supply chain disruptions due to geopolitical factors and increased transportation costs also pose significant obstacles. These factors can influence profitability and necessitate strategic adaptations for industry players.
Emerging Opportunities in Ball Clay Industry
The industry offers several emerging opportunities. Growing demand for sustainable and eco-friendly products creates a niche for ball clay producers who adopt sustainable practices. Technological advancements in processing and application, as well as exploration of new applications in advanced materials, promise lucrative possibilities. The expansion into emerging economies presents significant potential for market growth.
Leading Players in the Ball Clay Industry Market
Key Developments in Ball Clay Industry
- 2022 Q3: Imerys announced a new investment in sustainable processing technology.
- 2023 Q1: Sibelco launched a new high-performance ball clay for advanced ceramic applications.
- 2024 Q2: A major M&A deal involving two smaller ball clay producers was finalized. (Further details on specific deals will be included in the full report)
Future Outlook for Ball Clay Industry Market
The ball clay industry is poised for continued growth, driven by robust demand from the construction and ceramics sectors, along with innovation in material science and applications. Strategic partnerships and investments in sustainable practices will shape the future of the industry, creating new opportunities for growth and innovation. The focus will be on higher-value products, sustainable mining practices, and technological advancements that enhance efficiency and product quality.
Ball Clay Industry Segmentation
-
1. End Use
-
1.1. Ceramic
- 1.1.1. Sanitary Ware
- 1.1.2. Wall and Floor Tiles
- 1.1.3. Tableware
- 1.1.4. Bricks
- 1.1.5. Other Ce
-
1.2. Non-ceramic
- 1.2.1. Adhesives and Sealants
- 1.2.2. Rubbers and Plastics
- 1.2.3. Fertilizers and Insecticides
- 1.2.4. Other Non-ceramics
-
1.1. Ceramic
Ball Clay Industry Segmentation By Geography
-
1. Asia Pacific
- 1.1. China
- 1.2. India
- 1.3. Japan
- 1.4. South Korea
- 1.5. Rest of Asia Pacific
-
2. North America
- 2.1. United States
- 2.2. Canada
- 2.3. Mexico
-
3. Europe
- 3.1. Germany
- 3.2. United Kingdom
- 3.3. Italy
- 3.4. France
- 3.5. Spain
- 3.6. Rest of Europe
-
4. South America
- 4.1. Brazil
- 4.2. Argentina
- 4.3. Rest of South America
-
5. Middle East and Africa
- 5.1. Saudi Arabia
- 5.2. South Africa
- 5.3. Rest of Middle East and Africa
Ball Clay Industry Regional Market Share
Geographic Coverage of Ball Clay Industry
Ball Clay Industry REPORT HIGHLIGHTS
| Aspects | Details |
|---|---|
| Study Period | 2020-2034 |
| Base Year | 2025 |
| Estimated Year | 2026 |
| Forecast Period | 2026-2034 |
| Historical Period | 2020-2025 |
| Growth Rate | CAGR of 5.07% from 2020-2034 |
| Segmentation |
|
Table of Contents
- 1. Introduction
- 1.1. Research Scope
- 1.2. Market Segmentation
- 1.3. Research Objective
- 1.4. Definitions and Assumptions
- 2. Executive Summary
- 2.1. Market Snapshot
- 3. Market Dynamics
- 3.1. Market Drivers
- 3.2. Market Restrains
- 3.3. Market Trends
- 3.4. Market Opportunities
- 4. Market Factor Analysis
- 4.1. Porters Five Forces
- 4.1.1. Bargaining Power of Suppliers
- 4.1.2. Bargaining Power of Buyers
- 4.1.3. Threat of New Entrants
- 4.1.4. Threat of Substitutes
- 4.1.5. Competitive Rivalry
- 4.2. PESTEL analysis
- 4.3. BCG Analysis
- 4.3.1. Stars (High Growth, High Market Share)
- 4.3.2. Cash Cows (Low Growth, High Market Share)
- 4.3.3. Question Mark (High Growth, Low Market Share)
- 4.3.4. Dogs (Low Growth, Low Market Share)
- 4.4. Ansoff Matrix Analysis
- 4.5. Supply Chain Analysis
- 4.6. Regulatory Landscape
- 4.7. Current Market Potential and Opportunity Assessment (TAM–SAM–SOM Framework)
- 4.8. PRI Analyst Note
- 4.1. Porters Five Forces
- 5. Market Analysis, Insights and Forecast 2021-2033
- 5.1. Market Analysis, Insights and Forecast - by End Use
- 5.1.1. Ceramic
- 5.1.1.1. Sanitary Ware
- 5.1.1.2. Wall and Floor Tiles
- 5.1.1.3. Tableware
- 5.1.1.4. Bricks
- 5.1.1.5. Other Ce
- 5.1.2. Non-ceramic
- 5.1.2.1. Adhesives and Sealants
- 5.1.2.2. Rubbers and Plastics
- 5.1.2.3. Fertilizers and Insecticides
- 5.1.2.4. Other Non-ceramics
- 5.1.1. Ceramic
- 5.2. Market Analysis, Insights and Forecast - by Region
- 5.2.1. Asia Pacific
- 5.2.2. North America
- 5.2.3. Europe
- 5.2.4. South America
- 5.2.5. Middle East and Africa
- 5.1. Market Analysis, Insights and Forecast - by End Use
- 6. Global Ball Clay Industry Analysis, Insights and Forecast, 2021-2033
- 6.1. Market Analysis, Insights and Forecast - by End Use
- 6.1.1. Ceramic
- 6.1.1.1. Sanitary Ware
- 6.1.1.2. Wall and Floor Tiles
- 6.1.1.3. Tableware
- 6.1.1.4. Bricks
- 6.1.1.5. Other Ce
- 6.1.2. Non-ceramic
- 6.1.2.1. Adhesives and Sealants
- 6.1.2.2. Rubbers and Plastics
- 6.1.2.3. Fertilizers and Insecticides
- 6.1.2.4. Other Non-ceramics
- 6.1.1. Ceramic
- 6.1. Market Analysis, Insights and Forecast - by End Use
- 7. Asia Pacific Ball Clay Industry Analysis, Insights and Forecast, 2020-2032
- 7.1. Market Analysis, Insights and Forecast - by End Use
- 7.1.1. Ceramic
- 7.1.1.1. Sanitary Ware
- 7.1.1.2. Wall and Floor Tiles
- 7.1.1.3. Tableware
- 7.1.1.4. Bricks
- 7.1.1.5. Other Ce
- 7.1.2. Non-ceramic
- 7.1.2.1. Adhesives and Sealants
- 7.1.2.2. Rubbers and Plastics
- 7.1.2.3. Fertilizers and Insecticides
- 7.1.2.4. Other Non-ceramics
- 7.1.1. Ceramic
- 7.1. Market Analysis, Insights and Forecast - by End Use
- 8. North America Ball Clay Industry Analysis, Insights and Forecast, 2020-2032
- 8.1. Market Analysis, Insights and Forecast - by End Use
- 8.1.1. Ceramic
- 8.1.1.1. Sanitary Ware
- 8.1.1.2. Wall and Floor Tiles
- 8.1.1.3. Tableware
- 8.1.1.4. Bricks
- 8.1.1.5. Other Ce
- 8.1.2. Non-ceramic
- 8.1.2.1. Adhesives and Sealants
- 8.1.2.2. Rubbers and Plastics
- 8.1.2.3. Fertilizers and Insecticides
- 8.1.2.4. Other Non-ceramics
- 8.1.1. Ceramic
- 8.1. Market Analysis, Insights and Forecast - by End Use
- 9. Europe Ball Clay Industry Analysis, Insights and Forecast, 2020-2032
- 9.1. Market Analysis, Insights and Forecast - by End Use
- 9.1.1. Ceramic
- 9.1.1.1. Sanitary Ware
- 9.1.1.2. Wall and Floor Tiles
- 9.1.1.3. Tableware
- 9.1.1.4. Bricks
- 9.1.1.5. Other Ce
- 9.1.2. Non-ceramic
- 9.1.2.1. Adhesives and Sealants
- 9.1.2.2. Rubbers and Plastics
- 9.1.2.3. Fertilizers and Insecticides
- 9.1.2.4. Other Non-ceramics
- 9.1.1. Ceramic
- 9.1. Market Analysis, Insights and Forecast - by End Use
- 10. South America Ball Clay Industry Analysis, Insights and Forecast, 2020-2032
- 10.1. Market Analysis, Insights and Forecast - by End Use
- 10.1.1. Ceramic
- 10.1.1.1. Sanitary Ware
- 10.1.1.2. Wall and Floor Tiles
- 10.1.1.3. Tableware
- 10.1.1.4. Bricks
- 10.1.1.5. Other Ce
- 10.1.2. Non-ceramic
- 10.1.2.1. Adhesives and Sealants
- 10.1.2.2. Rubbers and Plastics
- 10.1.2.3. Fertilizers and Insecticides
- 10.1.2.4. Other Non-ceramics
- 10.1.1. Ceramic
- 10.1. Market Analysis, Insights and Forecast - by End Use
- 11. Middle East and Africa Ball Clay Industry Analysis, Insights and Forecast, 2020-2032
- 11.1. Market Analysis, Insights and Forecast - by End Use
- 11.1.1. Ceramic
- 11.1.1.1. Sanitary Ware
- 11.1.1.2. Wall and Floor Tiles
- 11.1.1.3. Tableware
- 11.1.1.4. Bricks
- 11.1.1.5. Other Ce
- 11.1.2. Non-ceramic
- 11.1.2.1. Adhesives and Sealants
- 11.1.2.2. Rubbers and Plastics
- 11.1.2.3. Fertilizers and Insecticides
- 11.1.2.4. Other Non-ceramics
- 11.1.1. Ceramic
- 11.1. Market Analysis, Insights and Forecast - by End Use
- 12. Competitive Analysis
- 12.1. Company Profiles
- 12.1.1 Stephan Schmidt KG
- 12.1.1.1. Company Overview
- 12.1.1.2. Products
- 12.1.1.3. Company Financials
- 12.1.1.4. SWOT Analysis
- 12.1.2 Old Hickory Clay Company
- 12.1.2.1. Company Overview
- 12.1.2.2. Products
- 12.1.2.3. Company Financials
- 12.1.2.4. SWOT Analysis
- 12.1.3 Amarnath Industries
- 12.1.3.1. Company Overview
- 12.1.3.2. Products
- 12.1.3.3. Company Financials
- 12.1.3.4. SWOT Analysis
- 12.1.4 Ashok Alco - chem Limited (AACL)
- 12.1.4.1. Company Overview
- 12.1.4.2. Products
- 12.1.4.3. Company Financials
- 12.1.4.4. SWOT Analysis
- 12.1.5 JLD Minerals
- 12.1.5.1. Company Overview
- 12.1.5.2. Products
- 12.1.5.3. Company Financials
- 12.1.5.4. SWOT Analysis
- 12.1.6 Imerys
- 12.1.6.1. Company Overview
- 12.1.6.2. Products
- 12.1.6.3. Company Financials
- 12.1.6.4. SWOT Analysis
- 12.1.7 Mota Ceramic Solutions
- 12.1.7.1. Company Overview
- 12.1.7.2. Products
- 12.1.7.3. Company Financials
- 12.1.7.4. SWOT Analysis
- 12.1.8 Modkha Marine Sdn Bhd
- 12.1.8.1. Company Overview
- 12.1.8.2. Products
- 12.1.8.3. Company Financials
- 12.1.8.4. SWOT Analysis
- 12.1.9 Gujarat Mineral Development Corporation Ltd
- 12.1.9.1. Company Overview
- 12.1.9.2. Products
- 12.1.9.3. Company Financials
- 12.1.9.4. SWOT Analysis
- 12.1.10 Sibelco
- 12.1.10.1. Company Overview
- 12.1.10.2. Products
- 12.1.10.3. Company Financials
- 12.1.10.4. SWOT Analysis
- 12.1.11 Golcha Associated (Associated Soapstone Distribution Company Pvt Ltd)
- 12.1.11.1. Company Overview
- 12.1.11.2. Products
- 12.1.11.3. Company Financials
- 12.1.11.4. SWOT Analysis
- 12.1.1 Stephan Schmidt KG
- 12.2. Market Entropy
- 12.2.1 Company's Key Areas Served
- 12.2.2 Recent Developments
- 12.3. Company Market Share Analysis 2025
- 12.3.1 Top 5 Companies Market Share Analysis
- 12.3.2 Top 3 Companies Market Share Analysis
- 12.4. List of Potential Customers
- 13. Research Methodology
List of Figures
- Figure 1: Global Ball Clay Industry Revenue Breakdown (Million, %) by Region 2025 & 2033
- Figure 2: Global Ball Clay Industry Volume Breakdown (K Tons, %) by Region 2025 & 2033
- Figure 3: Asia Pacific Ball Clay Industry Revenue (Million), by End Use 2025 & 2033
- Figure 4: Asia Pacific Ball Clay Industry Volume (K Tons), by End Use 2025 & 2033
- Figure 5: Asia Pacific Ball Clay Industry Revenue Share (%), by End Use 2025 & 2033
- Figure 6: Asia Pacific Ball Clay Industry Volume Share (%), by End Use 2025 & 2033
- Figure 7: Asia Pacific Ball Clay Industry Revenue (Million), by Country 2025 & 2033
- Figure 8: Asia Pacific Ball Clay Industry Volume (K Tons), by Country 2025 & 2033
- Figure 9: Asia Pacific Ball Clay Industry Revenue Share (%), by Country 2025 & 2033
- Figure 10: Asia Pacific Ball Clay Industry Volume Share (%), by Country 2025 & 2033
- Figure 11: North America Ball Clay Industry Revenue (Million), by End Use 2025 & 2033
- Figure 12: North America Ball Clay Industry Volume (K Tons), by End Use 2025 & 2033
- Figure 13: North America Ball Clay Industry Revenue Share (%), by End Use 2025 & 2033
- Figure 14: North America Ball Clay Industry Volume Share (%), by End Use 2025 & 2033
- Figure 15: North America Ball Clay Industry Revenue (Million), by Country 2025 & 2033
- Figure 16: North America Ball Clay Industry Volume (K Tons), by Country 2025 & 2033
- Figure 17: North America Ball Clay Industry Revenue Share (%), by Country 2025 & 2033
- Figure 18: North America Ball Clay Industry Volume Share (%), by Country 2025 & 2033
- Figure 19: Europe Ball Clay Industry Revenue (Million), by End Use 2025 & 2033
- Figure 20: Europe Ball Clay Industry Volume (K Tons), by End Use 2025 & 2033
- Figure 21: Europe Ball Clay Industry Revenue Share (%), by End Use 2025 & 2033
- Figure 22: Europe Ball Clay Industry Volume Share (%), by End Use 2025 & 2033
- Figure 23: Europe Ball Clay Industry Revenue (Million), by Country 2025 & 2033
- Figure 24: Europe Ball Clay Industry Volume (K Tons), by Country 2025 & 2033
- Figure 25: Europe Ball Clay Industry Revenue Share (%), by Country 2025 & 2033
- Figure 26: Europe Ball Clay Industry Volume Share (%), by Country 2025 & 2033
- Figure 27: South America Ball Clay Industry Revenue (Million), by End Use 2025 & 2033
- Figure 28: South America Ball Clay Industry Volume (K Tons), by End Use 2025 & 2033
- Figure 29: South America Ball Clay Industry Revenue Share (%), by End Use 2025 & 2033
- Figure 30: South America Ball Clay Industry Volume Share (%), by End Use 2025 & 2033
- Figure 31: South America Ball Clay Industry Revenue (Million), by Country 2025 & 2033
- Figure 32: South America Ball Clay Industry Volume (K Tons), by Country 2025 & 2033
- Figure 33: South America Ball Clay Industry Revenue Share (%), by Country 2025 & 2033
- Figure 34: South America Ball Clay Industry Volume Share (%), by Country 2025 & 2033
- Figure 35: Middle East and Africa Ball Clay Industry Revenue (Million), by End Use 2025 & 2033
- Figure 36: Middle East and Africa Ball Clay Industry Volume (K Tons), by End Use 2025 & 2033
- Figure 37: Middle East and Africa Ball Clay Industry Revenue Share (%), by End Use 2025 & 2033
- Figure 38: Middle East and Africa Ball Clay Industry Volume Share (%), by End Use 2025 & 2033
- Figure 39: Middle East and Africa Ball Clay Industry Revenue (Million), by Country 2025 & 2033
- Figure 40: Middle East and Africa Ball Clay Industry Volume (K Tons), by Country 2025 & 2033
- Figure 41: Middle East and Africa Ball Clay Industry Revenue Share (%), by Country 2025 & 2033
- Figure 42: Middle East and Africa Ball Clay Industry Volume Share (%), by Country 2025 & 2033
List of Tables
- Table 1: Global Ball Clay Industry Revenue Million Forecast, by End Use 2020 & 2033
- Table 2: Global Ball Clay Industry Volume K Tons Forecast, by End Use 2020 & 2033
- Table 3: Global Ball Clay Industry Revenue Million Forecast, by Region 2020 & 2033
- Table 4: Global Ball Clay Industry Volume K Tons Forecast, by Region 2020 & 2033
- Table 5: Global Ball Clay Industry Revenue Million Forecast, by End Use 2020 & 2033
- Table 6: Global Ball Clay Industry Volume K Tons Forecast, by End Use 2020 & 2033
- Table 7: Global Ball Clay Industry Revenue Million Forecast, by Country 2020 & 2033
- Table 8: Global Ball Clay Industry Volume K Tons Forecast, by Country 2020 & 2033
- Table 9: China Ball Clay Industry Revenue (Million) Forecast, by Application 2020 & 2033
- Table 10: China Ball Clay Industry Volume (K Tons) Forecast, by Application 2020 & 2033
- Table 11: India Ball Clay Industry Revenue (Million) Forecast, by Application 2020 & 2033
- Table 12: India Ball Clay Industry Volume (K Tons) Forecast, by Application 2020 & 2033
- Table 13: Japan Ball Clay Industry Revenue (Million) Forecast, by Application 2020 & 2033
- Table 14: Japan Ball Clay Industry Volume (K Tons) Forecast, by Application 2020 & 2033
- Table 15: South Korea Ball Clay Industry Revenue (Million) Forecast, by Application 2020 & 2033
- Table 16: South Korea Ball Clay Industry Volume (K Tons) Forecast, by Application 2020 & 2033
- Table 17: Rest of Asia Pacific Ball Clay Industry Revenue (Million) Forecast, by Application 2020 & 2033
- Table 18: Rest of Asia Pacific Ball Clay Industry Volume (K Tons) Forecast, by Application 2020 & 2033
- Table 19: Global Ball Clay Industry Revenue Million Forecast, by End Use 2020 & 2033
- Table 20: Global Ball Clay Industry Volume K Tons Forecast, by End Use 2020 & 2033
- Table 21: Global Ball Clay Industry Revenue Million Forecast, by Country 2020 & 2033
- Table 22: Global Ball Clay Industry Volume K Tons Forecast, by Country 2020 & 2033
- Table 23: United States Ball Clay Industry Revenue (Million) Forecast, by Application 2020 & 2033
- Table 24: United States Ball Clay Industry Volume (K Tons) Forecast, by Application 2020 & 2033
- Table 25: Canada Ball Clay Industry Revenue (Million) Forecast, by Application 2020 & 2033
- Table 26: Canada Ball Clay Industry Volume (K Tons) Forecast, by Application 2020 & 2033
- Table 27: Mexico Ball Clay Industry Revenue (Million) Forecast, by Application 2020 & 2033
- Table 28: Mexico Ball Clay Industry Volume (K Tons) Forecast, by Application 2020 & 2033
- Table 29: Global Ball Clay Industry Revenue Million Forecast, by End Use 2020 & 2033
- Table 30: Global Ball Clay Industry Volume K Tons Forecast, by End Use 2020 & 2033
- Table 31: Global Ball Clay Industry Revenue Million Forecast, by Country 2020 & 2033
- Table 32: Global Ball Clay Industry Volume K Tons Forecast, by Country 2020 & 2033
- Table 33: Germany Ball Clay Industry Revenue (Million) Forecast, by Application 2020 & 2033
- Table 34: Germany Ball Clay Industry Volume (K Tons) Forecast, by Application 2020 & 2033
- Table 35: United Kingdom Ball Clay Industry Revenue (Million) Forecast, by Application 2020 & 2033
- Table 36: United Kingdom Ball Clay Industry Volume (K Tons) Forecast, by Application 2020 & 2033
- Table 37: Italy Ball Clay Industry Revenue (Million) Forecast, by Application 2020 & 2033
- Table 38: Italy Ball Clay Industry Volume (K Tons) Forecast, by Application 2020 & 2033
- Table 39: France Ball Clay Industry Revenue (Million) Forecast, by Application 2020 & 2033
- Table 40: France Ball Clay Industry Volume (K Tons) Forecast, by Application 2020 & 2033
- Table 41: Spain Ball Clay Industry Revenue (Million) Forecast, by Application 2020 & 2033
- Table 42: Spain Ball Clay Industry Volume (K Tons) Forecast, by Application 2020 & 2033
- Table 43: Rest of Europe Ball Clay Industry Revenue (Million) Forecast, by Application 2020 & 2033
- Table 44: Rest of Europe Ball Clay Industry Volume (K Tons) Forecast, by Application 2020 & 2033
- Table 45: Global Ball Clay Industry Revenue Million Forecast, by End Use 2020 & 2033
- Table 46: Global Ball Clay Industry Volume K Tons Forecast, by End Use 2020 & 2033
- Table 47: Global Ball Clay Industry Revenue Million Forecast, by Country 2020 & 2033
- Table 48: Global Ball Clay Industry Volume K Tons Forecast, by Country 2020 & 2033
- Table 49: Brazil Ball Clay Industry Revenue (Million) Forecast, by Application 2020 & 2033
- Table 50: Brazil Ball Clay Industry Volume (K Tons) Forecast, by Application 2020 & 2033
- Table 51: Argentina Ball Clay Industry Revenue (Million) Forecast, by Application 2020 & 2033
- Table 52: Argentina Ball Clay Industry Volume (K Tons) Forecast, by Application 2020 & 2033
- Table 53: Rest of South America Ball Clay Industry Revenue (Million) Forecast, by Application 2020 & 2033
- Table 54: Rest of South America Ball Clay Industry Volume (K Tons) Forecast, by Application 2020 & 2033
- Table 55: Global Ball Clay Industry Revenue Million Forecast, by End Use 2020 & 2033
- Table 56: Global Ball Clay Industry Volume K Tons Forecast, by End Use 2020 & 2033
- Table 57: Global Ball Clay Industry Revenue Million Forecast, by Country 2020 & 2033
- Table 58: Global Ball Clay Industry Volume K Tons Forecast, by Country 2020 & 2033
- Table 59: Saudi Arabia Ball Clay Industry Revenue (Million) Forecast, by Application 2020 & 2033
- Table 60: Saudi Arabia Ball Clay Industry Volume (K Tons) Forecast, by Application 2020 & 2033
- Table 61: South Africa Ball Clay Industry Revenue (Million) Forecast, by Application 2020 & 2033
- Table 62: South Africa Ball Clay Industry Volume (K Tons) Forecast, by Application 2020 & 2033
- Table 63: Rest of Middle East and Africa Ball Clay Industry Revenue (Million) Forecast, by Application 2020 & 2033
- Table 64: Rest of Middle East and Africa Ball Clay Industry Volume (K Tons) Forecast, by Application 2020 & 2033
Frequently Asked Questions
1. What is the projected Compound Annual Growth Rate (CAGR) of the Ball Clay Industry?
The projected CAGR is approximately 5.07%.
2. Which companies are prominent players in the Ball Clay Industry?
Key companies in the market include Stephan Schmidt KG, Old Hickory Clay Company, Amarnath Industries, Ashok Alco - chem Limited (AACL), JLD Minerals, Imerys, Mota Ceramic Solutions, Modkha Marine Sdn Bhd, Gujarat Mineral Development Corporation Ltd, Sibelco, Golcha Associated (Associated Soapstone Distribution Company Pvt Ltd).
3. What are the main segments of the Ball Clay Industry?
The market segments include End Use.
4. Can you provide details about the market size?
The market size is estimated to be USD 433.33 Million as of 2022.
5. What are some drivers contributing to market growth?
Increasing Demand for Sanitary Ware in Asia-Pacific; Other Drivers.
6. What are the notable trends driving market growth?
Use of Wall and Floor Tiles in the Construction Industry.
7. Are there any restraints impacting market growth?
Availability of Substitutes for Ball Clay; Other Restraints.
8. Can you provide examples of recent developments in the market?
N/A
9. What pricing options are available for accessing the report?
Pricing options include single-user, multi-user, and enterprise licenses priced at USD 4750, USD 5250, and USD 8750 respectively.
10. Is the market size provided in terms of value or volume?
The market size is provided in terms of value, measured in Million and volume, measured in K Tons.
11. Are there any specific market keywords associated with the report?
Yes, the market keyword associated with the report is "Ball Clay Industry," which aids in identifying and referencing the specific market segment covered.
12. How do I determine which pricing option suits my needs best?
The pricing options vary based on user requirements and access needs. Individual users may opt for single-user licenses, while businesses requiring broader access may choose multi-user or enterprise licenses for cost-effective access to the report.
13. Are there any additional resources or data provided in the Ball Clay Industry report?
While the report offers comprehensive insights, it's advisable to review the specific contents or supplementary materials provided to ascertain if additional resources or data are available.
14. How can I stay updated on further developments or reports in the Ball Clay Industry?
To stay informed about further developments, trends, and reports in the Ball Clay Industry, consider subscribing to industry newsletters, following relevant companies and organizations, or regularly checking reputable industry news sources and publications.
Methodology
Step 1 - Identification of Relevant Samples Size from Population Database


Step 2 - Approaches for Defining Global Market Size (Value, Volume* & Price*)

Note*: In applicable scenarios
Step 3 - Data Sources
Primary Research
- Web Analytics
- Survey Reports
- Research Institute
- Latest Research Reports
- Opinion Leaders
Secondary Research
- Annual Reports
- White Paper
- Latest Press Release
- Industry Association
- Paid Database
- Investor Presentations

Step 4 - Data Triangulation
Involves using different sources of information in order to increase the validity of a study
These sources are likely to be stakeholders in a program - participants, other researchers, program staff, other community members, and so on.
Then we put all data in single framework & apply various statistical tools to find out the dynamic on the market.
During the analysis stage, feedback from the stakeholder groups would be compared to determine areas of agreement as well as areas of divergence