

Key Insights
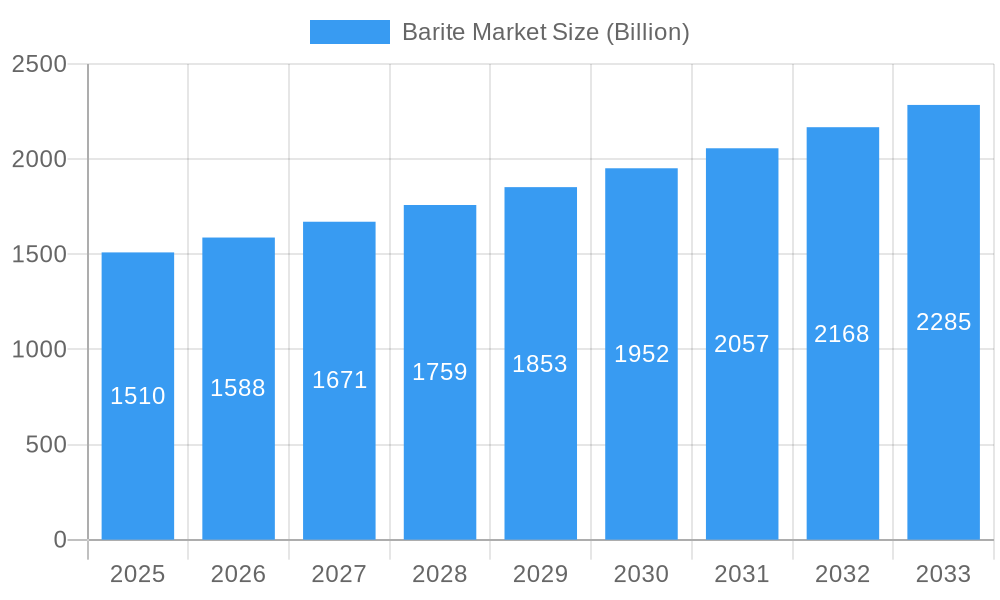
The global barite market, valued at $1.51 billion in 2025, is projected to experience steady growth, driven by a Compound Annual Growth Rate (CAGR) of 5.1% from 2025 to 2033. This expansion is fueled by several key factors. Firstly, the burgeoning oil and gas industry, a major consumer of barite as a drilling fluid weighting agent, continues to drive demand. Increasing exploration and production activities, particularly in regions like the Middle East and Asia-Pacific, significantly contribute to market growth. Secondly, the chemical industry's reliance on barite as a filler and pigment in various applications, such as paints and coatings, further boosts market size. The construction sector also plays a significant role, utilizing barite in applications such as acoustic and radiation shielding materials. Finally, advancements in barite processing technologies leading to higher-quality products and efficient extraction methods are contributing to market expansion. However, fluctuations in oil prices and the availability of alternative weighting agents pose potential challenges to market growth.
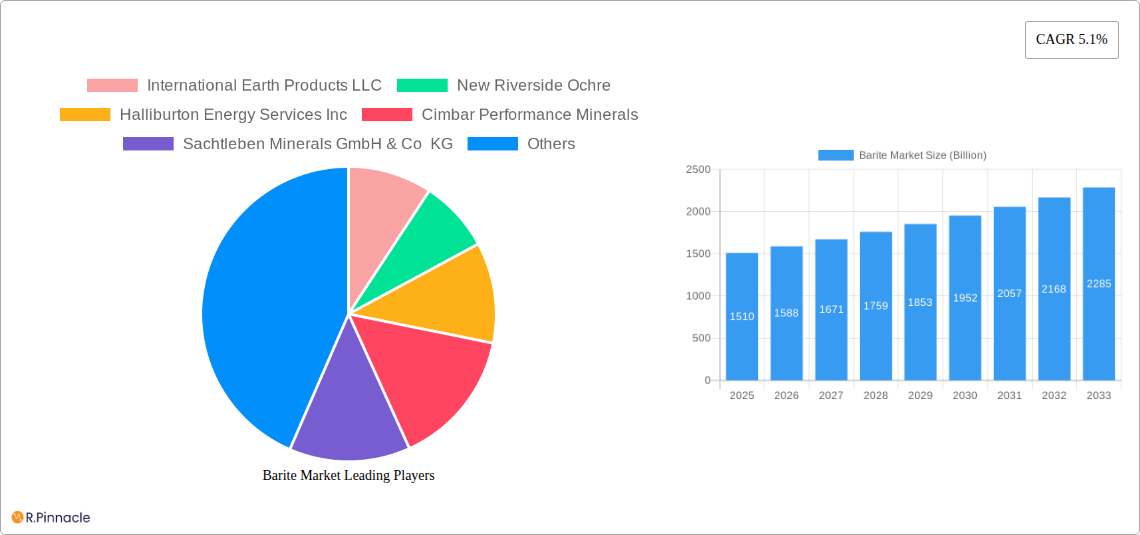
Barite Market Market Size (In Billion)
Despite the challenges, the market segmentation reveals opportunities. The oil and gas end-user segment currently dominates the market due to its substantial consumption of barite in drilling operations. However, growth in the chemical and fillers segments is anticipated, driven by increasing demand for high-performance materials in diverse industries. Further, the bedded barite type currently holds a larger market share compared to vein and cavity filling or residual barite; however, the latter types are likely to experience increased demand in niche applications, contributing to market diversification. The geographical landscape is diverse; North America and Europe currently hold significant market share, but rapid industrialization in Asia-Pacific, particularly in China and India, is expected to drive significant future growth in this region. The competitive landscape is shaped by both large multinational corporations and smaller regional players, each offering specialized products and services catering to specific market segments.
Barite Market Company Market Share
Barite Market Report: Comprehensive Analysis & Forecast 2019-2033
This comprehensive report provides an in-depth analysis of the global Barite Market, offering valuable insights for industry professionals, investors, and stakeholders. With a study period spanning 2019-2033, a base year of 2025, and a forecast period of 2025-2033, this report offers a complete understanding of the market's historical performance, current status, and future trajectory. The market is projected to reach a valuation of xx Billion by 2033, exhibiting a CAGR of xx%.
Barite Market Structure & Innovation Trends
This section analyzes the competitive landscape, including market concentration, innovation drivers, regulatory frameworks, product substitutes, end-user demographics, and M&A activities within the Barite market. The market exhibits a moderately concentrated structure, with a few key players holding significant market share. For instance, Halliburton Energy Services Inc. and Schlumberger Limited collectively hold an estimated xx% of the global market share in 2025.
- Market Concentration: The market is characterized by a mix of large multinational corporations and smaller regional players. The top five players account for approximately xx% of the global market.
- Innovation Drivers: Technological advancements in drilling fluids and the growing demand for high-quality barite in various industries drive innovation. Research and development efforts focus on improving barite purity, particle size distribution, and overall performance.
- Regulatory Frameworks: Environmental regulations regarding mining and waste disposal significantly impact the industry. Compliance with these regulations increases operational costs and influences market dynamics.
- Product Substitutes: While barite has few perfect substitutes, other weighting agents are used in niche applications. Competition from these substitutes is relatively low but needs monitoring.
- End-User Demographics: The Oil and Gas industry remains the dominant end-user, accounting for xx Billion in revenue in 2025. This sector's growth directly influences the barite market.
- M&A Activities: Recent M&A activities, such as the Cimbar and Newpark agreement, indicate consolidation within the market. The total value of M&A deals in the barite industry from 2019 to 2024 was approximately xx Billion, with an average deal value of xx Billion.
Barite Market Dynamics & Trends
The Barite market's growth is driven by the expanding oil and gas exploration and production activities globally. The increasing demand for drilling fluids, coupled with the barite's unique properties as a weighting agent, fuels market expansion. Technological advancements in drilling techniques and the development of high-performance barite products also contribute to the market's growth. However, price volatility of barite and fluctuations in crude oil prices present challenges. The market is witnessing a shift towards sustainable and environmentally friendly barite sourcing and processing methods. Consumer preferences are increasingly focused on high-quality, consistent barite supply with minimal environmental impact. Competitive dynamics are shaped by factors such as pricing strategies, technological capabilities, and geographical reach. The market is expected to experience a CAGR of xx% during the forecast period, driven by a xx% market penetration increase in the oil and gas sector.
Dominant Regions & Segments in Barite Market
The report identifies key regions and segments dominating the Barite market. Analysis reveals the significant contribution of specific geographical areas and end-user applications.
- Leading Region: [Insert Dominant Region, e.g., North America] exhibits robust market growth due to significant oil and gas activities.
- Dominant End-User Industries: Oil and Gas remains the largest segment, followed by Chemical and Fillers industries. The oil and gas sector is expected to maintain its dominance due to persistent exploration and production activities.
- Dominant Barite Type: Bedded barite commands the largest market share, driven by its abundance and cost-effectiveness. However, Vein and Cavity Filling barite also holds significant market share due to its superior quality in specific applications.
Key Drivers in Dominant Regions:
- North America: Strong oil and gas exploration, well-established infrastructure, and supportive government policies.
- [Insert Second Dominant Region]: [Insert Key Drivers, e.g., growing industrialization, rising demand from the chemical sector].
Barite Market Product Innovations
Recent product innovations focus on enhancing barite purity, improving particle size consistency, and developing specialized barite blends for specific applications. These advancements cater to the demand for higher-performance drilling fluids and improved efficiency in various industries. The development of environmentally friendly barite processing techniques is also gaining traction, reflecting the increasing focus on sustainability within the industry. These innovations offer competitive advantages by improving product quality, lowering operational costs, and enhancing environmental compliance.
Report Scope & Segmentation Analysis
This report segments the Barite market by End-user Industry (Oil and Gas, Chemical, Fillers) and by Type (Bedded, Vein and Cavity Filling, Residual). Each segment's growth projections, market sizes, and competitive dynamics are extensively analyzed.
- Oil and Gas: This segment holds the largest market share and is expected to experience steady growth driven by ongoing exploration and production activities.
- Chemical: The chemical industry uses barite in various applications, with growth projected based on the expanding chemical manufacturing sector.
- Fillers: This segment is growing at a moderate pace, driven by the increased use of barite as a filler in various products.
- Bedded: This type of barite dominates due to its abundance and cost-effectiveness.
- Vein and Cavity Filling: This segment commands a premium due to its superior quality and specific applications.
- Residual: This segment has a smaller market share but is seeing growth from specialized applications.
Key Drivers of Barite Market Growth
The Barite market's growth is driven by several factors, including the increasing demand from the oil and gas sector, particularly in offshore drilling. Expanding chemical and industrial applications further contribute to growth. Government initiatives promoting industrialization and infrastructure development create opportunities for barite utilization in various construction and manufacturing processes. Moreover, technological advancements in drilling fluids and the development of specialized barite blends fuel market expansion.
Challenges in the Barite Market Sector
The Barite market faces challenges, including price volatility of raw materials, fluctuating demand from the oil and gas sector, and stringent environmental regulations. Supply chain disruptions and geopolitical instability can also impact market stability. Competition from substitute materials and rising production costs pose additional challenges, impacting profitability and potentially hindering growth. These factors need careful management for sustained market development.
Emerging Opportunities in Barite Market
Emerging opportunities in the Barite market lie in the development of environmentally friendly barite processing techniques and the exploration of new applications in emerging economies. Expanding into high-growth sectors, such as renewable energy and advanced materials, presents significant potential. The development of value-added barite products and partnerships to improve supply chain efficiency can provide additional growth opportunities.
Leading Players in the Barite Market Market
- Halliburton Energy Services Inc
- Schlumberger Limited
- Baker Hughes Inc
- International Earth Products LLC
- New Riverside Ochre
- Cimbar Performance Minerals
- Sachtleben Minerals GmbH & Co KG
- Guizhou Tianhong Mining Co
- Newpark Resources Inc
- Guizhou Saboman Import and Export Co Ltd
- Andhra Pradesh Mineral Development Corporation Ltd
- Baribright Co Ltd
- PVS Global Trade Private Limited
- Pulapathuri
- The Kish Company Inc
- Zhongrun Barium Industry Co Ltd
Key Developments in Barite Market Industry
- October 2022: Cimbar and Newpark entered a long-term barite supply agreement, strengthening their market position and securing long-term supply for Newpark's US drilling fluids business. This deal significantly impacts market dynamics by consolidating supply and potentially impacting pricing.
- May 2022: Andhra Pradesh Mineral Development Corporation (APMDC) signed a MoU to supply barite to US firms, highlighting growing international demand and the potential for increased exports from India. This significantly bolsters the market's global supply chain and demonstrates an emerging opportunity for international trade.
Future Outlook for Barite Market Market
The future outlook for the Barite market remains positive, driven by sustained growth in the oil and gas sector and the expansion of industrial applications. Technological advancements, sustainable sourcing initiatives, and strategic partnerships will shape the market's future trajectory. Exploring new markets and applications, particularly in emerging economies, will create further growth opportunities. The market is poised for significant expansion, presenting attractive investment prospects and fueling industry growth.
Barite Market Segmentation
-
1. Type
- 1.1. Bedded
- 1.2. Vein and Cavity Filling
- 1.3. Residual
-
2. End-user Industry
- 2.1. Oil and Gas
- 2.2. Chemical
- 2.3. Fillers
Barite Market Segmentation By Geography
-
1. Asia Pacific
- 1.1. China
- 1.2. India
- 1.3. Japan
- 1.4. South Korea
- 1.5. Malaysia
- 1.6. Thailand
- 1.7. Indonesia
- 1.8. Vietnam
- 1.9. Rest of Asia Pacific
-
2. North America
- 2.1. United States
- 2.2. Canada
- 2.3. Mexico
-
3. Europe
- 3.1. Germany
- 3.2. United Kingdom
- 3.3. France
- 3.4. Italy
- 3.5. Spain
- 3.6. Nordic
- 3.7. Turkey
- 3.8. Russia
- 3.9. Rest of Europe
-
4. South America
- 4.1. Brazil
- 4.2. Argentina
- 4.3. Colombia
- 4.4. Rest of South America
-
5. Middle East and Africa
- 5.1. Saudi Arabia
- 5.2. South Africa
- 5.3. Nigeria
- 5.4. Qatar
- 5.5. Egypt
- 5.6. United Arab Emirates
- 5.7. Rest of Middle East and Africa
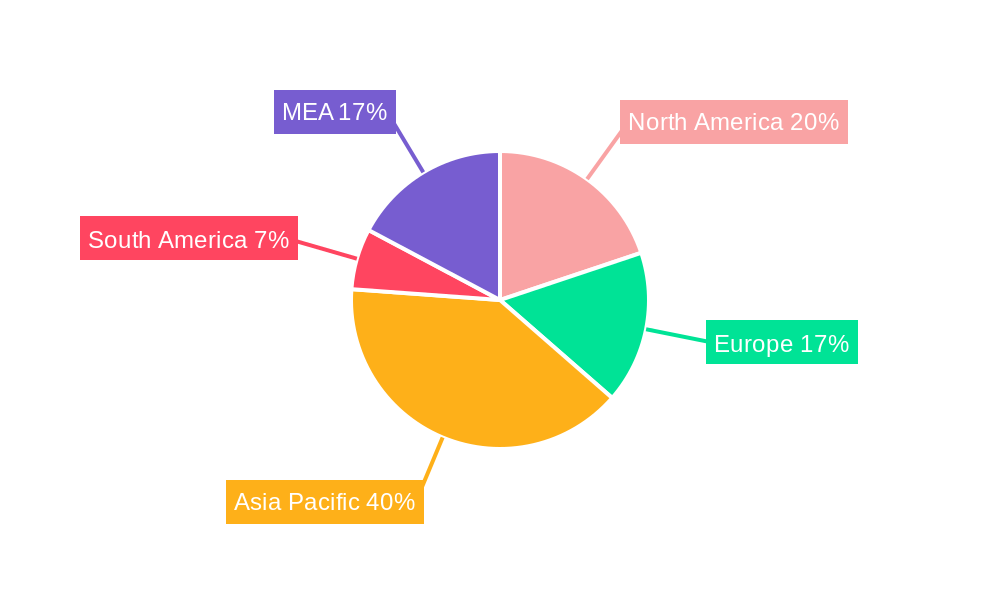
Barite Market Regional Market Share
Geographic Coverage of Barite Market
Barite Market REPORT HIGHLIGHTS
| Aspects | Details |
|---|---|
| Study Period | 2020-2034 |
| Base Year | 2025 |
| Estimated Year | 2026 |
| Forecast Period | 2026-2034 |
| Historical Period | 2020-2025 |
| Growth Rate | CAGR of 5.1% from 2020-2034 |
| Segmentation |
|
Table of Contents
- 1. Introduction
- 1.1. Research Scope
- 1.2. Market Segmentation
- 1.3. Research Objective
- 1.4. Definitions and Assumptions
- 2. Executive Summary
- 2.1. Market Snapshot
- 3. Market Dynamics
- 3.1. Market Drivers
- 3.2. Market Restrains
- 3.3. Market Trends
- 3.4. Market Opportunities
- 4. Market Factor Analysis
- 4.1. Porters Five Forces
- 4.1.1. Bargaining Power of Suppliers
- 4.1.2. Bargaining Power of Buyers
- 4.1.3. Threat of New Entrants
- 4.1.4. Threat of Substitutes
- 4.1.5. Competitive Rivalry
- 4.2. PESTEL analysis
- 4.3. BCG Analysis
- 4.3.1. Stars (High Growth, High Market Share)
- 4.3.2. Cash Cows (Low Growth, High Market Share)
- 4.3.3. Question Mark (High Growth, Low Market Share)
- 4.3.4. Dogs (Low Growth, Low Market Share)
- 4.4. Ansoff Matrix Analysis
- 4.5. Supply Chain Analysis
- 4.6. Regulatory Landscape
- 4.7. Current Market Potential and Opportunity Assessment (TAM–SAM–SOM Framework)
- 4.8. PRI Analyst Note
- 4.1. Porters Five Forces
- 5. Market Analysis, Insights and Forecast 2021-2033
- 5.1. Market Analysis, Insights and Forecast - by Type
- 5.1.1. Bedded
- 5.1.2. Vein and Cavity Filling
- 5.1.3. Residual
- 5.2. Market Analysis, Insights and Forecast - by End-user Industry
- 5.2.1. Oil and Gas
- 5.2.2. Chemical
- 5.2.3. Fillers
- 5.3. Market Analysis, Insights and Forecast - by Region
- 5.3.1. Asia Pacific
- 5.3.2. North America
- 5.3.3. Europe
- 5.3.4. South America
- 5.3.5. Middle East and Africa
- 5.1. Market Analysis, Insights and Forecast - by Type
- 6. Global Barite Market Analysis, Insights and Forecast, 2021-2033
- 6.1. Market Analysis, Insights and Forecast - by Type
- 6.1.1. Bedded
- 6.1.2. Vein and Cavity Filling
- 6.1.3. Residual
- 6.2. Market Analysis, Insights and Forecast - by End-user Industry
- 6.2.1. Oil and Gas
- 6.2.2. Chemical
- 6.2.3. Fillers
- 6.1. Market Analysis, Insights and Forecast - by Type
- 7. Asia Pacific Barite Market Analysis, Insights and Forecast, 2020-2032
- 7.1. Market Analysis, Insights and Forecast - by Type
- 7.1.1. Bedded
- 7.1.2. Vein and Cavity Filling
- 7.1.3. Residual
- 7.2. Market Analysis, Insights and Forecast - by End-user Industry
- 7.2.1. Oil and Gas
- 7.2.2. Chemical
- 7.2.3. Fillers
- 7.1. Market Analysis, Insights and Forecast - by Type
- 8. North America Barite Market Analysis, Insights and Forecast, 2020-2032
- 8.1. Market Analysis, Insights and Forecast - by Type
- 8.1.1. Bedded
- 8.1.2. Vein and Cavity Filling
- 8.1.3. Residual
- 8.2. Market Analysis, Insights and Forecast - by End-user Industry
- 8.2.1. Oil and Gas
- 8.2.2. Chemical
- 8.2.3. Fillers
- 8.1. Market Analysis, Insights and Forecast - by Type
- 9. Europe Barite Market Analysis, Insights and Forecast, 2020-2032
- 9.1. Market Analysis, Insights and Forecast - by Type
- 9.1.1. Bedded
- 9.1.2. Vein and Cavity Filling
- 9.1.3. Residual
- 9.2. Market Analysis, Insights and Forecast - by End-user Industry
- 9.2.1. Oil and Gas
- 9.2.2. Chemical
- 9.2.3. Fillers
- 9.1. Market Analysis, Insights and Forecast - by Type
- 10. South America Barite Market Analysis, Insights and Forecast, 2020-2032
- 10.1. Market Analysis, Insights and Forecast - by Type
- 10.1.1. Bedded
- 10.1.2. Vein and Cavity Filling
- 10.1.3. Residual
- 10.2. Market Analysis, Insights and Forecast - by End-user Industry
- 10.2.1. Oil and Gas
- 10.2.2. Chemical
- 10.2.3. Fillers
- 10.1. Market Analysis, Insights and Forecast - by Type
- 11. Middle East and Africa Barite Market Analysis, Insights and Forecast, 2020-2032
- 11.1. Market Analysis, Insights and Forecast - by Type
- 11.1.1. Bedded
- 11.1.2. Vein and Cavity Filling
- 11.1.3. Residual
- 11.2. Market Analysis, Insights and Forecast - by End-user Industry
- 11.2.1. Oil and Gas
- 11.2.2. Chemical
- 11.2.3. Fillers
- 11.1. Market Analysis, Insights and Forecast - by Type
- 12. Competitive Analysis
- 12.1. Company Profiles
- 12.1.1 International Earth Products LLC
- 12.1.1.1. Company Overview
- 12.1.1.2. Products
- 12.1.1.3. Company Financials
- 12.1.1.4. SWOT Analysis
- 12.1.2 New Riverside Ochre
- 12.1.2.1. Company Overview
- 12.1.2.2. Products
- 12.1.2.3. Company Financials
- 12.1.2.4. SWOT Analysis
- 12.1.3 Halliburton Energy Services Inc
- 12.1.3.1. Company Overview
- 12.1.3.2. Products
- 12.1.3.3. Company Financials
- 12.1.3.4. SWOT Analysis
- 12.1.4 Cimbar Performance Minerals
- 12.1.4.1. Company Overview
- 12.1.4.2. Products
- 12.1.4.3. Company Financials
- 12.1.4.4. SWOT Analysis
- 12.1.5 Sachtleben Minerals GmbH & Co KG
- 12.1.5.1. Company Overview
- 12.1.5.2. Products
- 12.1.5.3. Company Financials
- 12.1.5.4. SWOT Analysis
- 12.1.6 Guizhou Tianhong Mining Co
- 12.1.6.1. Company Overview
- 12.1.6.2. Products
- 12.1.6.3. Company Financials
- 12.1.6.4. SWOT Analysis
- 12.1.7 Newpark Resources Inc
- 12.1.7.1. Company Overview
- 12.1.7.2. Products
- 12.1.7.3. Company Financials
- 12.1.7.4. SWOT Analysis
- 12.1.8 Guizhou Saboman Import and Export Co Ltd
- 12.1.8.1. Company Overview
- 12.1.8.2. Products
- 12.1.8.3. Company Financials
- 12.1.8.4. SWOT Analysis
- 12.1.9 Andhra Pradesh Mineral Development Corporation Ltd
- 12.1.9.1. Company Overview
- 12.1.9.2. Products
- 12.1.9.3. Company Financials
- 12.1.9.4. SWOT Analysis
- 12.1.10 Baribright Co Ltd
- 12.1.10.1. Company Overview
- 12.1.10.2. Products
- 12.1.10.3. Company Financials
- 12.1.10.4. SWOT Analysis
- 12.1.11 PVS Global Trade Private Limited
- 12.1.11.1. Company Overview
- 12.1.11.2. Products
- 12.1.11.3. Company Financials
- 12.1.11.4. SWOT Analysis
- 12.1.12 Schlumberger Limited
- 12.1.12.1. Company Overview
- 12.1.12.2. Products
- 12.1.12.3. Company Financials
- 12.1.12.4. SWOT Analysis
- 12.1.13 Pulapathuri
- 12.1.13.1. Company Overview
- 12.1.13.2. Products
- 12.1.13.3. Company Financials
- 12.1.13.4. SWOT Analysis
- 12.1.14 Baker Hughes Inc
- 12.1.14.1. Company Overview
- 12.1.14.2. Products
- 12.1.14.3. Company Financials
- 12.1.14.4. SWOT Analysis
- 12.1.15 The Kish Company Inc
- 12.1.15.1. Company Overview
- 12.1.15.2. Products
- 12.1.15.3. Company Financials
- 12.1.15.4. SWOT Analysis
- 12.1.16 Zhongrun Barium Industry Co Ltd
- 12.1.16.1. Company Overview
- 12.1.16.2. Products
- 12.1.16.3. Company Financials
- 12.1.16.4. SWOT Analysis
- 12.1.1 International Earth Products LLC
- 12.2. Market Entropy
- 12.2.1 Company's Key Areas Served
- 12.2.2 Recent Developments
- 12.3. Company Market Share Analysis 2025
- 12.3.1 Top 5 Companies Market Share Analysis
- 12.3.2 Top 3 Companies Market Share Analysis
- 12.4. List of Potential Customers
- 13. Research Methodology
List of Figures
- Figure 1: Global Barite Market Revenue Breakdown (Billion, %) by Region 2025 & 2033
- Figure 2: Global Barite Market Volume Breakdown (K Tons, %) by Region 2025 & 2033
- Figure 3: Asia Pacific Barite Market Revenue (Billion), by Type 2025 & 2033
- Figure 4: Asia Pacific Barite Market Volume (K Tons), by Type 2025 & 2033
- Figure 5: Asia Pacific Barite Market Revenue Share (%), by Type 2025 & 2033
- Figure 6: Asia Pacific Barite Market Volume Share (%), by Type 2025 & 2033
- Figure 7: Asia Pacific Barite Market Revenue (Billion), by End-user Industry 2025 & 2033
- Figure 8: Asia Pacific Barite Market Volume (K Tons), by End-user Industry 2025 & 2033
- Figure 9: Asia Pacific Barite Market Revenue Share (%), by End-user Industry 2025 & 2033
- Figure 10: Asia Pacific Barite Market Volume Share (%), by End-user Industry 2025 & 2033
- Figure 11: Asia Pacific Barite Market Revenue (Billion), by Country 2025 & 2033
- Figure 12: Asia Pacific Barite Market Volume (K Tons), by Country 2025 & 2033
- Figure 13: Asia Pacific Barite Market Revenue Share (%), by Country 2025 & 2033
- Figure 14: Asia Pacific Barite Market Volume Share (%), by Country 2025 & 2033
- Figure 15: North America Barite Market Revenue (Billion), by Type 2025 & 2033
- Figure 16: North America Barite Market Volume (K Tons), by Type 2025 & 2033
- Figure 17: North America Barite Market Revenue Share (%), by Type 2025 & 2033
- Figure 18: North America Barite Market Volume Share (%), by Type 2025 & 2033
- Figure 19: North America Barite Market Revenue (Billion), by End-user Industry 2025 & 2033
- Figure 20: North America Barite Market Volume (K Tons), by End-user Industry 2025 & 2033
- Figure 21: North America Barite Market Revenue Share (%), by End-user Industry 2025 & 2033
- Figure 22: North America Barite Market Volume Share (%), by End-user Industry 2025 & 2033
- Figure 23: North America Barite Market Revenue (Billion), by Country 2025 & 2033
- Figure 24: North America Barite Market Volume (K Tons), by Country 2025 & 2033
- Figure 25: North America Barite Market Revenue Share (%), by Country 2025 & 2033
- Figure 26: North America Barite Market Volume Share (%), by Country 2025 & 2033
- Figure 27: Europe Barite Market Revenue (Billion), by Type 2025 & 2033
- Figure 28: Europe Barite Market Volume (K Tons), by Type 2025 & 2033
- Figure 29: Europe Barite Market Revenue Share (%), by Type 2025 & 2033
- Figure 30: Europe Barite Market Volume Share (%), by Type 2025 & 2033
- Figure 31: Europe Barite Market Revenue (Billion), by End-user Industry 2025 & 2033
- Figure 32: Europe Barite Market Volume (K Tons), by End-user Industry 2025 & 2033
- Figure 33: Europe Barite Market Revenue Share (%), by End-user Industry 2025 & 2033
- Figure 34: Europe Barite Market Volume Share (%), by End-user Industry 2025 & 2033
- Figure 35: Europe Barite Market Revenue (Billion), by Country 2025 & 2033
- Figure 36: Europe Barite Market Volume (K Tons), by Country 2025 & 2033
- Figure 37: Europe Barite Market Revenue Share (%), by Country 2025 & 2033
- Figure 38: Europe Barite Market Volume Share (%), by Country 2025 & 2033
- Figure 39: South America Barite Market Revenue (Billion), by Type 2025 & 2033
- Figure 40: South America Barite Market Volume (K Tons), by Type 2025 & 2033
- Figure 41: South America Barite Market Revenue Share (%), by Type 2025 & 2033
- Figure 42: South America Barite Market Volume Share (%), by Type 2025 & 2033
- Figure 43: South America Barite Market Revenue (Billion), by End-user Industry 2025 & 2033
- Figure 44: South America Barite Market Volume (K Tons), by End-user Industry 2025 & 2033
- Figure 45: South America Barite Market Revenue Share (%), by End-user Industry 2025 & 2033
- Figure 46: South America Barite Market Volume Share (%), by End-user Industry 2025 & 2033
- Figure 47: South America Barite Market Revenue (Billion), by Country 2025 & 2033
- Figure 48: South America Barite Market Volume (K Tons), by Country 2025 & 2033
- Figure 49: South America Barite Market Revenue Share (%), by Country 2025 & 2033
- Figure 50: South America Barite Market Volume Share (%), by Country 2025 & 2033
- Figure 51: Middle East and Africa Barite Market Revenue (Billion), by Type 2025 & 2033
- Figure 52: Middle East and Africa Barite Market Volume (K Tons), by Type 2025 & 2033
- Figure 53: Middle East and Africa Barite Market Revenue Share (%), by Type 2025 & 2033
- Figure 54: Middle East and Africa Barite Market Volume Share (%), by Type 2025 & 2033
- Figure 55: Middle East and Africa Barite Market Revenue (Billion), by End-user Industry 2025 & 2033
- Figure 56: Middle East and Africa Barite Market Volume (K Tons), by End-user Industry 2025 & 2033
- Figure 57: Middle East and Africa Barite Market Revenue Share (%), by End-user Industry 2025 & 2033
- Figure 58: Middle East and Africa Barite Market Volume Share (%), by End-user Industry 2025 & 2033
- Figure 59: Middle East and Africa Barite Market Revenue (Billion), by Country 2025 & 2033
- Figure 60: Middle East and Africa Barite Market Volume (K Tons), by Country 2025 & 2033
- Figure 61: Middle East and Africa Barite Market Revenue Share (%), by Country 2025 & 2033
- Figure 62: Middle East and Africa Barite Market Volume Share (%), by Country 2025 & 2033
List of Tables
- Table 1: Global Barite Market Revenue Billion Forecast, by Type 2020 & 2033
- Table 2: Global Barite Market Volume K Tons Forecast, by Type 2020 & 2033
- Table 3: Global Barite Market Revenue Billion Forecast, by End-user Industry 2020 & 2033
- Table 4: Global Barite Market Volume K Tons Forecast, by End-user Industry 2020 & 2033
- Table 5: Global Barite Market Revenue Billion Forecast, by Region 2020 & 2033
- Table 6: Global Barite Market Volume K Tons Forecast, by Region 2020 & 2033
- Table 7: Global Barite Market Revenue Billion Forecast, by Type 2020 & 2033
- Table 8: Global Barite Market Volume K Tons Forecast, by Type 2020 & 2033
- Table 9: Global Barite Market Revenue Billion Forecast, by End-user Industry 2020 & 2033
- Table 10: Global Barite Market Volume K Tons Forecast, by End-user Industry 2020 & 2033
- Table 11: Global Barite Market Revenue Billion Forecast, by Country 2020 & 2033
- Table 12: Global Barite Market Volume K Tons Forecast, by Country 2020 & 2033
- Table 13: China Barite Market Revenue (Billion) Forecast, by Application 2020 & 2033
- Table 14: China Barite Market Volume (K Tons) Forecast, by Application 2020 & 2033
- Table 15: India Barite Market Revenue (Billion) Forecast, by Application 2020 & 2033
- Table 16: India Barite Market Volume (K Tons) Forecast, by Application 2020 & 2033
- Table 17: Japan Barite Market Revenue (Billion) Forecast, by Application 2020 & 2033
- Table 18: Japan Barite Market Volume (K Tons) Forecast, by Application 2020 & 2033
- Table 19: South Korea Barite Market Revenue (Billion) Forecast, by Application 2020 & 2033
- Table 20: South Korea Barite Market Volume (K Tons) Forecast, by Application 2020 & 2033
- Table 21: Malaysia Barite Market Revenue (Billion) Forecast, by Application 2020 & 2033
- Table 22: Malaysia Barite Market Volume (K Tons) Forecast, by Application 2020 & 2033
- Table 23: Thailand Barite Market Revenue (Billion) Forecast, by Application 2020 & 2033
- Table 24: Thailand Barite Market Volume (K Tons) Forecast, by Application 2020 & 2033
- Table 25: Indonesia Barite Market Revenue (Billion) Forecast, by Application 2020 & 2033
- Table 26: Indonesia Barite Market Volume (K Tons) Forecast, by Application 2020 & 2033
- Table 27: Vietnam Barite Market Revenue (Billion) Forecast, by Application 2020 & 2033
- Table 28: Vietnam Barite Market Volume (K Tons) Forecast, by Application 2020 & 2033
- Table 29: Rest of Asia Pacific Barite Market Revenue (Billion) Forecast, by Application 2020 & 2033
- Table 30: Rest of Asia Pacific Barite Market Volume (K Tons) Forecast, by Application 2020 & 2033
- Table 31: Global Barite Market Revenue Billion Forecast, by Type 2020 & 2033
- Table 32: Global Barite Market Volume K Tons Forecast, by Type 2020 & 2033
- Table 33: Global Barite Market Revenue Billion Forecast, by End-user Industry 2020 & 2033
- Table 34: Global Barite Market Volume K Tons Forecast, by End-user Industry 2020 & 2033
- Table 35: Global Barite Market Revenue Billion Forecast, by Country 2020 & 2033
- Table 36: Global Barite Market Volume K Tons Forecast, by Country 2020 & 2033
- Table 37: United States Barite Market Revenue (Billion) Forecast, by Application 2020 & 2033
- Table 38: United States Barite Market Volume (K Tons) Forecast, by Application 2020 & 2033
- Table 39: Canada Barite Market Revenue (Billion) Forecast, by Application 2020 & 2033
- Table 40: Canada Barite Market Volume (K Tons) Forecast, by Application 2020 & 2033
- Table 41: Mexico Barite Market Revenue (Billion) Forecast, by Application 2020 & 2033
- Table 42: Mexico Barite Market Volume (K Tons) Forecast, by Application 2020 & 2033
- Table 43: Global Barite Market Revenue Billion Forecast, by Type 2020 & 2033
- Table 44: Global Barite Market Volume K Tons Forecast, by Type 2020 & 2033
- Table 45: Global Barite Market Revenue Billion Forecast, by End-user Industry 2020 & 2033
- Table 46: Global Barite Market Volume K Tons Forecast, by End-user Industry 2020 & 2033
- Table 47: Global Barite Market Revenue Billion Forecast, by Country 2020 & 2033
- Table 48: Global Barite Market Volume K Tons Forecast, by Country 2020 & 2033
- Table 49: Germany Barite Market Revenue (Billion) Forecast, by Application 2020 & 2033
- Table 50: Germany Barite Market Volume (K Tons) Forecast, by Application 2020 & 2033
- Table 51: United Kingdom Barite Market Revenue (Billion) Forecast, by Application 2020 & 2033
- Table 52: United Kingdom Barite Market Volume (K Tons) Forecast, by Application 2020 & 2033
- Table 53: France Barite Market Revenue (Billion) Forecast, by Application 2020 & 2033
- Table 54: France Barite Market Volume (K Tons) Forecast, by Application 2020 & 2033
- Table 55: Italy Barite Market Revenue (Billion) Forecast, by Application 2020 & 2033
- Table 56: Italy Barite Market Volume (K Tons) Forecast, by Application 2020 & 2033
- Table 57: Spain Barite Market Revenue (Billion) Forecast, by Application 2020 & 2033
- Table 58: Spain Barite Market Volume (K Tons) Forecast, by Application 2020 & 2033
- Table 59: Nordic Barite Market Revenue (Billion) Forecast, by Application 2020 & 2033
- Table 60: Nordic Barite Market Volume (K Tons) Forecast, by Application 2020 & 2033
- Table 61: Turkey Barite Market Revenue (Billion) Forecast, by Application 2020 & 2033
- Table 62: Turkey Barite Market Volume (K Tons) Forecast, by Application 2020 & 2033
- Table 63: Russia Barite Market Revenue (Billion) Forecast, by Application 2020 & 2033
- Table 64: Russia Barite Market Volume (K Tons) Forecast, by Application 2020 & 2033
- Table 65: Rest of Europe Barite Market Revenue (Billion) Forecast, by Application 2020 & 2033
- Table 66: Rest of Europe Barite Market Volume (K Tons) Forecast, by Application 2020 & 2033
- Table 67: Global Barite Market Revenue Billion Forecast, by Type 2020 & 2033
- Table 68: Global Barite Market Volume K Tons Forecast, by Type 2020 & 2033
- Table 69: Global Barite Market Revenue Billion Forecast, by End-user Industry 2020 & 2033
- Table 70: Global Barite Market Volume K Tons Forecast, by End-user Industry 2020 & 2033
- Table 71: Global Barite Market Revenue Billion Forecast, by Country 2020 & 2033
- Table 72: Global Barite Market Volume K Tons Forecast, by Country 2020 & 2033
- Table 73: Brazil Barite Market Revenue (Billion) Forecast, by Application 2020 & 2033
- Table 74: Brazil Barite Market Volume (K Tons) Forecast, by Application 2020 & 2033
- Table 75: Argentina Barite Market Revenue (Billion) Forecast, by Application 2020 & 2033
- Table 76: Argentina Barite Market Volume (K Tons) Forecast, by Application 2020 & 2033
- Table 77: Colombia Barite Market Revenue (Billion) Forecast, by Application 2020 & 2033
- Table 78: Colombia Barite Market Volume (K Tons) Forecast, by Application 2020 & 2033
- Table 79: Rest of South America Barite Market Revenue (Billion) Forecast, by Application 2020 & 2033
- Table 80: Rest of South America Barite Market Volume (K Tons) Forecast, by Application 2020 & 2033
- Table 81: Global Barite Market Revenue Billion Forecast, by Type 2020 & 2033
- Table 82: Global Barite Market Volume K Tons Forecast, by Type 2020 & 2033
- Table 83: Global Barite Market Revenue Billion Forecast, by End-user Industry 2020 & 2033
- Table 84: Global Barite Market Volume K Tons Forecast, by End-user Industry 2020 & 2033
- Table 85: Global Barite Market Revenue Billion Forecast, by Country 2020 & 2033
- Table 86: Global Barite Market Volume K Tons Forecast, by Country 2020 & 2033
- Table 87: Saudi Arabia Barite Market Revenue (Billion) Forecast, by Application 2020 & 2033
- Table 88: Saudi Arabia Barite Market Volume (K Tons) Forecast, by Application 2020 & 2033
- Table 89: South Africa Barite Market Revenue (Billion) Forecast, by Application 2020 & 2033
- Table 90: South Africa Barite Market Volume (K Tons) Forecast, by Application 2020 & 2033
- Table 91: Nigeria Barite Market Revenue (Billion) Forecast, by Application 2020 & 2033
- Table 92: Nigeria Barite Market Volume (K Tons) Forecast, by Application 2020 & 2033
- Table 93: Qatar Barite Market Revenue (Billion) Forecast, by Application 2020 & 2033
- Table 94: Qatar Barite Market Volume (K Tons) Forecast, by Application 2020 & 2033
- Table 95: Egypt Barite Market Revenue (Billion) Forecast, by Application 2020 & 2033
- Table 96: Egypt Barite Market Volume (K Tons) Forecast, by Application 2020 & 2033
- Table 97: United Arab Emirates Barite Market Revenue (Billion) Forecast, by Application 2020 & 2033
- Table 98: United Arab Emirates Barite Market Volume (K Tons) Forecast, by Application 2020 & 2033
- Table 99: Rest of Middle East and Africa Barite Market Revenue (Billion) Forecast, by Application 2020 & 2033
- Table 100: Rest of Middle East and Africa Barite Market Volume (K Tons) Forecast, by Application 2020 & 2033
Frequently Asked Questions
1. What is the projected Compound Annual Growth Rate (CAGR) of the Barite Market?
The projected CAGR is approximately 5.1%.
2. Which companies are prominent players in the Barite Market?
Key companies in the market include International Earth Products LLC, New Riverside Ochre, Halliburton Energy Services Inc, Cimbar Performance Minerals, Sachtleben Minerals GmbH & Co KG, Guizhou Tianhong Mining Co, Newpark Resources Inc, Guizhou Saboman Import and Export Co Ltd, Andhra Pradesh Mineral Development Corporation Ltd, Baribright Co Ltd, PVS Global Trade Private Limited, Schlumberger Limited, Pulapathuri, Baker Hughes Inc, The Kish Company Inc, Zhongrun Barium Industry Co Ltd.
3. What are the main segments of the Barite Market?
The market segments include Type, End-user Industry.
4. Can you provide details about the market size?
The market size is estimated to be USD 1.51 Billion as of 2022.
5. What are some drivers contributing to market growth?
Rapidly Increasing Demand from the Oil and Gas Industry; Growing Use in the Plastic Industry.
6. What are the notable trends driving market growth?
High Demand from the Oil and Gas Industry.
7. Are there any restraints impacting market growth?
Availability of Close Substitutes; Other Restraints.
8. Can you provide examples of recent developments in the market?
October 2022: Cimbar and Newpark entered a long-term barite supply agreement for Newpark's US drilling fluids business, with an initial term of four years following the closing of the transaction.
9. What pricing options are available for accessing the report?
Pricing options include single-user, multi-user, and enterprise licenses priced at USD 4750, USD 5250, and USD 8750 respectively.
10. Is the market size provided in terms of value or volume?
The market size is provided in terms of value, measured in Billion and volume, measured in K Tons.
11. Are there any specific market keywords associated with the report?
Yes, the market keyword associated with the report is "Barite Market," which aids in identifying and referencing the specific market segment covered.
12. How do I determine which pricing option suits my needs best?
The pricing options vary based on user requirements and access needs. Individual users may opt for single-user licenses, while businesses requiring broader access may choose multi-user or enterprise licenses for cost-effective access to the report.
13. Are there any additional resources or data provided in the Barite Market report?
While the report offers comprehensive insights, it's advisable to review the specific contents or supplementary materials provided to ascertain if additional resources or data are available.
14. How can I stay updated on further developments or reports in the Barite Market?
To stay informed about further developments, trends, and reports in the Barite Market, consider subscribing to industry newsletters, following relevant companies and organizations, or regularly checking reputable industry news sources and publications.
Methodology
Step 1 - Identification of Relevant Samples Size from Population Database


Step 2 - Approaches for Defining Global Market Size (Value, Volume* & Price*)

Note*: In applicable scenarios
Step 3 - Data Sources
Primary Research
- Web Analytics
- Survey Reports
- Research Institute
- Latest Research Reports
- Opinion Leaders
Secondary Research
- Annual Reports
- White Paper
- Latest Press Release
- Industry Association
- Paid Database
- Investor Presentations

Step 4 - Data Triangulation
Involves using different sources of information in order to increase the validity of a study
These sources are likely to be stakeholders in a program - participants, other researchers, program staff, other community members, and so on.
Then we put all data in single framework & apply various statistical tools to find out the dynamic on the market.
During the analysis stage, feedback from the stakeholder groups would be compared to determine areas of agreement as well as areas of divergence