

Key Insights
The global barley tea market is poised for robust growth, projected to reach an estimated USD 15.15 billion by 2025. This expansion is fueled by a growing consumer preference for healthier beverage alternatives, the increasing awareness of barley tea's natural, caffeine-free, and digestion-promoting properties, and its versatile applications across the food and drink, pharmaceutical, and cosmetic industries. The market is anticipated to witness a Compound Annual Growth Rate (CAGR) of 7.46% from 2025 to 2033, indicating sustained demand. Key drivers include the rising disposable incomes in emerging economies, leading to increased spending on premium and health-conscious products, and the integration of barley tea into wellness routines. Furthermore, innovative product formulations, such as mixed teas offering diverse flavor profiles and functional benefits, are attracting a broader consumer base. The food and beverage sector is expected to remain the dominant application segment, benefiting from barley tea's use as a refreshing standalone drink and an ingredient in various culinary preparations.

Barley Tea Market Size (In Billion)
The market's upward trajectory, however, faces certain restraints. Fluctuations in raw material prices, particularly for high-quality barley, and intense competition from established players and new entrants could pose challenges. Supply chain disruptions and the need for stringent quality control measures in production also require careful management. Despite these hurdles, the market's inherent strengths, including its natural appeal and perceived health benefits, are expected to outweigh these limitations. Regional dynamics suggest significant opportunities in Asia Pacific, driven by established tea-drinking cultures and a burgeoning health and wellness consciousness. North America and Europe are also crucial markets, with consumers actively seeking natural and functional beverages. Companies like ITO EN, Sanei Kosan Co.,Ltd., and Dongsuh are strategically positioned to capitalize on these trends through product innovation and market penetration strategies. The continued exploration of barley tea's therapeutic properties in the pharmaceutical and cosmetic sectors further underscores its long-term growth potential.

Barley Tea Company Market Share
Unleashing the Power of Barley Tea: A Comprehensive Market Intelligence Report (2019-2033)
This in-depth report offers an unparalleled analysis of the global barley tea market, providing critical insights for industry professionals seeking to navigate its evolving landscape. Spanning a study period from 2019 to 2033, with a base year of 2025 and a forecast period from 2025 to 2033, this report delivers actionable intelligence on market structure, dynamics, regional dominance, product innovations, and future growth trajectories. Leveraging high-ranking keywords, this resource is optimized for maximum search visibility, ensuring you can access critical data on market size, CAGR, competitive strategies, and emerging trends impacting companies like ITO EN, Sanei Kosan Co.,Ltd., Odani kokufun, Dongsuh, Harada Tea Processing Co.,Ltd., JIN-DA CO.,LTD, Nikken Foods, Okinawa Chosei Yakusou Headquarters, Ten Ren Tea Company, Hakubaku, Ladakhi Foods Pvt. Ltd, and Java Tea Company. Dive deep into the burgeoning applications within Food and Drink, Pharmaceutical, Cosmetic, and Other segments, and understand the dominance of Natural Tea and Mixed Tea types.
Barley Tea Market Structure & Innovation Trends
The global barley tea market exhibits a moderate level of concentration, with a few dominant players holding significant market share. Innovation is primarily driven by the pursuit of enhanced health benefits, sustainable sourcing, and novel flavor profiles. Regulatory frameworks, particularly concerning food safety and labeling standards in regions like North America and Europe, play a crucial role in market access and product development. Product substitutes, such as other herbal teas and functional beverages, pose a competitive challenge, necessitating continuous product differentiation. End-user demographics are increasingly skewed towards health-conscious consumers, millennials, and the elderly seeking natural, low-calorie alternatives. Mergers and acquisitions (M&A) activities, though not voluminous, are strategically aimed at consolidating market presence and acquiring innovative technologies. Estimated M&A deal values are projected to reach hundreds of billions, underscoring the strategic importance of consolidating market share and expanding product portfolios.
Barley Tea Market Dynamics & Trends
The barley tea market is experiencing robust growth, driven by a confluence of factors that are reshaping consumer preferences and industry strategies. The increasing global awareness of the health benefits associated with barley, including its digestive properties, antioxidant content, and potential to manage blood sugar levels, is a primary growth driver. This health-centric demand is further amplified by the rising popularity of functional beverages and the consumer shift towards natural and organic products. Technological disruptions are less about groundbreaking machinery and more about advancements in processing techniques that enhance flavor extraction, preserve nutrients, and extend shelf life, thereby improving product quality and consumer appeal. Furthermore, innovative packaging solutions that promote sustainability and convenience are gaining traction.
Consumer preferences are evolving rapidly, with a growing demand for diverse flavor options beyond the traditional roasted barley taste. This includes the incorporation of natural sweeteners, fruit infusions, and herbal blends to cater to a wider palate. The competitive dynamics are characterized by both established tea companies expanding their barley tea offerings and emerging brands focusing on niche markets and unique value propositions. Market penetration is steadily increasing, particularly in developed economies where wellness trends are deeply ingrained. The market is projected to witness a Compound Annual Growth Rate (CAGR) of approximately 6.5%, translating to an estimated market size of over two hundred billion by the forecast period's end. This growth is underpinned by strategic market penetration efforts, innovative marketing campaigns, and a widening distribution network that reaches increasingly diverse consumer segments globally. The escalating demand for plant-based and naturally functional beverages is a significant catalyst, positioning barley tea as a key player in the beverage industry's future.
Dominant Regions & Segments in Barley Tea
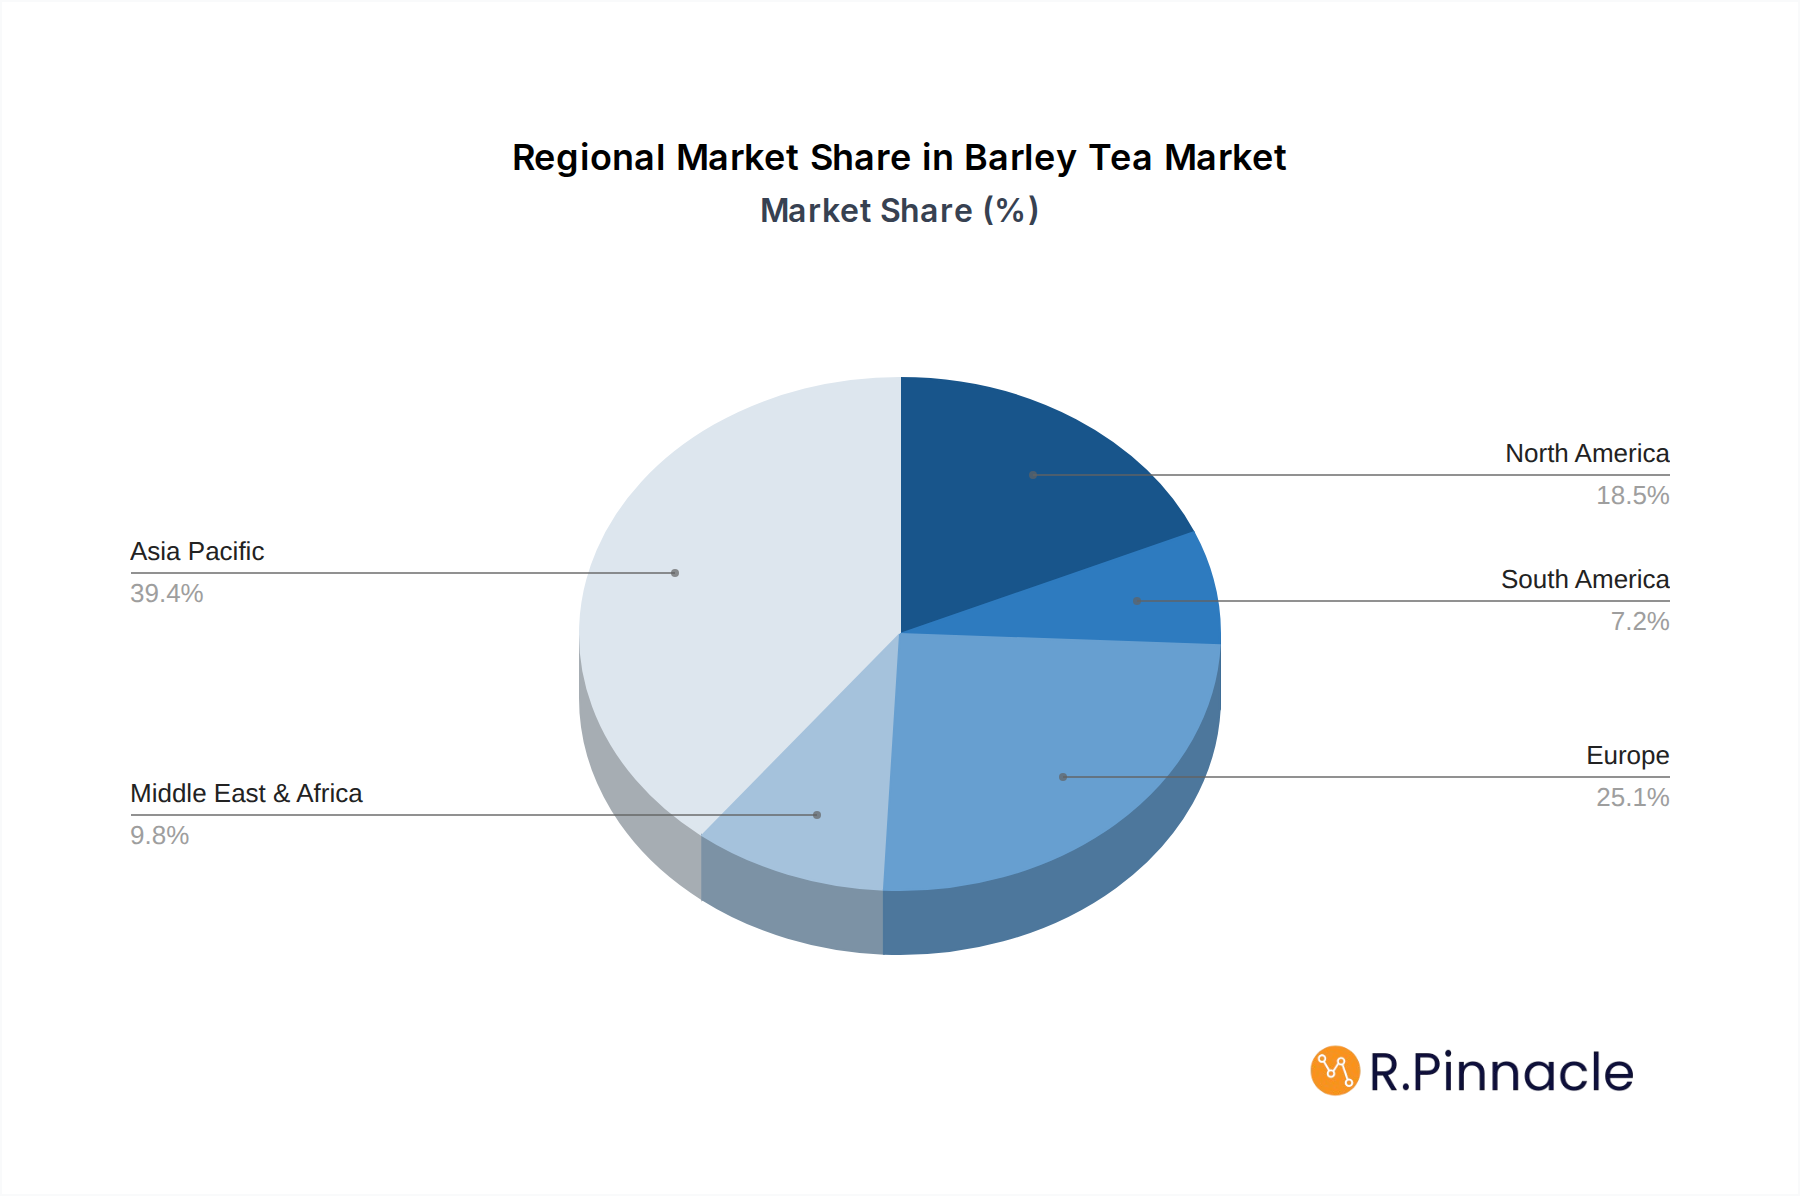
Asia Pacific stands as the dominant region in the global barley tea market, driven by deeply ingrained cultural consumption patterns and a burgeoning health-conscious population. Within this region, China and South Korea lead consumption, with long-standing traditions of incorporating barley into their diets and beverages. This regional dominance is bolstered by strong economic policies that support agricultural innovation and beverage production, alongside robust infrastructure that facilitates efficient supply chains.
Application: Food and Drink: This segment accounts for the largest market share, estimated at over ninety percent of the total market value. The widespread use of barley tea as a refreshing, calorie-free beverage, a base for other drinks, and an ingredient in culinary applications fuels its dominance. Growing demand for healthy, natural beverage options in both retail and food service sectors contributes significantly to this segment's growth.
Type: Natural Tea: Natural barley tea, derived solely from roasted barley grains, holds a substantial market share. Its perceived purity and traditional health benefits resonate strongly with consumers seeking authentic products. The growth in this segment is propelled by a desire for simple, unadulterated beverages with known health advantages.
Key Drivers for Dominance:
- Cultural Affinity: Long-standing culinary traditions and the integration of barley into daily diets in countries like South Korea and Japan.
- Health & Wellness Trends: A rising global consciousness regarding the health benefits of barley, including digestive aid and antioxidant properties, is a significant driver.
- Affordability & Accessibility: Barley tea is generally an affordable and widely accessible beverage, making it a staple for a broad consumer base.
- Growing Beverage Market: The overall expansion of the global beverage market, particularly in emerging economies, creates a fertile ground for barley tea's increased adoption.
- Product Versatility: Its adaptability in various forms, from instant powders to brewed beverages, caters to diverse consumer needs and preferences.
Barley Tea Product Innovations
Barley tea is witnessing exciting product innovations focused on enhancing its appeal and expanding its applications. Developments include flavored barley teas incorporating natural fruit essences, herbal infusions to boost specific health benefits, and ready-to-drink formats catering to convenience-seeking consumers. Technological advancements in roasting and extraction processes are improving flavor profiles and nutrient retention. Competitive advantages are being carved out through unique ingredient sourcing, sustainable packaging, and targeted marketing campaigns highlighting specific health benefits, such as improved gut health and antioxidant properties, aligning with the evolving demands of the health and wellness market.
Barley Tea Report Scope & Segmentation Analysis
This report meticulously segments the barley tea market to provide granular insights into its various facets. The Food and Drink application segment is projected to maintain its leading position, driven by the beverage industry's steady growth and consumer preference for healthy, natural alternatives. Its market size is estimated to exceed one hundred billion by 2033. The Pharmaceutical segment, though smaller, is experiencing significant growth due to barley's recognized medicinal properties and its incorporation into health supplements and functional foods, with a projected market size of over fifty billion. The Cosmetic segment, while nascent, shows potential for growth as brands explore barley's antioxidant and skin-conditioning benefits in skincare products, with an estimated market size of approximately ten billion. The Other segment, encompassing diverse applications in agriculture and industrial uses, will contribute to the overall market.
Regarding product type, Natural Tea will continue to dominate, valued at over one hundred fifty billion, reflecting its established appeal. Mixed Tea, incorporating barley with other herbs, fruits, or functional ingredients, is poised for rapid expansion, with an estimated market size of over sixty billion, driven by innovation and consumer curiosity for novel flavor profiles and enhanced benefits. Competitive dynamics within each segment vary, with established players often leading in the Food and Drink category, while niche and innovative brands are making inroads in Pharmaceutical and Mixed Tea segments.
Key Drivers of Barley Tea Growth
The growth of the barley tea market is propelled by several key drivers. The escalating global demand for healthy and natural beverages, driven by increased health consciousness and a preference for low-calorie options, is paramount. Technological advancements in processing and extraction techniques are enhancing product quality and flavor profiles, making barley tea more appealing. Favorable government initiatives promoting healthy eating and sustainable agriculture also contribute. Furthermore, the growing awareness of barley's nutritional benefits, including its digestive properties and antioxidant content, is attracting a wider consumer base, especially within the pharmaceutical and nutraceutical sectors, thereby expanding its application base beyond traditional beverages.
Challenges in the Barley Tea Sector
Despite its growth, the barley tea sector faces several challenges. Intense competition from established beverage categories and emerging functional drinks can saturate the market and dilute brand distinctiveness. Fluctuations in raw material prices, influenced by agricultural yields and global commodity markets, can impact profitability and pricing strategies. Furthermore, stringent and varied regulatory requirements across different regions regarding food safety, labeling, and health claims can pose significant hurdles for market entry and expansion. Supply chain disruptions, exacerbated by climate change and geopolitical factors, can affect the availability and cost of barley, impacting production consistency and overall market stability.
Emerging Opportunities in Barley Tea
The barley tea market is ripe with emerging opportunities. The increasing consumer interest in plant-based and functional foods presents a significant avenue for product development, focusing on fortified or enhanced barley tea varieties with added health benefits. Expansion into emerging economies with growing middle classes and increasing disposable incomes offers vast untapped market potential. Furthermore, the development of innovative product formats, such as ready-to-drink iced barley teas, concentrated brewing liquids, and flavor-infused variants, can cater to evolving consumer lifestyles and preferences. The application of barley extracts in the cosmetic and pharmaceutical industries, leveraging its antioxidant and anti-inflammatory properties, represents a significant area for future growth and diversification.
Leading Players in the Barley Tea Market
- ITO EN
- Sanei Kosan Co.,Ltd.
- Odani kokufun
- Dongsuh
- Harada Tea Processing Co.,Ltd.
- JIN-DA CO.,LTD
- Nikken Foods
- Okinawa Chosei Yakusou Headquarters
- Ten Ren Tea Company
- Hakubaku
- Ladakhi Foods Pvt. Ltd
- Java Tea Company
Key Developments in Barley Tea Industry
- 2023: Increased focus on sustainable sourcing and eco-friendly packaging solutions by major players like ITO EN.
- 2023: Launch of new mixed tea variants incorporating functional ingredients and fruit essences by Dongsuh and Harada Tea Processing Co.,Ltd.
- 2022: Expansion of distribution networks in Southeast Asian markets by JIN-DA CO.,LTD and Nikken Foods, targeting growing health-conscious demographics.
- 2022: Growing interest in barley extracts for cosmetic applications, with initial product launches by Okinawa Chosei Yakusou Headquarters.
- 2021: Strategic partnerships formed for research and development of barley's health benefits, particularly in the pharmaceutical and nutraceutical sectors.
- 2020: Rise in demand for instant barley tea formulations from Sanei Kosan Co.,Ltd. and Odani kokufun, catering to convenience-seeking consumers.
- 2019: Increased adoption of e-commerce platforms by Ten Ren Tea Company and Hakubaku for direct-to-consumer sales of barley tea products.
Future Outlook for Barley Tea Market
The future outlook for the barley tea market is exceptionally positive, driven by sustained consumer demand for healthy, natural, and functional beverages. Continuous innovation in product development, including the exploration of novel flavor combinations and enhanced health benefits, will be crucial for capturing market share. The expansion of distribution channels into untapped geographical regions and the strategic leveraging of digital marketing will further accelerate growth. As global health consciousness continues to rise, barley tea is well-positioned to become a staple beverage worldwide, with projected market growth exceeding several hundred billion over the forecast period, presenting significant opportunities for both established and emerging industry players.
Barley Tea Segmentation
-
1. Application
- 1.1. Food and Drink
- 1.2. Pharmaceutical
- 1.3. Cosmetic
- 1.4. Other
-
2. Type
- 2.1. Natural Tea
- 2.2. Mixed Tea
Barley Tea Segmentation By Geography
-
1. North America
- 1.1. United States
- 1.2. Canada
- 1.3. Mexico
-
2. South America
- 2.1. Brazil
- 2.2. Argentina
- 2.3. Rest of South America
-
3. Europe
- 3.1. United Kingdom
- 3.2. Germany
- 3.3. France
- 3.4. Italy
- 3.5. Spain
- 3.6. Russia
- 3.7. Benelux
- 3.8. Nordics
- 3.9. Rest of Europe
-
4. Middle East & Africa
- 4.1. Turkey
- 4.2. Israel
- 4.3. GCC
- 4.4. North Africa
- 4.5. South Africa
- 4.6. Rest of Middle East & Africa
-
5. Asia Pacific
- 5.1. China
- 5.2. India
- 5.3. Japan
- 5.4. South Korea
- 5.5. ASEAN
- 5.6. Oceania
- 5.7. Rest of Asia Pacific
Barley Tea Regional Market Share
Geographic Coverage of Barley Tea
Barley Tea REPORT HIGHLIGHTS
| Aspects | Details |
|---|---|
| Study Period | 2020-2034 |
| Base Year | 2025 |
| Estimated Year | 2026 |
| Forecast Period | 2026-2034 |
| Historical Period | 2020-2025 |
| Growth Rate | CAGR of 7.46% from 2020-2034 |
| Segmentation |
|
Table of Contents
- 1. Introduction
- 1.1. Research Scope
- 1.2. Market Segmentation
- 1.3. Research Methodology
- 1.4. Definitions and Assumptions
- 2. Executive Summary
- 2.1. Introduction
- 3. Market Dynamics
- 3.1. Introduction
- 3.2. Market Drivers
- 3.3. Market Restrains
- 3.4. Market Trends
- 4. Market Factor Analysis
- 4.1. Porters Five Forces
- 4.2. Supply/Value Chain
- 4.3. PESTEL analysis
- 4.4. Market Entropy
- 4.5. Patent/Trademark Analysis
- 5. Global Barley Tea Analysis, Insights and Forecast, 2020-2032
- 5.1. Market Analysis, Insights and Forecast - by Application
- 5.1.1. Food and Drink
- 5.1.2. Pharmaceutical
- 5.1.3. Cosmetic
- 5.1.4. Other
- 5.2. Market Analysis, Insights and Forecast - by Type
- 5.2.1. Natural Tea
- 5.2.2. Mixed Tea
- 5.3. Market Analysis, Insights and Forecast - by Region
- 5.3.1. North America
- 5.3.2. South America
- 5.3.3. Europe
- 5.3.4. Middle East & Africa
- 5.3.5. Asia Pacific
- 5.1. Market Analysis, Insights and Forecast - by Application
- 6. North America Barley Tea Analysis, Insights and Forecast, 2020-2032
- 6.1. Market Analysis, Insights and Forecast - by Application
- 6.1.1. Food and Drink
- 6.1.2. Pharmaceutical
- 6.1.3. Cosmetic
- 6.1.4. Other
- 6.2. Market Analysis, Insights and Forecast - by Type
- 6.2.1. Natural Tea
- 6.2.2. Mixed Tea
- 6.1. Market Analysis, Insights and Forecast - by Application
- 7. South America Barley Tea Analysis, Insights and Forecast, 2020-2032
- 7.1. Market Analysis, Insights and Forecast - by Application
- 7.1.1. Food and Drink
- 7.1.2. Pharmaceutical
- 7.1.3. Cosmetic
- 7.1.4. Other
- 7.2. Market Analysis, Insights and Forecast - by Type
- 7.2.1. Natural Tea
- 7.2.2. Mixed Tea
- 7.1. Market Analysis, Insights and Forecast - by Application
- 8. Europe Barley Tea Analysis, Insights and Forecast, 2020-2032
- 8.1. Market Analysis, Insights and Forecast - by Application
- 8.1.1. Food and Drink
- 8.1.2. Pharmaceutical
- 8.1.3. Cosmetic
- 8.1.4. Other
- 8.2. Market Analysis, Insights and Forecast - by Type
- 8.2.1. Natural Tea
- 8.2.2. Mixed Tea
- 8.1. Market Analysis, Insights and Forecast - by Application
- 9. Middle East & Africa Barley Tea Analysis, Insights and Forecast, 2020-2032
- 9.1. Market Analysis, Insights and Forecast - by Application
- 9.1.1. Food and Drink
- 9.1.2. Pharmaceutical
- 9.1.3. Cosmetic
- 9.1.4. Other
- 9.2. Market Analysis, Insights and Forecast - by Type
- 9.2.1. Natural Tea
- 9.2.2. Mixed Tea
- 9.1. Market Analysis, Insights and Forecast - by Application
- 10. Asia Pacific Barley Tea Analysis, Insights and Forecast, 2020-2032
- 10.1. Market Analysis, Insights and Forecast - by Application
- 10.1.1. Food and Drink
- 10.1.2. Pharmaceutical
- 10.1.3. Cosmetic
- 10.1.4. Other
- 10.2. Market Analysis, Insights and Forecast - by Type
- 10.2.1. Natural Tea
- 10.2.2. Mixed Tea
- 10.1. Market Analysis, Insights and Forecast - by Application
- 11. Competitive Analysis
- 11.1. Global Market Share Analysis 2025
- 11.2. Company Profiles
- 11.2.1 ITO EN
- 11.2.1.1. Overview
- 11.2.1.2. Products
- 11.2.1.3. SWOT Analysis
- 11.2.1.4. Recent Developments
- 11.2.1.5. Financials (Based on Availability)
- 11.2.2 Sanei Kosan Co.
- 11.2.2.1. Overview
- 11.2.2.2. Products
- 11.2.2.3. SWOT Analysis
- 11.2.2.4. Recent Developments
- 11.2.2.5. Financials (Based on Availability)
- 11.2.3 Ltd.
- 11.2.3.1. Overview
- 11.2.3.2. Products
- 11.2.3.3. SWOT Analysis
- 11.2.3.4. Recent Developments
- 11.2.3.5. Financials (Based on Availability)
- 11.2.4 Odani kokufun
- 11.2.4.1. Overview
- 11.2.4.2. Products
- 11.2.4.3. SWOT Analysis
- 11.2.4.4. Recent Developments
- 11.2.4.5. Financials (Based on Availability)
- 11.2.5 Dongsuh
- 11.2.5.1. Overview
- 11.2.5.2. Products
- 11.2.5.3. SWOT Analysis
- 11.2.5.4. Recent Developments
- 11.2.5.5. Financials (Based on Availability)
- 11.2.6 Harada Tea Processing Co.
- 11.2.6.1. Overview
- 11.2.6.2. Products
- 11.2.6.3. SWOT Analysis
- 11.2.6.4. Recent Developments
- 11.2.6.5. Financials (Based on Availability)
- 11.2.7 Ltd.
- 11.2.7.1. Overview
- 11.2.7.2. Products
- 11.2.7.3. SWOT Analysis
- 11.2.7.4. Recent Developments
- 11.2.7.5. Financials (Based on Availability)
- 11.2.8 JIN-DA CO.
- 11.2.8.1. Overview
- 11.2.8.2. Products
- 11.2.8.3. SWOT Analysis
- 11.2.8.4. Recent Developments
- 11.2.8.5. Financials (Based on Availability)
- 11.2.9 LTD
- 11.2.9.1. Overview
- 11.2.9.2. Products
- 11.2.9.3. SWOT Analysis
- 11.2.9.4. Recent Developments
- 11.2.9.5. Financials (Based on Availability)
- 11.2.10 Nikken Foods
- 11.2.10.1. Overview
- 11.2.10.2. Products
- 11.2.10.3. SWOT Analysis
- 11.2.10.4. Recent Developments
- 11.2.10.5. Financials (Based on Availability)
- 11.2.11 Okinawa Chosei Yakusou Headquarters
- 11.2.11.1. Overview
- 11.2.11.2. Products
- 11.2.11.3. SWOT Analysis
- 11.2.11.4. Recent Developments
- 11.2.11.5. Financials (Based on Availability)
- 11.2.12 Ten Ren Tea Company
- 11.2.12.1. Overview
- 11.2.12.2. Products
- 11.2.12.3. SWOT Analysis
- 11.2.12.4. Recent Developments
- 11.2.12.5. Financials (Based on Availability)
- 11.2.13 Hakubaku
- 11.2.13.1. Overview
- 11.2.13.2. Products
- 11.2.13.3. SWOT Analysis
- 11.2.13.4. Recent Developments
- 11.2.13.5. Financials (Based on Availability)
- 11.2.14 Ladakhi Foods Pvt. Ltd
- 11.2.14.1. Overview
- 11.2.14.2. Products
- 11.2.14.3. SWOT Analysis
- 11.2.14.4. Recent Developments
- 11.2.14.5. Financials (Based on Availability)
- 11.2.15 Java Tea Company
- 11.2.15.1. Overview
- 11.2.15.2. Products
- 11.2.15.3. SWOT Analysis
- 11.2.15.4. Recent Developments
- 11.2.15.5. Financials (Based on Availability)
- 11.2.1 ITO EN
List of Figures
- Figure 1: Global Barley Tea Revenue Breakdown (undefined, %) by Region 2025 & 2033
- Figure 2: Global Barley Tea Volume Breakdown (K, %) by Region 2025 & 2033
- Figure 3: North America Barley Tea Revenue (undefined), by Application 2025 & 2033
- Figure 4: North America Barley Tea Volume (K), by Application 2025 & 2033
- Figure 5: North America Barley Tea Revenue Share (%), by Application 2025 & 2033
- Figure 6: North America Barley Tea Volume Share (%), by Application 2025 & 2033
- Figure 7: North America Barley Tea Revenue (undefined), by Type 2025 & 2033
- Figure 8: North America Barley Tea Volume (K), by Type 2025 & 2033
- Figure 9: North America Barley Tea Revenue Share (%), by Type 2025 & 2033
- Figure 10: North America Barley Tea Volume Share (%), by Type 2025 & 2033
- Figure 11: North America Barley Tea Revenue (undefined), by Country 2025 & 2033
- Figure 12: North America Barley Tea Volume (K), by Country 2025 & 2033
- Figure 13: North America Barley Tea Revenue Share (%), by Country 2025 & 2033
- Figure 14: North America Barley Tea Volume Share (%), by Country 2025 & 2033
- Figure 15: South America Barley Tea Revenue (undefined), by Application 2025 & 2033
- Figure 16: South America Barley Tea Volume (K), by Application 2025 & 2033
- Figure 17: South America Barley Tea Revenue Share (%), by Application 2025 & 2033
- Figure 18: South America Barley Tea Volume Share (%), by Application 2025 & 2033
- Figure 19: South America Barley Tea Revenue (undefined), by Type 2025 & 2033
- Figure 20: South America Barley Tea Volume (K), by Type 2025 & 2033
- Figure 21: South America Barley Tea Revenue Share (%), by Type 2025 & 2033
- Figure 22: South America Barley Tea Volume Share (%), by Type 2025 & 2033
- Figure 23: South America Barley Tea Revenue (undefined), by Country 2025 & 2033
- Figure 24: South America Barley Tea Volume (K), by Country 2025 & 2033
- Figure 25: South America Barley Tea Revenue Share (%), by Country 2025 & 2033
- Figure 26: South America Barley Tea Volume Share (%), by Country 2025 & 2033
- Figure 27: Europe Barley Tea Revenue (undefined), by Application 2025 & 2033
- Figure 28: Europe Barley Tea Volume (K), by Application 2025 & 2033
- Figure 29: Europe Barley Tea Revenue Share (%), by Application 2025 & 2033
- Figure 30: Europe Barley Tea Volume Share (%), by Application 2025 & 2033
- Figure 31: Europe Barley Tea Revenue (undefined), by Type 2025 & 2033
- Figure 32: Europe Barley Tea Volume (K), by Type 2025 & 2033
- Figure 33: Europe Barley Tea Revenue Share (%), by Type 2025 & 2033
- Figure 34: Europe Barley Tea Volume Share (%), by Type 2025 & 2033
- Figure 35: Europe Barley Tea Revenue (undefined), by Country 2025 & 2033
- Figure 36: Europe Barley Tea Volume (K), by Country 2025 & 2033
- Figure 37: Europe Barley Tea Revenue Share (%), by Country 2025 & 2033
- Figure 38: Europe Barley Tea Volume Share (%), by Country 2025 & 2033
- Figure 39: Middle East & Africa Barley Tea Revenue (undefined), by Application 2025 & 2033
- Figure 40: Middle East & Africa Barley Tea Volume (K), by Application 2025 & 2033
- Figure 41: Middle East & Africa Barley Tea Revenue Share (%), by Application 2025 & 2033
- Figure 42: Middle East & Africa Barley Tea Volume Share (%), by Application 2025 & 2033
- Figure 43: Middle East & Africa Barley Tea Revenue (undefined), by Type 2025 & 2033
- Figure 44: Middle East & Africa Barley Tea Volume (K), by Type 2025 & 2033
- Figure 45: Middle East & Africa Barley Tea Revenue Share (%), by Type 2025 & 2033
- Figure 46: Middle East & Africa Barley Tea Volume Share (%), by Type 2025 & 2033
- Figure 47: Middle East & Africa Barley Tea Revenue (undefined), by Country 2025 & 2033
- Figure 48: Middle East & Africa Barley Tea Volume (K), by Country 2025 & 2033
- Figure 49: Middle East & Africa Barley Tea Revenue Share (%), by Country 2025 & 2033
- Figure 50: Middle East & Africa Barley Tea Volume Share (%), by Country 2025 & 2033
- Figure 51: Asia Pacific Barley Tea Revenue (undefined), by Application 2025 & 2033
- Figure 52: Asia Pacific Barley Tea Volume (K), by Application 2025 & 2033
- Figure 53: Asia Pacific Barley Tea Revenue Share (%), by Application 2025 & 2033
- Figure 54: Asia Pacific Barley Tea Volume Share (%), by Application 2025 & 2033
- Figure 55: Asia Pacific Barley Tea Revenue (undefined), by Type 2025 & 2033
- Figure 56: Asia Pacific Barley Tea Volume (K), by Type 2025 & 2033
- Figure 57: Asia Pacific Barley Tea Revenue Share (%), by Type 2025 & 2033
- Figure 58: Asia Pacific Barley Tea Volume Share (%), by Type 2025 & 2033
- Figure 59: Asia Pacific Barley Tea Revenue (undefined), by Country 2025 & 2033
- Figure 60: Asia Pacific Barley Tea Volume (K), by Country 2025 & 2033
- Figure 61: Asia Pacific Barley Tea Revenue Share (%), by Country 2025 & 2033
- Figure 62: Asia Pacific Barley Tea Volume Share (%), by Country 2025 & 2033
List of Tables
- Table 1: Global Barley Tea Revenue undefined Forecast, by Application 2020 & 2033
- Table 2: Global Barley Tea Volume K Forecast, by Application 2020 & 2033
- Table 3: Global Barley Tea Revenue undefined Forecast, by Type 2020 & 2033
- Table 4: Global Barley Tea Volume K Forecast, by Type 2020 & 2033
- Table 5: Global Barley Tea Revenue undefined Forecast, by Region 2020 & 2033
- Table 6: Global Barley Tea Volume K Forecast, by Region 2020 & 2033
- Table 7: Global Barley Tea Revenue undefined Forecast, by Application 2020 & 2033
- Table 8: Global Barley Tea Volume K Forecast, by Application 2020 & 2033
- Table 9: Global Barley Tea Revenue undefined Forecast, by Type 2020 & 2033
- Table 10: Global Barley Tea Volume K Forecast, by Type 2020 & 2033
- Table 11: Global Barley Tea Revenue undefined Forecast, by Country 2020 & 2033
- Table 12: Global Barley Tea Volume K Forecast, by Country 2020 & 2033
- Table 13: United States Barley Tea Revenue (undefined) Forecast, by Application 2020 & 2033
- Table 14: United States Barley Tea Volume (K) Forecast, by Application 2020 & 2033
- Table 15: Canada Barley Tea Revenue (undefined) Forecast, by Application 2020 & 2033
- Table 16: Canada Barley Tea Volume (K) Forecast, by Application 2020 & 2033
- Table 17: Mexico Barley Tea Revenue (undefined) Forecast, by Application 2020 & 2033
- Table 18: Mexico Barley Tea Volume (K) Forecast, by Application 2020 & 2033
- Table 19: Global Barley Tea Revenue undefined Forecast, by Application 2020 & 2033
- Table 20: Global Barley Tea Volume K Forecast, by Application 2020 & 2033
- Table 21: Global Barley Tea Revenue undefined Forecast, by Type 2020 & 2033
- Table 22: Global Barley Tea Volume K Forecast, by Type 2020 & 2033
- Table 23: Global Barley Tea Revenue undefined Forecast, by Country 2020 & 2033
- Table 24: Global Barley Tea Volume K Forecast, by Country 2020 & 2033
- Table 25: Brazil Barley Tea Revenue (undefined) Forecast, by Application 2020 & 2033
- Table 26: Brazil Barley Tea Volume (K) Forecast, by Application 2020 & 2033
- Table 27: Argentina Barley Tea Revenue (undefined) Forecast, by Application 2020 & 2033
- Table 28: Argentina Barley Tea Volume (K) Forecast, by Application 2020 & 2033
- Table 29: Rest of South America Barley Tea Revenue (undefined) Forecast, by Application 2020 & 2033
- Table 30: Rest of South America Barley Tea Volume (K) Forecast, by Application 2020 & 2033
- Table 31: Global Barley Tea Revenue undefined Forecast, by Application 2020 & 2033
- Table 32: Global Barley Tea Volume K Forecast, by Application 2020 & 2033
- Table 33: Global Barley Tea Revenue undefined Forecast, by Type 2020 & 2033
- Table 34: Global Barley Tea Volume K Forecast, by Type 2020 & 2033
- Table 35: Global Barley Tea Revenue undefined Forecast, by Country 2020 & 2033
- Table 36: Global Barley Tea Volume K Forecast, by Country 2020 & 2033
- Table 37: United Kingdom Barley Tea Revenue (undefined) Forecast, by Application 2020 & 2033
- Table 38: United Kingdom Barley Tea Volume (K) Forecast, by Application 2020 & 2033
- Table 39: Germany Barley Tea Revenue (undefined) Forecast, by Application 2020 & 2033
- Table 40: Germany Barley Tea Volume (K) Forecast, by Application 2020 & 2033
- Table 41: France Barley Tea Revenue (undefined) Forecast, by Application 2020 & 2033
- Table 42: France Barley Tea Volume (K) Forecast, by Application 2020 & 2033
- Table 43: Italy Barley Tea Revenue (undefined) Forecast, by Application 2020 & 2033
- Table 44: Italy Barley Tea Volume (K) Forecast, by Application 2020 & 2033
- Table 45: Spain Barley Tea Revenue (undefined) Forecast, by Application 2020 & 2033
- Table 46: Spain Barley Tea Volume (K) Forecast, by Application 2020 & 2033
- Table 47: Russia Barley Tea Revenue (undefined) Forecast, by Application 2020 & 2033
- Table 48: Russia Barley Tea Volume (K) Forecast, by Application 2020 & 2033
- Table 49: Benelux Barley Tea Revenue (undefined) Forecast, by Application 2020 & 2033
- Table 50: Benelux Barley Tea Volume (K) Forecast, by Application 2020 & 2033
- Table 51: Nordics Barley Tea Revenue (undefined) Forecast, by Application 2020 & 2033
- Table 52: Nordics Barley Tea Volume (K) Forecast, by Application 2020 & 2033
- Table 53: Rest of Europe Barley Tea Revenue (undefined) Forecast, by Application 2020 & 2033
- Table 54: Rest of Europe Barley Tea Volume (K) Forecast, by Application 2020 & 2033
- Table 55: Global Barley Tea Revenue undefined Forecast, by Application 2020 & 2033
- Table 56: Global Barley Tea Volume K Forecast, by Application 2020 & 2033
- Table 57: Global Barley Tea Revenue undefined Forecast, by Type 2020 & 2033
- Table 58: Global Barley Tea Volume K Forecast, by Type 2020 & 2033
- Table 59: Global Barley Tea Revenue undefined Forecast, by Country 2020 & 2033
- Table 60: Global Barley Tea Volume K Forecast, by Country 2020 & 2033
- Table 61: Turkey Barley Tea Revenue (undefined) Forecast, by Application 2020 & 2033
- Table 62: Turkey Barley Tea Volume (K) Forecast, by Application 2020 & 2033
- Table 63: Israel Barley Tea Revenue (undefined) Forecast, by Application 2020 & 2033
- Table 64: Israel Barley Tea Volume (K) Forecast, by Application 2020 & 2033
- Table 65: GCC Barley Tea Revenue (undefined) Forecast, by Application 2020 & 2033
- Table 66: GCC Barley Tea Volume (K) Forecast, by Application 2020 & 2033
- Table 67: North Africa Barley Tea Revenue (undefined) Forecast, by Application 2020 & 2033
- Table 68: North Africa Barley Tea Volume (K) Forecast, by Application 2020 & 2033
- Table 69: South Africa Barley Tea Revenue (undefined) Forecast, by Application 2020 & 2033
- Table 70: South Africa Barley Tea Volume (K) Forecast, by Application 2020 & 2033
- Table 71: Rest of Middle East & Africa Barley Tea Revenue (undefined) Forecast, by Application 2020 & 2033
- Table 72: Rest of Middle East & Africa Barley Tea Volume (K) Forecast, by Application 2020 & 2033
- Table 73: Global Barley Tea Revenue undefined Forecast, by Application 2020 & 2033
- Table 74: Global Barley Tea Volume K Forecast, by Application 2020 & 2033
- Table 75: Global Barley Tea Revenue undefined Forecast, by Type 2020 & 2033
- Table 76: Global Barley Tea Volume K Forecast, by Type 2020 & 2033
- Table 77: Global Barley Tea Revenue undefined Forecast, by Country 2020 & 2033
- Table 78: Global Barley Tea Volume K Forecast, by Country 2020 & 2033
- Table 79: China Barley Tea Revenue (undefined) Forecast, by Application 2020 & 2033
- Table 80: China Barley Tea Volume (K) Forecast, by Application 2020 & 2033
- Table 81: India Barley Tea Revenue (undefined) Forecast, by Application 2020 & 2033
- Table 82: India Barley Tea Volume (K) Forecast, by Application 2020 & 2033
- Table 83: Japan Barley Tea Revenue (undefined) Forecast, by Application 2020 & 2033
- Table 84: Japan Barley Tea Volume (K) Forecast, by Application 2020 & 2033
- Table 85: South Korea Barley Tea Revenue (undefined) Forecast, by Application 2020 & 2033
- Table 86: South Korea Barley Tea Volume (K) Forecast, by Application 2020 & 2033
- Table 87: ASEAN Barley Tea Revenue (undefined) Forecast, by Application 2020 & 2033
- Table 88: ASEAN Barley Tea Volume (K) Forecast, by Application 2020 & 2033
- Table 89: Oceania Barley Tea Revenue (undefined) Forecast, by Application 2020 & 2033
- Table 90: Oceania Barley Tea Volume (K) Forecast, by Application 2020 & 2033
- Table 91: Rest of Asia Pacific Barley Tea Revenue (undefined) Forecast, by Application 2020 & 2033
- Table 92: Rest of Asia Pacific Barley Tea Volume (K) Forecast, by Application 2020 & 2033
Frequently Asked Questions
1. What is the projected Compound Annual Growth Rate (CAGR) of the Barley Tea?
The projected CAGR is approximately 7.46%.
2. Which companies are prominent players in the Barley Tea?
Key companies in the market include ITO EN, Sanei Kosan Co., Ltd., Odani kokufun, Dongsuh, Harada Tea Processing Co., Ltd., JIN-DA CO., LTD, Nikken Foods, Okinawa Chosei Yakusou Headquarters, Ten Ren Tea Company, Hakubaku, Ladakhi Foods Pvt. Ltd, Java Tea Company.
3. What are the main segments of the Barley Tea?
The market segments include Application, Type.
4. Can you provide details about the market size?
The market size is estimated to be USD XXX N/A as of 2022.
5. What are some drivers contributing to market growth?
N/A
6. What are the notable trends driving market growth?
N/A
7. Are there any restraints impacting market growth?
N/A
8. Can you provide examples of recent developments in the market?
N/A
9. What pricing options are available for accessing the report?
Pricing options include single-user, multi-user, and enterprise licenses priced at USD 3950.00, USD 5925.00, and USD 7900.00 respectively.
10. Is the market size provided in terms of value or volume?
The market size is provided in terms of value, measured in N/A and volume, measured in K.
11. Are there any specific market keywords associated with the report?
Yes, the market keyword associated with the report is "Barley Tea," which aids in identifying and referencing the specific market segment covered.
12. How do I determine which pricing option suits my needs best?
The pricing options vary based on user requirements and access needs. Individual users may opt for single-user licenses, while businesses requiring broader access may choose multi-user or enterprise licenses for cost-effective access to the report.
13. Are there any additional resources or data provided in the Barley Tea report?
While the report offers comprehensive insights, it's advisable to review the specific contents or supplementary materials provided to ascertain if additional resources or data are available.
14. How can I stay updated on further developments or reports in the Barley Tea?
To stay informed about further developments, trends, and reports in the Barley Tea, consider subscribing to industry newsletters, following relevant companies and organizations, or regularly checking reputable industry news sources and publications.
Methodology
Step 1 - Identification of Relevant Samples Size from Population Database


Step 2 - Approaches for Defining Global Market Size (Value, Volume* & Price*)

Note*: In applicable scenarios
Step 3 - Data Sources
Primary Research
- Web Analytics
- Survey Reports
- Research Institute
- Latest Research Reports
- Opinion Leaders
Secondary Research
- Annual Reports
- White Paper
- Latest Press Release
- Industry Association
- Paid Database
- Investor Presentations

Step 4 - Data Triangulation
Involves using different sources of information in order to increase the validity of a study
These sources are likely to be stakeholders in a program - participants, other researchers, program staff, other community members, and so on.
Then we put all data in single framework & apply various statistical tools to find out the dynamic on the market.
During the analysis stage, feedback from the stakeholder groups would be compared to determine areas of agreement as well as areas of divergence