

Key Insights
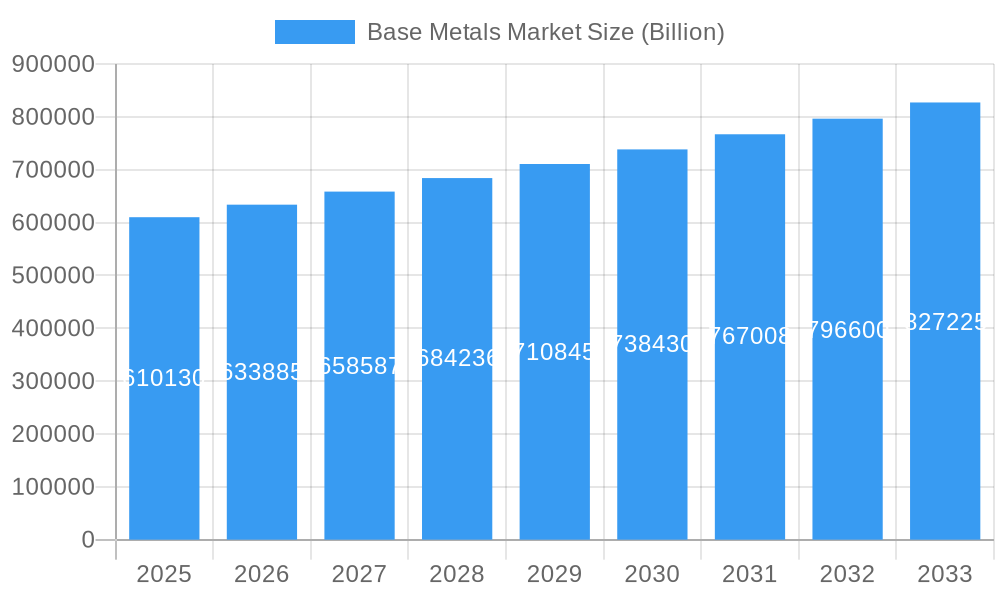
The global base metals market, valued at $610.13 billion in 2025, is projected to experience steady growth, driven by the robust expansion of key end-use sectors. Construction, fueled by infrastructure development globally, and the automotive and transportation industries, benefitting from the rise of electric vehicles and increased vehicle production, are primary growth catalysts. Furthermore, the burgeoning electronics and medical device sectors are significantly increasing demand for base metals like copper, zinc, and aluminum. The market’s growth trajectory is influenced by several factors. Increased urbanization and industrialization in developing economies like those in Asia-Pacific are creating significant demand. However, fluctuating commodity prices, environmental regulations concerning mining and processing, and potential supply chain disruptions pose considerable challenges. The market's segmentation by metal type (copper, zinc, lead, nickel, aluminum, tin) and end-user industry allows for granular analysis, revealing specific growth opportunities within each segment. For instance, the growing adoption of renewable energy technologies is expected to fuel increased demand for copper in electrical infrastructure, while the rising popularity of lightweight materials in automotive manufacturing is likely to boost aluminum demand. Competitive dynamics amongst major players like BHP, Glencore, and Rio Tinto will continue to shape market evolution, with mergers, acquisitions, and strategic partnerships influencing market share and innovation.
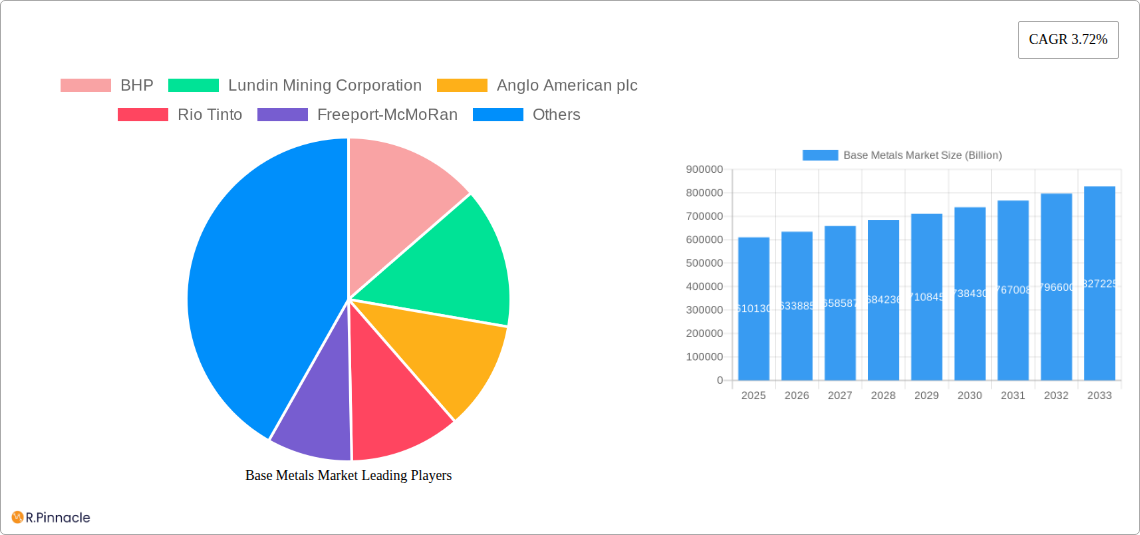
Base Metals Market Market Size (In Billion)
The forecast period (2025-2033) anticipates a continued expansion of the base metals market, though the rate of growth may fluctuate due to macroeconomic factors and geopolitical events. The established players are likely to focus on optimizing production efficiency, sustainable mining practices, and technological advancements to maintain their competitive edge. Emerging market players will likely focus on regional expansion and catering to specific niche segments. A comprehensive understanding of regional variations in demand, regulatory landscapes, and resource availability is critical for strategic decision-making within the base metals industry. Factors such as technological advancements in mining and metal processing, government policies promoting sustainable development, and the evolving global economic landscape will continue to significantly influence the base metals market's future growth and trajectory.
Base Metals Market Company Market Share
This comprehensive report provides an in-depth analysis of the Base Metals Market, projecting significant growth from 2025 to 2033. The report covers key market segments, competitive landscapes, and emerging trends, offering crucial insights for industry professionals, investors, and strategists. With a focus on actionable data and detailed forecasts, this report is an essential resource for navigating the complexities of the base metals industry. The market is valued at $XX Billion in 2025 and is projected to reach $XX Billion by 2033, exhibiting a robust CAGR of XX%.
Base Metals Market Structure & Innovation Trends
This section analyzes the market structure, encompassing market concentration, innovation drivers, regulatory frameworks, product substitutes, end-user demographics, and M&A activities. The global base metals market is characterized by a moderately concentrated structure, with a few major players holding significant market share.
Market Concentration: The top 10 players account for approximately XX% of the global market share in 2025. BHP, Rio Tinto, and Glencore are among the leading companies, each commanding a substantial portion of the market.
Innovation Drivers: The demand for sustainable and efficient production processes, coupled with the increasing adoption of advanced technologies like AI and automation, are key innovation drivers.
Regulatory Frameworks: Stringent environmental regulations and evolving trade policies significantly impact the market dynamics, influencing production costs and market access.
Product Substitutes: The emergence of alternative materials in specific applications presents a challenge to traditional base metals. However, their higher cost and performance limitations offer certain advantages to base metals.
End-User Demographics: Growth in the construction, automotive, and electronics sectors fuels substantial demand for base metals. Shifts in consumer preferences toward sustainable products also influence market demand.
M&A Activities: The industry has witnessed significant merger and acquisition (M&A) activity in recent years, with deal values exceeding $XX Billion in the last five years. These strategic mergers consolidate market share and enhance operational efficiencies. Examples include [mention specific notable M&A deals with deal values if available].
Base Metals Market Dynamics & Trends
This section delves into the key factors shaping market growth, technological disruptions, consumer preferences, and competitive dynamics. The market is driven by rising industrialization, urbanization, and infrastructure development across emerging economies. Technological advancements in extraction and processing methods further enhance efficiency and reduce costs. The growing adoption of electric vehicles and renewable energy technologies significantly boosts demand for certain base metals like copper and nickel.
Market Growth Drivers: Rising global infrastructure spending, particularly in emerging markets, is a key driver of market growth. The increasing demand for electric vehicles is another significant factor fueling the expansion of the base metals market.
Technological Disruptions: Advancements in mining technologies, such as automation and data analytics, are improving productivity and reducing environmental impact. The development of new alloys and composite materials may present future challenges or opportunities.
Consumer Preferences: The shift toward sustainable and environmentally friendly products influences both production methods and consumer demand.
Competitive Dynamics: The market is characterized by intense competition among major players, focused on cost optimization, technological innovation, and strategic partnerships.
Dominant Regions & Segments in Base Metals Market
This section identifies the leading regions and segments within the base metals market.
Dominant Regions: [Mention the dominant region – e.g., Asia-Pacific] holds the largest market share due to robust infrastructure development and industrial growth. [Mention other significant regions - e.g., North America and Europe], also contribute significantly to the overall market size. Specific countries like [mention specific countries and their growth drivers e.g., China, India, and the United States] are key contributors to regional growth.
Dominant Segments:
Type: Copper remains the dominant segment due to its widespread use in various applications. However, demand for nickel and aluminum is also growing rapidly, driven by the electrification trend.
End-User Industry: The construction sector is the largest consumer of base metals, followed by the automotive and electronics industries. Growth in these sectors directly correlates with base metal demand.
Key Drivers (Bullet Points):
- Strong economic growth in emerging markets.
- Government initiatives promoting infrastructure development.
- Rising demand from the electric vehicle and renewable energy sectors.
- Technological advancements improving mining and processing efficiency.
Base Metals Market Product Innovations
Recent innovations focus on improving the sustainability and efficiency of base metal production and enhancing the performance characteristics of the metals themselves. Developments include the use of recycled materials, improved alloying techniques, and the application of nanotechnology to enhance material properties. These innovations are driven by the increasing demand for high-performance materials and the growing emphasis on environmental sustainability.
Report Scope & Segmentation Analysis
This report segments the base metals market by type (Copper, Zinc, Lead, Nickel, Aluminum, Tin) and end-user industry (Construction, Automotive and Transportation, Electrical and Electronics, Consumer Products, Medical Devices, Others). Each segment's market size, growth projections, and competitive dynamics are analyzed individually. The report provides detailed insights into the growth potential of each segment, highlighting opportunities and challenges for businesses operating in these areas.
Key Drivers of Base Metals Market Growth
The key drivers of base metals market growth include robust global economic expansion, particularly in emerging economies, increased infrastructure investment, rising demand from the construction, automotive, and electronics industries, and government support for sustainable development initiatives. Furthermore, technological advancements in mining and processing are boosting efficiency and reducing costs.
Challenges in the Base Metals Market Sector
The base metals market faces challenges such as price volatility, fluctuating raw material costs, environmental regulations, and geopolitical risks that may disrupt supply chains. The competitive landscape also presents a challenge, with intense competition among existing players and the constant threat of new entrants. These factors pose significant risks to the sector's profitability and sustainability.
Emerging Opportunities in Base Metals Market
Emerging opportunities include the growing demand for base metals in renewable energy technologies, electric vehicles, and advanced electronics. Furthermore, the increasing focus on sustainability is creating opportunities for companies that can offer environmentally friendly production methods and recycled materials.
Leading Players in the Base Metals Market Market
- BHP
- Lundin Mining Corporation
- Anglo American plc
- Rio Tinto
- Freeport-McMoRan
- Glencore
- Jiangxi Copper Corporation
- Vale
- Vedanta Resources Limited
- Alcoa Corporation
Key Developments in Base Metals Market Industry
- [Month, Year]: [Specific development, e.g., BHP announces major investment in a new copper mine in Chile.]
- [Month, Year]: [Specific development, e.g., Glencore launches a new sustainable mining initiative.]
- [Month, Year]: [Specific development, e.g., Rio Tinto completes the acquisition of a smaller mining company.]
- [Month, Year]: [Specific development, e.g., New environmental regulations are implemented in [country/region].]
Future Outlook for Base Metals Market Market
The future outlook for the base metals market remains positive, driven by long-term growth in key end-user industries and the increasing adoption of sustainable technologies. Strategic investments in research and development, coupled with a focus on operational efficiency and sustainability, will be crucial for success in this dynamic and evolving market. The market is poised for substantial expansion, driven by the aforementioned trends and further technological advancements.
Base Metals Market Segmentation
-
1. Type
- 1.1. Copper
- 1.2. Zinc
- 1.3. Lead
- 1.4. Nickel
- 1.5. Aluminum
- 1.6. Tin
-
2. End-user Industry
- 2.1. Construction
- 2.2. Automotive and Transportation
- 2.3. Electrical and Electronics
- 2.4. Consumer Products
- 2.5. Medical Devices
- 2.6. Other End-user Industries
Base Metals Market Segmentation By Geography
-
1. Asia Pacific
- 1.1. China
- 1.2. India
- 1.3. Japan
- 1.4. South Korea
- 1.5. Malaysia
- 1.6. Thailand
- 1.7. Indonesia
- 1.8. Vietnam
- 1.9. Rest of Asia Pacific
-
2. North America
- 2.1. United States
- 2.2. Canada
- 2.3. Mexico
-
3. Europe
- 3.1. Germany
- 3.2. United Kingdom
- 3.3. France
- 3.4. Italy
- 3.5. Spain
- 3.6. NORDIC Countries
- 3.7. Turkey
- 3.8. Russia
- 3.9. Rest of Europe
-
4. South America
- 4.1. Brazil
- 4.2. Argentina
- 4.3. Colombia
- 4.4. Rest of South America
- 5. Middle East
-
6. Saudi Arabia
- 6.1. Qatar
- 6.2. United Arab Emirates
- 6.3. Nigeria
- 6.4. Egypt
- 6.5. South Africa
- 6.6. Rest of Middle East
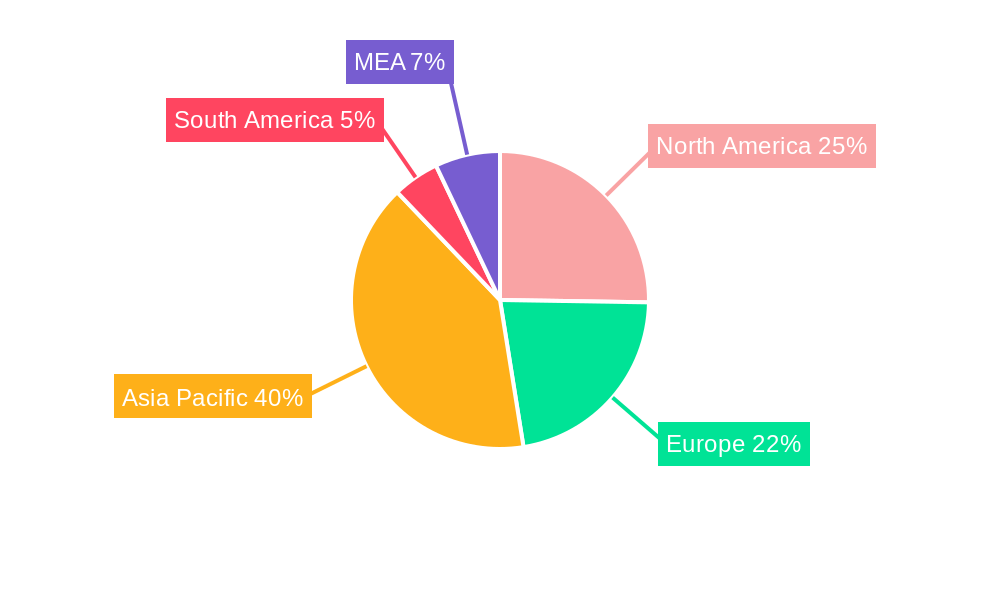
Base Metals Market Regional Market Share
Geographic Coverage of Base Metals Market
Base Metals Market REPORT HIGHLIGHTS
| Aspects | Details |
|---|---|
| Study Period | 2020-2034 |
| Base Year | 2025 |
| Estimated Year | 2026 |
| Forecast Period | 2026-2034 |
| Historical Period | 2020-2025 |
| Growth Rate | CAGR of 3.72% from 2020-2034 |
| Segmentation |
|
Table of Contents
- 1. Introduction
- 1.1. Research Scope
- 1.2. Market Segmentation
- 1.3. Research Objective
- 1.4. Definitions and Assumptions
- 2. Executive Summary
- 2.1. Market Snapshot
- 3. Market Dynamics
- 3.1. Market Drivers
- 3.2. Market Restrains
- 3.3. Market Trends
- 3.4. Market Opportunities
- 4. Market Factor Analysis
- 4.1. Porters Five Forces
- 4.1.1. Bargaining Power of Suppliers
- 4.1.2. Bargaining Power of Buyers
- 4.1.3. Threat of New Entrants
- 4.1.4. Threat of Substitutes
- 4.1.5. Competitive Rivalry
- 4.2. PESTEL analysis
- 4.3. BCG Analysis
- 4.3.1. Stars (High Growth, High Market Share)
- 4.3.2. Cash Cows (Low Growth, High Market Share)
- 4.3.3. Question Mark (High Growth, Low Market Share)
- 4.3.4. Dogs (Low Growth, Low Market Share)
- 4.4. Ansoff Matrix Analysis
- 4.5. Supply Chain Analysis
- 4.6. Regulatory Landscape
- 4.7. Current Market Potential and Opportunity Assessment (TAM–SAM–SOM Framework)
- 4.8. PRI Analyst Note
- 4.1. Porters Five Forces
- 5. Market Analysis, Insights and Forecast 2021-2033
- 5.1. Market Analysis, Insights and Forecast - by Type
- 5.1.1. Copper
- 5.1.2. Zinc
- 5.1.3. Lead
- 5.1.4. Nickel
- 5.1.5. Aluminum
- 5.1.6. Tin
- 5.2. Market Analysis, Insights and Forecast - by End-user Industry
- 5.2.1. Construction
- 5.2.2. Automotive and Transportation
- 5.2.3. Electrical and Electronics
- 5.2.4. Consumer Products
- 5.2.5. Medical Devices
- 5.2.6. Other End-user Industries
- 5.3. Market Analysis, Insights and Forecast - by Region
- 5.3.1. Asia Pacific
- 5.3.2. North America
- 5.3.3. Europe
- 5.3.4. South America
- 5.3.5. Middle East
- 5.3.6. Saudi Arabia
- 5.1. Market Analysis, Insights and Forecast - by Type
- 6. Global Base Metals Market Analysis, Insights and Forecast, 2021-2033
- 6.1. Market Analysis, Insights and Forecast - by Type
- 6.1.1. Copper
- 6.1.2. Zinc
- 6.1.3. Lead
- 6.1.4. Nickel
- 6.1.5. Aluminum
- 6.1.6. Tin
- 6.2. Market Analysis, Insights and Forecast - by End-user Industry
- 6.2.1. Construction
- 6.2.2. Automotive and Transportation
- 6.2.3. Electrical and Electronics
- 6.2.4. Consumer Products
- 6.2.5. Medical Devices
- 6.2.6. Other End-user Industries
- 6.1. Market Analysis, Insights and Forecast - by Type
- 7. Asia Pacific Base Metals Market Analysis, Insights and Forecast, 2020-2032
- 7.1. Market Analysis, Insights and Forecast - by Type
- 7.1.1. Copper
- 7.1.2. Zinc
- 7.1.3. Lead
- 7.1.4. Nickel
- 7.1.5. Aluminum
- 7.1.6. Tin
- 7.2. Market Analysis, Insights and Forecast - by End-user Industry
- 7.2.1. Construction
- 7.2.2. Automotive and Transportation
- 7.2.3. Electrical and Electronics
- 7.2.4. Consumer Products
- 7.2.5. Medical Devices
- 7.2.6. Other End-user Industries
- 7.1. Market Analysis, Insights and Forecast - by Type
- 8. North America Base Metals Market Analysis, Insights and Forecast, 2020-2032
- 8.1. Market Analysis, Insights and Forecast - by Type
- 8.1.1. Copper
- 8.1.2. Zinc
- 8.1.3. Lead
- 8.1.4. Nickel
- 8.1.5. Aluminum
- 8.1.6. Tin
- 8.2. Market Analysis, Insights and Forecast - by End-user Industry
- 8.2.1. Construction
- 8.2.2. Automotive and Transportation
- 8.2.3. Electrical and Electronics
- 8.2.4. Consumer Products
- 8.2.5. Medical Devices
- 8.2.6. Other End-user Industries
- 8.1. Market Analysis, Insights and Forecast - by Type
- 9. Europe Base Metals Market Analysis, Insights and Forecast, 2020-2032
- 9.1. Market Analysis, Insights and Forecast - by Type
- 9.1.1. Copper
- 9.1.2. Zinc
- 9.1.3. Lead
- 9.1.4. Nickel
- 9.1.5. Aluminum
- 9.1.6. Tin
- 9.2. Market Analysis, Insights and Forecast - by End-user Industry
- 9.2.1. Construction
- 9.2.2. Automotive and Transportation
- 9.2.3. Electrical and Electronics
- 9.2.4. Consumer Products
- 9.2.5. Medical Devices
- 9.2.6. Other End-user Industries
- 9.1. Market Analysis, Insights and Forecast - by Type
- 10. South America Base Metals Market Analysis, Insights and Forecast, 2020-2032
- 10.1. Market Analysis, Insights and Forecast - by Type
- 10.1.1. Copper
- 10.1.2. Zinc
- 10.1.3. Lead
- 10.1.4. Nickel
- 10.1.5. Aluminum
- 10.1.6. Tin
- 10.2. Market Analysis, Insights and Forecast - by End-user Industry
- 10.2.1. Construction
- 10.2.2. Automotive and Transportation
- 10.2.3. Electrical and Electronics
- 10.2.4. Consumer Products
- 10.2.5. Medical Devices
- 10.2.6. Other End-user Industries
- 10.1. Market Analysis, Insights and Forecast - by Type
- 11. Middle East Base Metals Market Analysis, Insights and Forecast, 2020-2032
- 11.1. Market Analysis, Insights and Forecast - by Type
- 11.1.1. Copper
- 11.1.2. Zinc
- 11.1.3. Lead
- 11.1.4. Nickel
- 11.1.5. Aluminum
- 11.1.6. Tin
- 11.2. Market Analysis, Insights and Forecast - by End-user Industry
- 11.2.1. Construction
- 11.2.2. Automotive and Transportation
- 11.2.3. Electrical and Electronics
- 11.2.4. Consumer Products
- 11.2.5. Medical Devices
- 11.2.6. Other End-user Industries
- 11.1. Market Analysis, Insights and Forecast - by Type
- 12. Saudi Arabia Base Metals Market Analysis, Insights and Forecast, 2020-2032
- 12.1. Market Analysis, Insights and Forecast - by Type
- 12.1.1. Copper
- 12.1.2. Zinc
- 12.1.3. Lead
- 12.1.4. Nickel
- 12.1.5. Aluminum
- 12.1.6. Tin
- 12.2. Market Analysis, Insights and Forecast - by End-user Industry
- 12.2.1. Construction
- 12.2.2. Automotive and Transportation
- 12.2.3. Electrical and Electronics
- 12.2.4. Consumer Products
- 12.2.5. Medical Devices
- 12.2.6. Other End-user Industries
- 12.1. Market Analysis, Insights and Forecast - by Type
- 13. Competitive Analysis
- 13.1. Company Profiles
- 13.1.1 BHP
- 13.1.1.1. Company Overview
- 13.1.1.2. Products
- 13.1.1.3. Company Financials
- 13.1.1.4. SWOT Analysis
- 13.1.2 Lundin Mining Corporation
- 13.1.2.1. Company Overview
- 13.1.2.2. Products
- 13.1.2.3. Company Financials
- 13.1.2.4. SWOT Analysis
- 13.1.3 Anglo American plc
- 13.1.3.1. Company Overview
- 13.1.3.2. Products
- 13.1.3.3. Company Financials
- 13.1.3.4. SWOT Analysis
- 13.1.4 Rio Tinto
- 13.1.4.1. Company Overview
- 13.1.4.2. Products
- 13.1.4.3. Company Financials
- 13.1.4.4. SWOT Analysis
- 13.1.5 Freeport-McMoRan
- 13.1.5.1. Company Overview
- 13.1.5.2. Products
- 13.1.5.3. Company Financials
- 13.1.5.4. SWOT Analysis
- 13.1.6 Glencore
- 13.1.6.1. Company Overview
- 13.1.6.2. Products
- 13.1.6.3. Company Financials
- 13.1.6.4. SWOT Analysis
- 13.1.7 Jiangxi Copper Corporation
- 13.1.7.1. Company Overview
- 13.1.7.2. Products
- 13.1.7.3. Company Financials
- 13.1.7.4. SWOT Analysis
- 13.1.8 Vale
- 13.1.8.1. Company Overview
- 13.1.8.2. Products
- 13.1.8.3. Company Financials
- 13.1.8.4. SWOT Analysis
- 13.1.9 Vedanta Resources Limited
- 13.1.9.1. Company Overview
- 13.1.9.2. Products
- 13.1.9.3. Company Financials
- 13.1.9.4. SWOT Analysis
- 13.1.10 Alcoa Corporation
- 13.1.10.1. Company Overview
- 13.1.10.2. Products
- 13.1.10.3. Company Financials
- 13.1.10.4. SWOT Analysis
- 13.1.1 BHP
- 13.2. Market Entropy
- 13.2.1 Company's Key Areas Served
- 13.2.2 Recent Developments
- 13.3. Company Market Share Analysis 2025
- 13.3.1 Top 5 Companies Market Share Analysis
- 13.3.2 Top 3 Companies Market Share Analysis
- 13.4. List of Potential Customers
- 14. Research Methodology
List of Figures
- Figure 1: Global Base Metals Market Revenue Breakdown (Billion, %) by Region 2025 & 2033
- Figure 2: Global Base Metals Market Volume Breakdown (K Tons, %) by Region 2025 & 2033
- Figure 3: Asia Pacific Base Metals Market Revenue (Billion), by Type 2025 & 2033
- Figure 4: Asia Pacific Base Metals Market Volume (K Tons), by Type 2025 & 2033
- Figure 5: Asia Pacific Base Metals Market Revenue Share (%), by Type 2025 & 2033
- Figure 6: Asia Pacific Base Metals Market Volume Share (%), by Type 2025 & 2033
- Figure 7: Asia Pacific Base Metals Market Revenue (Billion), by End-user Industry 2025 & 2033
- Figure 8: Asia Pacific Base Metals Market Volume (K Tons), by End-user Industry 2025 & 2033
- Figure 9: Asia Pacific Base Metals Market Revenue Share (%), by End-user Industry 2025 & 2033
- Figure 10: Asia Pacific Base Metals Market Volume Share (%), by End-user Industry 2025 & 2033
- Figure 11: Asia Pacific Base Metals Market Revenue (Billion), by Country 2025 & 2033
- Figure 12: Asia Pacific Base Metals Market Volume (K Tons), by Country 2025 & 2033
- Figure 13: Asia Pacific Base Metals Market Revenue Share (%), by Country 2025 & 2033
- Figure 14: Asia Pacific Base Metals Market Volume Share (%), by Country 2025 & 2033
- Figure 15: North America Base Metals Market Revenue (Billion), by Type 2025 & 2033
- Figure 16: North America Base Metals Market Volume (K Tons), by Type 2025 & 2033
- Figure 17: North America Base Metals Market Revenue Share (%), by Type 2025 & 2033
- Figure 18: North America Base Metals Market Volume Share (%), by Type 2025 & 2033
- Figure 19: North America Base Metals Market Revenue (Billion), by End-user Industry 2025 & 2033
- Figure 20: North America Base Metals Market Volume (K Tons), by End-user Industry 2025 & 2033
- Figure 21: North America Base Metals Market Revenue Share (%), by End-user Industry 2025 & 2033
- Figure 22: North America Base Metals Market Volume Share (%), by End-user Industry 2025 & 2033
- Figure 23: North America Base Metals Market Revenue (Billion), by Country 2025 & 2033
- Figure 24: North America Base Metals Market Volume (K Tons), by Country 2025 & 2033
- Figure 25: North America Base Metals Market Revenue Share (%), by Country 2025 & 2033
- Figure 26: North America Base Metals Market Volume Share (%), by Country 2025 & 2033
- Figure 27: Europe Base Metals Market Revenue (Billion), by Type 2025 & 2033
- Figure 28: Europe Base Metals Market Volume (K Tons), by Type 2025 & 2033
- Figure 29: Europe Base Metals Market Revenue Share (%), by Type 2025 & 2033
- Figure 30: Europe Base Metals Market Volume Share (%), by Type 2025 & 2033
- Figure 31: Europe Base Metals Market Revenue (Billion), by End-user Industry 2025 & 2033
- Figure 32: Europe Base Metals Market Volume (K Tons), by End-user Industry 2025 & 2033
- Figure 33: Europe Base Metals Market Revenue Share (%), by End-user Industry 2025 & 2033
- Figure 34: Europe Base Metals Market Volume Share (%), by End-user Industry 2025 & 2033
- Figure 35: Europe Base Metals Market Revenue (Billion), by Country 2025 & 2033
- Figure 36: Europe Base Metals Market Volume (K Tons), by Country 2025 & 2033
- Figure 37: Europe Base Metals Market Revenue Share (%), by Country 2025 & 2033
- Figure 38: Europe Base Metals Market Volume Share (%), by Country 2025 & 2033
- Figure 39: South America Base Metals Market Revenue (Billion), by Type 2025 & 2033
- Figure 40: South America Base Metals Market Volume (K Tons), by Type 2025 & 2033
- Figure 41: South America Base Metals Market Revenue Share (%), by Type 2025 & 2033
- Figure 42: South America Base Metals Market Volume Share (%), by Type 2025 & 2033
- Figure 43: South America Base Metals Market Revenue (Billion), by End-user Industry 2025 & 2033
- Figure 44: South America Base Metals Market Volume (K Tons), by End-user Industry 2025 & 2033
- Figure 45: South America Base Metals Market Revenue Share (%), by End-user Industry 2025 & 2033
- Figure 46: South America Base Metals Market Volume Share (%), by End-user Industry 2025 & 2033
- Figure 47: South America Base Metals Market Revenue (Billion), by Country 2025 & 2033
- Figure 48: South America Base Metals Market Volume (K Tons), by Country 2025 & 2033
- Figure 49: South America Base Metals Market Revenue Share (%), by Country 2025 & 2033
- Figure 50: South America Base Metals Market Volume Share (%), by Country 2025 & 2033
- Figure 51: Middle East Base Metals Market Revenue (Billion), by Type 2025 & 2033
- Figure 52: Middle East Base Metals Market Volume (K Tons), by Type 2025 & 2033
- Figure 53: Middle East Base Metals Market Revenue Share (%), by Type 2025 & 2033
- Figure 54: Middle East Base Metals Market Volume Share (%), by Type 2025 & 2033
- Figure 55: Middle East Base Metals Market Revenue (Billion), by End-user Industry 2025 & 2033
- Figure 56: Middle East Base Metals Market Volume (K Tons), by End-user Industry 2025 & 2033
- Figure 57: Middle East Base Metals Market Revenue Share (%), by End-user Industry 2025 & 2033
- Figure 58: Middle East Base Metals Market Volume Share (%), by End-user Industry 2025 & 2033
- Figure 59: Middle East Base Metals Market Revenue (Billion), by Country 2025 & 2033
- Figure 60: Middle East Base Metals Market Volume (K Tons), by Country 2025 & 2033
- Figure 61: Middle East Base Metals Market Revenue Share (%), by Country 2025 & 2033
- Figure 62: Middle East Base Metals Market Volume Share (%), by Country 2025 & 2033
- Figure 63: Saudi Arabia Base Metals Market Revenue (Billion), by Type 2025 & 2033
- Figure 64: Saudi Arabia Base Metals Market Volume (K Tons), by Type 2025 & 2033
- Figure 65: Saudi Arabia Base Metals Market Revenue Share (%), by Type 2025 & 2033
- Figure 66: Saudi Arabia Base Metals Market Volume Share (%), by Type 2025 & 2033
- Figure 67: Saudi Arabia Base Metals Market Revenue (Billion), by End-user Industry 2025 & 2033
- Figure 68: Saudi Arabia Base Metals Market Volume (K Tons), by End-user Industry 2025 & 2033
- Figure 69: Saudi Arabia Base Metals Market Revenue Share (%), by End-user Industry 2025 & 2033
- Figure 70: Saudi Arabia Base Metals Market Volume Share (%), by End-user Industry 2025 & 2033
- Figure 71: Saudi Arabia Base Metals Market Revenue (Billion), by Country 2025 & 2033
- Figure 72: Saudi Arabia Base Metals Market Volume (K Tons), by Country 2025 & 2033
- Figure 73: Saudi Arabia Base Metals Market Revenue Share (%), by Country 2025 & 2033
- Figure 74: Saudi Arabia Base Metals Market Volume Share (%), by Country 2025 & 2033
List of Tables
- Table 1: Global Base Metals Market Revenue Billion Forecast, by Type 2020 & 2033
- Table 2: Global Base Metals Market Volume K Tons Forecast, by Type 2020 & 2033
- Table 3: Global Base Metals Market Revenue Billion Forecast, by End-user Industry 2020 & 2033
- Table 4: Global Base Metals Market Volume K Tons Forecast, by End-user Industry 2020 & 2033
- Table 5: Global Base Metals Market Revenue Billion Forecast, by Region 2020 & 2033
- Table 6: Global Base Metals Market Volume K Tons Forecast, by Region 2020 & 2033
- Table 7: Global Base Metals Market Revenue Billion Forecast, by Type 2020 & 2033
- Table 8: Global Base Metals Market Volume K Tons Forecast, by Type 2020 & 2033
- Table 9: Global Base Metals Market Revenue Billion Forecast, by End-user Industry 2020 & 2033
- Table 10: Global Base Metals Market Volume K Tons Forecast, by End-user Industry 2020 & 2033
- Table 11: Global Base Metals Market Revenue Billion Forecast, by Country 2020 & 2033
- Table 12: Global Base Metals Market Volume K Tons Forecast, by Country 2020 & 2033
- Table 13: China Base Metals Market Revenue (Billion) Forecast, by Application 2020 & 2033
- Table 14: China Base Metals Market Volume (K Tons) Forecast, by Application 2020 & 2033
- Table 15: India Base Metals Market Revenue (Billion) Forecast, by Application 2020 & 2033
- Table 16: India Base Metals Market Volume (K Tons) Forecast, by Application 2020 & 2033
- Table 17: Japan Base Metals Market Revenue (Billion) Forecast, by Application 2020 & 2033
- Table 18: Japan Base Metals Market Volume (K Tons) Forecast, by Application 2020 & 2033
- Table 19: South Korea Base Metals Market Revenue (Billion) Forecast, by Application 2020 & 2033
- Table 20: South Korea Base Metals Market Volume (K Tons) Forecast, by Application 2020 & 2033
- Table 21: Malaysia Base Metals Market Revenue (Billion) Forecast, by Application 2020 & 2033
- Table 22: Malaysia Base Metals Market Volume (K Tons) Forecast, by Application 2020 & 2033
- Table 23: Thailand Base Metals Market Revenue (Billion) Forecast, by Application 2020 & 2033
- Table 24: Thailand Base Metals Market Volume (K Tons) Forecast, by Application 2020 & 2033
- Table 25: Indonesia Base Metals Market Revenue (Billion) Forecast, by Application 2020 & 2033
- Table 26: Indonesia Base Metals Market Volume (K Tons) Forecast, by Application 2020 & 2033
- Table 27: Vietnam Base Metals Market Revenue (Billion) Forecast, by Application 2020 & 2033
- Table 28: Vietnam Base Metals Market Volume (K Tons) Forecast, by Application 2020 & 2033
- Table 29: Rest of Asia Pacific Base Metals Market Revenue (Billion) Forecast, by Application 2020 & 2033
- Table 30: Rest of Asia Pacific Base Metals Market Volume (K Tons) Forecast, by Application 2020 & 2033
- Table 31: Global Base Metals Market Revenue Billion Forecast, by Type 2020 & 2033
- Table 32: Global Base Metals Market Volume K Tons Forecast, by Type 2020 & 2033
- Table 33: Global Base Metals Market Revenue Billion Forecast, by End-user Industry 2020 & 2033
- Table 34: Global Base Metals Market Volume K Tons Forecast, by End-user Industry 2020 & 2033
- Table 35: Global Base Metals Market Revenue Billion Forecast, by Country 2020 & 2033
- Table 36: Global Base Metals Market Volume K Tons Forecast, by Country 2020 & 2033
- Table 37: United States Base Metals Market Revenue (Billion) Forecast, by Application 2020 & 2033
- Table 38: United States Base Metals Market Volume (K Tons) Forecast, by Application 2020 & 2033
- Table 39: Canada Base Metals Market Revenue (Billion) Forecast, by Application 2020 & 2033
- Table 40: Canada Base Metals Market Volume (K Tons) Forecast, by Application 2020 & 2033
- Table 41: Mexico Base Metals Market Revenue (Billion) Forecast, by Application 2020 & 2033
- Table 42: Mexico Base Metals Market Volume (K Tons) Forecast, by Application 2020 & 2033
- Table 43: Global Base Metals Market Revenue Billion Forecast, by Type 2020 & 2033
- Table 44: Global Base Metals Market Volume K Tons Forecast, by Type 2020 & 2033
- Table 45: Global Base Metals Market Revenue Billion Forecast, by End-user Industry 2020 & 2033
- Table 46: Global Base Metals Market Volume K Tons Forecast, by End-user Industry 2020 & 2033
- Table 47: Global Base Metals Market Revenue Billion Forecast, by Country 2020 & 2033
- Table 48: Global Base Metals Market Volume K Tons Forecast, by Country 2020 & 2033
- Table 49: Germany Base Metals Market Revenue (Billion) Forecast, by Application 2020 & 2033
- Table 50: Germany Base Metals Market Volume (K Tons) Forecast, by Application 2020 & 2033
- Table 51: United Kingdom Base Metals Market Revenue (Billion) Forecast, by Application 2020 & 2033
- Table 52: United Kingdom Base Metals Market Volume (K Tons) Forecast, by Application 2020 & 2033
- Table 53: France Base Metals Market Revenue (Billion) Forecast, by Application 2020 & 2033
- Table 54: France Base Metals Market Volume (K Tons) Forecast, by Application 2020 & 2033
- Table 55: Italy Base Metals Market Revenue (Billion) Forecast, by Application 2020 & 2033
- Table 56: Italy Base Metals Market Volume (K Tons) Forecast, by Application 2020 & 2033
- Table 57: Spain Base Metals Market Revenue (Billion) Forecast, by Application 2020 & 2033
- Table 58: Spain Base Metals Market Volume (K Tons) Forecast, by Application 2020 & 2033
- Table 59: NORDIC Countries Base Metals Market Revenue (Billion) Forecast, by Application 2020 & 2033
- Table 60: NORDIC Countries Base Metals Market Volume (K Tons) Forecast, by Application 2020 & 2033
- Table 61: Turkey Base Metals Market Revenue (Billion) Forecast, by Application 2020 & 2033
- Table 62: Turkey Base Metals Market Volume (K Tons) Forecast, by Application 2020 & 2033
- Table 63: Russia Base Metals Market Revenue (Billion) Forecast, by Application 2020 & 2033
- Table 64: Russia Base Metals Market Volume (K Tons) Forecast, by Application 2020 & 2033
- Table 65: Rest of Europe Base Metals Market Revenue (Billion) Forecast, by Application 2020 & 2033
- Table 66: Rest of Europe Base Metals Market Volume (K Tons) Forecast, by Application 2020 & 2033
- Table 67: Global Base Metals Market Revenue Billion Forecast, by Type 2020 & 2033
- Table 68: Global Base Metals Market Volume K Tons Forecast, by Type 2020 & 2033
- Table 69: Global Base Metals Market Revenue Billion Forecast, by End-user Industry 2020 & 2033
- Table 70: Global Base Metals Market Volume K Tons Forecast, by End-user Industry 2020 & 2033
- Table 71: Global Base Metals Market Revenue Billion Forecast, by Country 2020 & 2033
- Table 72: Global Base Metals Market Volume K Tons Forecast, by Country 2020 & 2033
- Table 73: Brazil Base Metals Market Revenue (Billion) Forecast, by Application 2020 & 2033
- Table 74: Brazil Base Metals Market Volume (K Tons) Forecast, by Application 2020 & 2033
- Table 75: Argentina Base Metals Market Revenue (Billion) Forecast, by Application 2020 & 2033
- Table 76: Argentina Base Metals Market Volume (K Tons) Forecast, by Application 2020 & 2033
- Table 77: Colombia Base Metals Market Revenue (Billion) Forecast, by Application 2020 & 2033
- Table 78: Colombia Base Metals Market Volume (K Tons) Forecast, by Application 2020 & 2033
- Table 79: Rest of South America Base Metals Market Revenue (Billion) Forecast, by Application 2020 & 2033
- Table 80: Rest of South America Base Metals Market Volume (K Tons) Forecast, by Application 2020 & 2033
- Table 81: Global Base Metals Market Revenue Billion Forecast, by Type 2020 & 2033
- Table 82: Global Base Metals Market Volume K Tons Forecast, by Type 2020 & 2033
- Table 83: Global Base Metals Market Revenue Billion Forecast, by End-user Industry 2020 & 2033
- Table 84: Global Base Metals Market Volume K Tons Forecast, by End-user Industry 2020 & 2033
- Table 85: Global Base Metals Market Revenue Billion Forecast, by Country 2020 & 2033
- Table 86: Global Base Metals Market Volume K Tons Forecast, by Country 2020 & 2033
- Table 87: Global Base Metals Market Revenue Billion Forecast, by Type 2020 & 2033
- Table 88: Global Base Metals Market Volume K Tons Forecast, by Type 2020 & 2033
- Table 89: Global Base Metals Market Revenue Billion Forecast, by End-user Industry 2020 & 2033
- Table 90: Global Base Metals Market Volume K Tons Forecast, by End-user Industry 2020 & 2033
- Table 91: Global Base Metals Market Revenue Billion Forecast, by Country 2020 & 2033
- Table 92: Global Base Metals Market Volume K Tons Forecast, by Country 2020 & 2033
- Table 93: Qatar Base Metals Market Revenue (Billion) Forecast, by Application 2020 & 2033
- Table 94: Qatar Base Metals Market Volume (K Tons) Forecast, by Application 2020 & 2033
- Table 95: United Arab Emirates Base Metals Market Revenue (Billion) Forecast, by Application 2020 & 2033
- Table 96: United Arab Emirates Base Metals Market Volume (K Tons) Forecast, by Application 2020 & 2033
- Table 97: Nigeria Base Metals Market Revenue (Billion) Forecast, by Application 2020 & 2033
- Table 98: Nigeria Base Metals Market Volume (K Tons) Forecast, by Application 2020 & 2033
- Table 99: Egypt Base Metals Market Revenue (Billion) Forecast, by Application 2020 & 2033
- Table 100: Egypt Base Metals Market Volume (K Tons) Forecast, by Application 2020 & 2033
- Table 101: South Africa Base Metals Market Revenue (Billion) Forecast, by Application 2020 & 2033
- Table 102: South Africa Base Metals Market Volume (K Tons) Forecast, by Application 2020 & 2033
- Table 103: Rest of Middle East Base Metals Market Revenue (Billion) Forecast, by Application 2020 & 2033
- Table 104: Rest of Middle East Base Metals Market Volume (K Tons) Forecast, by Application 2020 & 2033
Frequently Asked Questions
1. What is the projected Compound Annual Growth Rate (CAGR) of the Base Metals Market?
The projected CAGR is approximately 3.72%.
2. Which companies are prominent players in the Base Metals Market?
Key companies in the market include BHP, Lundin Mining Corporation, Anglo American plc, Rio Tinto, Freeport-McMoRan, Glencore, Jiangxi Copper Corporation, Vale, Vedanta Resources Limited, Alcoa Corporation.
3. What are the main segments of the Base Metals Market?
The market segments include Type, End-user Industry.
4. Can you provide details about the market size?
The market size is estimated to be USD 610.13 Billion as of 2022.
5. What are some drivers contributing to market growth?
Growing Demand from the Construction Industry; High Demand for Lightweight Vehicles; Other Drivers.
6. What are the notable trends driving market growth?
Growing Demand from the Construction Industry.
7. Are there any restraints impacting market growth?
Increasing Emission of Greenhouse Gases; Other Restraints.
8. Can you provide examples of recent developments in the market?
N/A
9. What pricing options are available for accessing the report?
Pricing options include single-user, multi-user, and enterprise licenses priced at USD 4750, USD 5250, and USD 8750 respectively.
10. Is the market size provided in terms of value or volume?
The market size is provided in terms of value, measured in Billion and volume, measured in K Tons.
11. Are there any specific market keywords associated with the report?
Yes, the market keyword associated with the report is "Base Metals Market," which aids in identifying and referencing the specific market segment covered.
12. How do I determine which pricing option suits my needs best?
The pricing options vary based on user requirements and access needs. Individual users may opt for single-user licenses, while businesses requiring broader access may choose multi-user or enterprise licenses for cost-effective access to the report.
13. Are there any additional resources or data provided in the Base Metals Market report?
While the report offers comprehensive insights, it's advisable to review the specific contents or supplementary materials provided to ascertain if additional resources or data are available.
14. How can I stay updated on further developments or reports in the Base Metals Market?
To stay informed about further developments, trends, and reports in the Base Metals Market, consider subscribing to industry newsletters, following relevant companies and organizations, or regularly checking reputable industry news sources and publications.
Methodology
Step 1 - Identification of Relevant Samples Size from Population Database


Step 2 - Approaches for Defining Global Market Size (Value, Volume* & Price*)

Note*: In applicable scenarios
Step 3 - Data Sources
Primary Research
- Web Analytics
- Survey Reports
- Research Institute
- Latest Research Reports
- Opinion Leaders
Secondary Research
- Annual Reports
- White Paper
- Latest Press Release
- Industry Association
- Paid Database
- Investor Presentations

Step 4 - Data Triangulation
Involves using different sources of information in order to increase the validity of a study
These sources are likely to be stakeholders in a program - participants, other researchers, program staff, other community members, and so on.
Then we put all data in single framework & apply various statistical tools to find out the dynamic on the market.
During the analysis stage, feedback from the stakeholder groups would be compared to determine areas of agreement as well as areas of divergence