

Key Insights
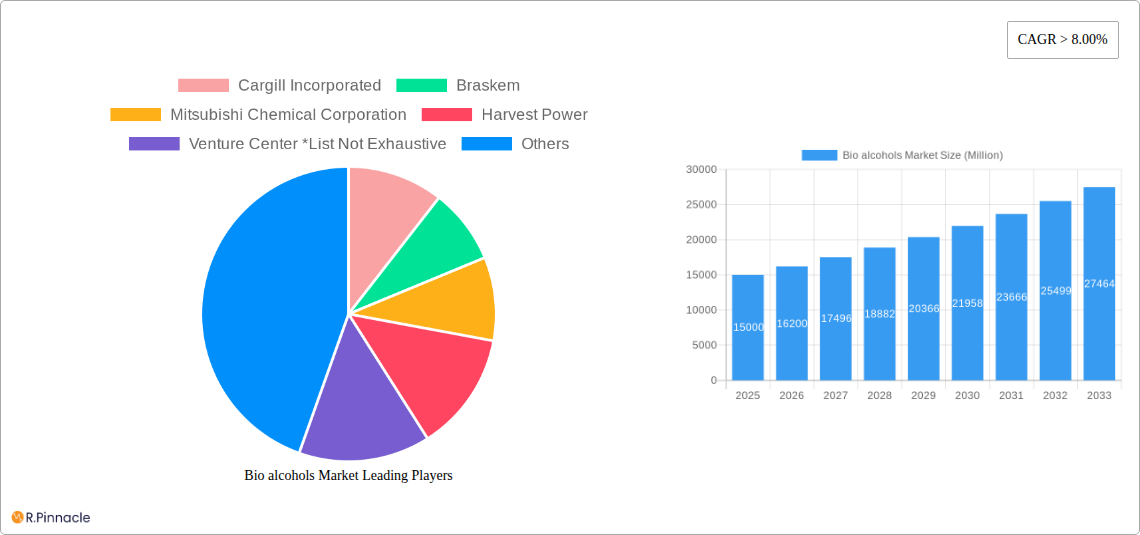
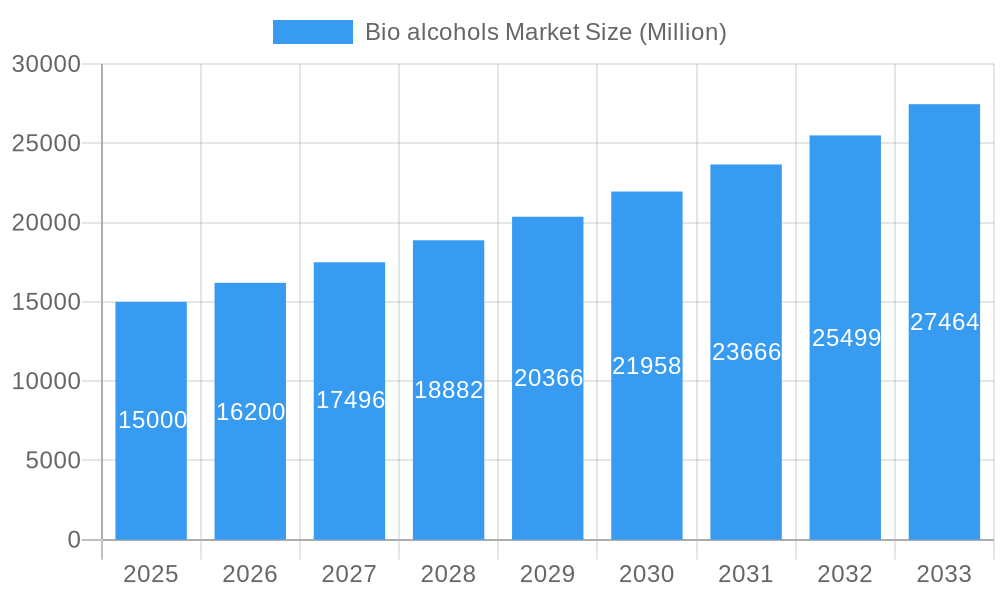
The bio-alcohols market, encompassing bio-methanol, bio-ethanol, bio-butanol, bio-BDO, and other bio-alcohols, is experiencing robust growth, projected to maintain a CAGR exceeding 8% from 2025 to 2033. This expansion is driven by increasing demand from diverse sectors, particularly transportation (fuel additives and biofuels), construction (solvents and adhesives), and the burgeoning electronics industry (cleaning agents and solvents). Stringent environmental regulations aimed at reducing carbon emissions and promoting sustainable practices are significant catalysts, compelling industries to adopt bio-alcohols as greener alternatives to fossil fuel-derived chemicals. Technological advancements in bio-alcohol production, leading to improved efficiency and cost-effectiveness, further bolster market growth. However, challenges remain, including the fluctuating prices of raw materials (e.g., agricultural feedstocks) and the need for substantial infrastructure investments to support large-scale bio-alcohol production and distribution. Market segmentation reveals that bio-ethanol currently holds the largest market share due to its established applications and relatively mature production technology, while bio-butanol and bio-BDO segments are anticipated to witness significant growth driven by their increasing use in specialized applications. The Asia-Pacific region, particularly China and India, is expected to dominate the market due to rapidly expanding industrial sectors and supportive government policies. North America and Europe will also contribute significantly, driven by the focus on sustainability and environmental concerns.
Bio alcohols Market Market Size (In Billion)
The competitive landscape is characterized by a mix of large multinational corporations like Cargill, Braskem, and BASF, along with smaller specialized bio-alcohol producers. These companies are actively involved in research and development, strategic partnerships, and capacity expansion to capitalize on the expanding market opportunities. The market is projected to witness further consolidation as companies seek to enhance their market share and geographic reach. The future of the bio-alcohols market hinges on overcoming challenges related to feedstock availability and cost, refining production processes for higher efficiency, and expanding distribution networks to meet growing demand globally. Continued investment in research and development, coupled with supportive government policies and consumer preference for sustainable products, will be crucial in shaping the market's trajectory in the coming years.
Bio alcohols Market Company Market Share
Bio Alcohols Market Report: 2019-2033 Forecast
This comprehensive report provides a detailed analysis of the global Bio Alcohols Market, offering invaluable insights for industry professionals, investors, and strategic decision-makers. Covering the period 2019-2033, with a focus on 2025, this report examines market structure, dynamics, dominant segments, and leading players, equipping you with the knowledge needed to navigate this evolving landscape. The market is projected to reach xx Million by 2033.
Bio alcohols Market Market Structure & Innovation Trends
This section analyzes the competitive landscape of the bio alcohols market, including market concentration, innovation drivers, regulatory frameworks, and M&A activities. We delve into the market share held by key players like Cargill Incorporated, Braskem, Mitsubishi Chemical Corporation, and BASF SE, examining their strategic moves and market influence. The report also quantifies M&A activity within the sector, analyzing deal values and their impact on market consolidation. Furthermore, we explore the role of regulatory frameworks in shaping market growth, identifying key legislation impacting the biofuels industry. Substitute products and their potential impact on market demand are also considered. Finally, evolving end-user demographics and their changing preferences are analyzed, alongside projections for future market concentration. The estimated market size in 2025 is xx Million.
Bio alcohols Market Market Dynamics & Trends
This in-depth analysis explores the key drivers shaping the bio alcohols market's trajectory. We examine the compound annual growth rate (CAGR) and market penetration rates for various bio alcohol types across different applications. The report dissects technological disruptions, such as advancements in bio-refinery technology and fermentation processes, and their impact on market growth and efficiency. Consumer preferences, specifically the increasing demand for sustainable and renewable alternatives, are analyzed. Competitive dynamics are thoroughly examined, including pricing strategies, product differentiation, and strategic partnerships. Market growth is projected to be driven by factors such as increasing environmental concerns, government regulations promoting renewable energy, and rising demand from various industries. The CAGR for the forecast period (2025-2033) is estimated at xx%.
Dominant Regions & Segments in Bio alcohols Market
This section identifies the leading geographical regions and product segments within the bio alcohols market. Through detailed analysis, we pinpoint the dominant regions and countries driving market growth, exploring the underlying factors contributing to their prominence. For each segment (Bio-methanol, Bio-ethanol, Bio-butanol, Bio-BDO, Other Product Types; Transportation, Construction, Electronics, Pharmaceutical, Other Applications), we provide a comprehensive breakdown of market size and growth projections.
- Key Drivers for Dominant Segments:
- Bio-ethanol (Transportation): Stringent emission regulations, government incentives, and increasing fuel blending mandates.
- Bio-methanol (Chemical Industry): Growing demand for sustainable alternatives in the chemical industry, coupled with technological advancements in production.
- North America/Europe (Geographical Region): Stringent environmental policies, supportive government initiatives, and robust infrastructure.
Bio alcohols Market Product Innovations
This section highlights recent innovations in bio alcohol production and application. We examine advancements in fermentation technologies, improving efficiency and reducing production costs. Novel applications of bio alcohols in various industries, from transportation fuels to specialty chemicals, are discussed. The focus remains on technological trends shaping the market and the competitive advantages offered by innovative products.
Report Scope & Segmentation Analysis
This report provides a comprehensive segmentation analysis of the bio alcohols market, categorized by product type and application.
- Product Type: Bio-methanol, Bio-ethanol, Bio-butanol, Bio-BDO, Other Product Types. Each segment's market size, growth projections, and competitive landscape are analyzed.
- Application: Transportation, Construction, Electronics, Pharmaceutical, Other Applications. The report details the market dynamics, growth potential, and challenges faced by each application segment.
Key Drivers of Bio alcohols Market Growth
The bio alcohols market is experiencing robust growth driven by multiple factors. Increasing environmental awareness and stricter emission regulations are promoting the adoption of renewable fuels. Government incentives and subsidies further encourage the growth of the bio alcohols industry. Advancements in biorefinery technologies are also playing a crucial role, increasing efficiency and reducing production costs. Furthermore, the growing demand from various industries, including transportation and chemicals, fuels market expansion.
Challenges in the Bio alcohols Market Sector
Despite significant growth potential, several challenges hinder the bio alcohols market. Fluctuating raw material prices pose a considerable risk to profitability. Competition from conventional fuels and other renewable energy sources represents a significant challenge. Regulatory uncertainties and inconsistencies across different regions can impede market development. Technological limitations in certain bio alcohol production processes and the lack of robust supply chains in some regions also present considerable hurdles.
Emerging Opportunities in Bio alcohols Market
The bio alcohols market presents several promising opportunities. The expanding use of bio alcohols in new applications, such as cosmetics and personal care products, creates new revenue streams. Technological advancements continuously improve production efficiency and reduce costs, fostering growth. Government policies favoring renewable energy are providing a favorable environment for investment and expansion. The growing awareness of the environmental benefits of bio alcohols enhances market prospects.
Leading Players in the Bio alcohols Market Market
- Cargill Incorporated
- Braskem
- Mitsubishi Chemical Corporation
- Harvest Power
- Venture Center
- BASF SE
- DSM
- Valero Marketing and Supply Company
- Mascoma LLC
- Fulcrum BioEnergy
Key Developments in Bio alcohols Market Industry
- January 2023: Cargill announced a major investment in expanding its bio-ethanol production capacity.
- March 2022: Braskem partnered with a renewable energy company to secure sustainable feedstock for its bio-butanol production.
- (Add further developments with year/month and a brief description of their impact.)
Future Outlook for Bio alcohols Market Market
The future of the bio alcohols market appears bright, driven by strong growth in renewable energy demand, government support for sustainable fuels, and technological advancements in production. The market is poised for continued expansion, with significant opportunities for innovation and investment. Strategic partnerships and collaborations among industry players will play a vital role in shaping the future of this dynamic sector.
Bio alcohols Market Segmentation
-
1. Product Type
- 1.1. Bio-methanol
- 1.2. Bio-ethanol
- 1.3. Bio-butanol
- 1.4. Bio-BDO
- 1.5. Other Product Types
-
2. Application
- 2.1. Transportation
- 2.2. Construction
- 2.3. Electronics
- 2.4. Pharmaceutical
- 2.5. Other Applications
Bio alcohols Market Segmentation By Geography
-
1. Asia Pacific
- 1.1. China
- 1.2. India
- 1.3. Japan
- 1.4. South Korea
- 1.5. ASEAN Countries
- 1.6. Rest of Asia Pacific
-
2. North America
- 2.1. United States
- 2.2. Canada
- 2.3. Mexico
-
3. Europe
- 3.1. Germany
- 3.2. United Kingdom
- 3.3. Italy
- 3.4. France
- 3.5. Rest of Europe
-
4. South America
- 4.1. Brazil
- 4.2. Argentina
- 4.3. Rest of South America
-
5. Middle East and Africa
- 5.1. Saudi Arabia
- 5.2. South Africa
- 5.3. Rest of Middle East and Africa
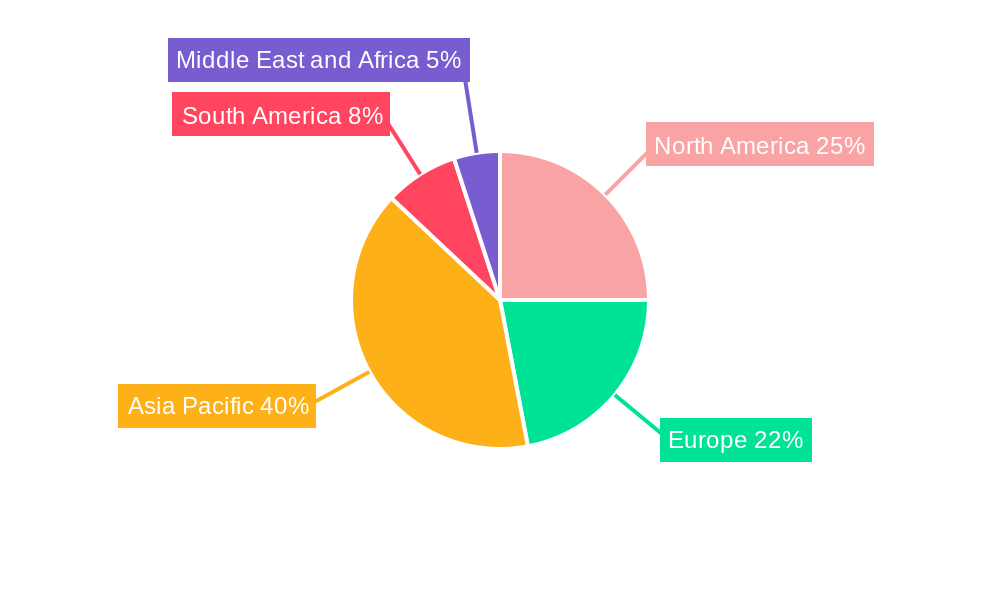
Bio alcohols Market Regional Market Share
Geographic Coverage of Bio alcohols Market
Bio alcohols Market REPORT HIGHLIGHTS
| Aspects | Details |
|---|---|
| Study Period | 2020-2034 |
| Base Year | 2025 |
| Estimated Year | 2026 |
| Forecast Period | 2026-2034 |
| Historical Period | 2020-2025 |
| Growth Rate | CAGR of 6.5% from 2020-2034 |
| Segmentation |
|
Table of Contents
- 1. Introduction
- 1.1. Research Scope
- 1.2. Market Segmentation
- 1.3. Research Objective
- 1.4. Definitions and Assumptions
- 2. Executive Summary
- 2.1. Market Snapshot
- 3. Market Dynamics
- 3.1. Market Drivers
- 3.2. Market Restrains
- 3.3. Market Trends
- 3.4. Market Opportunities
- 4. Market Factor Analysis
- 4.1. Porters Five Forces
- 4.1.1. Bargaining Power of Suppliers
- 4.1.2. Bargaining Power of Buyers
- 4.1.3. Threat of New Entrants
- 4.1.4. Threat of Substitutes
- 4.1.5. Competitive Rivalry
- 4.2. PESTEL analysis
- 4.3. BCG Analysis
- 4.3.1. Stars (High Growth, High Market Share)
- 4.3.2. Cash Cows (Low Growth, High Market Share)
- 4.3.3. Question Mark (High Growth, Low Market Share)
- 4.3.4. Dogs (Low Growth, Low Market Share)
- 4.4. Ansoff Matrix Analysis
- 4.5. Supply Chain Analysis
- 4.6. Regulatory Landscape
- 4.7. Current Market Potential and Opportunity Assessment (TAM–SAM–SOM Framework)
- 4.8. PRI Analyst Note
- 4.1. Porters Five Forces
- 5. Market Analysis, Insights and Forecast 2021-2033
- 5.1. Market Analysis, Insights and Forecast - by Product Type
- 5.1.1. Bio-methanol
- 5.1.2. Bio-ethanol
- 5.1.3. Bio-butanol
- 5.1.4. Bio-BDO
- 5.1.5. Other Product Types
- 5.2. Market Analysis, Insights and Forecast - by Application
- 5.2.1. Transportation
- 5.2.2. Construction
- 5.2.3. Electronics
- 5.2.4. Pharmaceutical
- 5.2.5. Other Applications
- 5.3. Market Analysis, Insights and Forecast - by Region
- 5.3.1. Asia Pacific
- 5.3.2. North America
- 5.3.3. Europe
- 5.3.4. South America
- 5.3.5. Middle East and Africa
- 5.1. Market Analysis, Insights and Forecast - by Product Type
- 6. Global Bio alcohols Market Analysis, Insights and Forecast, 2021-2033
- 6.1. Market Analysis, Insights and Forecast - by Product Type
- 6.1.1. Bio-methanol
- 6.1.2. Bio-ethanol
- 6.1.3. Bio-butanol
- 6.1.4. Bio-BDO
- 6.1.5. Other Product Types
- 6.2. Market Analysis, Insights and Forecast - by Application
- 6.2.1. Transportation
- 6.2.2. Construction
- 6.2.3. Electronics
- 6.2.4. Pharmaceutical
- 6.2.5. Other Applications
- 6.1. Market Analysis, Insights and Forecast - by Product Type
- 7. Asia Pacific Bio alcohols Market Analysis, Insights and Forecast, 2020-2032
- 7.1. Market Analysis, Insights and Forecast - by Product Type
- 7.1.1. Bio-methanol
- 7.1.2. Bio-ethanol
- 7.1.3. Bio-butanol
- 7.1.4. Bio-BDO
- 7.1.5. Other Product Types
- 7.2. Market Analysis, Insights and Forecast - by Application
- 7.2.1. Transportation
- 7.2.2. Construction
- 7.2.3. Electronics
- 7.2.4. Pharmaceutical
- 7.2.5. Other Applications
- 7.1. Market Analysis, Insights and Forecast - by Product Type
- 8. North America Bio alcohols Market Analysis, Insights and Forecast, 2020-2032
- 8.1. Market Analysis, Insights and Forecast - by Product Type
- 8.1.1. Bio-methanol
- 8.1.2. Bio-ethanol
- 8.1.3. Bio-butanol
- 8.1.4. Bio-BDO
- 8.1.5. Other Product Types
- 8.2. Market Analysis, Insights and Forecast - by Application
- 8.2.1. Transportation
- 8.2.2. Construction
- 8.2.3. Electronics
- 8.2.4. Pharmaceutical
- 8.2.5. Other Applications
- 8.1. Market Analysis, Insights and Forecast - by Product Type
- 9. Europe Bio alcohols Market Analysis, Insights and Forecast, 2020-2032
- 9.1. Market Analysis, Insights and Forecast - by Product Type
- 9.1.1. Bio-methanol
- 9.1.2. Bio-ethanol
- 9.1.3. Bio-butanol
- 9.1.4. Bio-BDO
- 9.1.5. Other Product Types
- 9.2. Market Analysis, Insights and Forecast - by Application
- 9.2.1. Transportation
- 9.2.2. Construction
- 9.2.3. Electronics
- 9.2.4. Pharmaceutical
- 9.2.5. Other Applications
- 9.1. Market Analysis, Insights and Forecast - by Product Type
- 10. South America Bio alcohols Market Analysis, Insights and Forecast, 2020-2032
- 10.1. Market Analysis, Insights and Forecast - by Product Type
- 10.1.1. Bio-methanol
- 10.1.2. Bio-ethanol
- 10.1.3. Bio-butanol
- 10.1.4. Bio-BDO
- 10.1.5. Other Product Types
- 10.2. Market Analysis, Insights and Forecast - by Application
- 10.2.1. Transportation
- 10.2.2. Construction
- 10.2.3. Electronics
- 10.2.4. Pharmaceutical
- 10.2.5. Other Applications
- 10.1. Market Analysis, Insights and Forecast - by Product Type
- 11. Middle East and Africa Bio alcohols Market Analysis, Insights and Forecast, 2020-2032
- 11.1. Market Analysis, Insights and Forecast - by Product Type
- 11.1.1. Bio-methanol
- 11.1.2. Bio-ethanol
- 11.1.3. Bio-butanol
- 11.1.4. Bio-BDO
- 11.1.5. Other Product Types
- 11.2. Market Analysis, Insights and Forecast - by Application
- 11.2.1. Transportation
- 11.2.2. Construction
- 11.2.3. Electronics
- 11.2.4. Pharmaceutical
- 11.2.5. Other Applications
- 11.1. Market Analysis, Insights and Forecast - by Product Type
- 12. Competitive Analysis
- 12.1. Company Profiles
- 12.1.1 Cargill Incorporated
- 12.1.1.1. Company Overview
- 12.1.1.2. Products
- 12.1.1.3. Company Financials
- 12.1.1.4. SWOT Analysis
- 12.1.2 Braskem
- 12.1.2.1. Company Overview
- 12.1.2.2. Products
- 12.1.2.3. Company Financials
- 12.1.2.4. SWOT Analysis
- 12.1.3 Mitsubishi Chemical Corporation
- 12.1.3.1. Company Overview
- 12.1.3.2. Products
- 12.1.3.3. Company Financials
- 12.1.3.4. SWOT Analysis
- 12.1.4 Harvest Power
- 12.1.4.1. Company Overview
- 12.1.4.2. Products
- 12.1.4.3. Company Financials
- 12.1.4.4. SWOT Analysis
- 12.1.5 Venture Center *List Not Exhaustive
- 12.1.5.1. Company Overview
- 12.1.5.2. Products
- 12.1.5.3. Company Financials
- 12.1.5.4. SWOT Analysis
- 12.1.6 BASF SE
- 12.1.6.1. Company Overview
- 12.1.6.2. Products
- 12.1.6.3. Company Financials
- 12.1.6.4. SWOT Analysis
- 12.1.7 DSM
- 12.1.7.1. Company Overview
- 12.1.7.2. Products
- 12.1.7.3. Company Financials
- 12.1.7.4. SWOT Analysis
- 12.1.8 Valero Marketing and Supply Company
- 12.1.8.1. Company Overview
- 12.1.8.2. Products
- 12.1.8.3. Company Financials
- 12.1.8.4. SWOT Analysis
- 12.1.9 Mascoma LLC
- 12.1.9.1. Company Overview
- 12.1.9.2. Products
- 12.1.9.3. Company Financials
- 12.1.9.4. SWOT Analysis
- 12.1.10 Fulcrum BioEnergy
- 12.1.10.1. Company Overview
- 12.1.10.2. Products
- 12.1.10.3. Company Financials
- 12.1.10.4. SWOT Analysis
- 12.1.1 Cargill Incorporated
- 12.2. Market Entropy
- 12.2.1 Company's Key Areas Served
- 12.2.2 Recent Developments
- 12.3. Company Market Share Analysis 2025
- 12.3.1 Top 5 Companies Market Share Analysis
- 12.3.2 Top 3 Companies Market Share Analysis
- 12.4. List of Potential Customers
- 13. Research Methodology
List of Figures
- Figure 1: Global Bio alcohols Market Revenue Breakdown (billion, %) by Region 2025 & 2033
- Figure 2: Asia Pacific Bio alcohols Market Revenue (billion), by Product Type 2025 & 2033
- Figure 3: Asia Pacific Bio alcohols Market Revenue Share (%), by Product Type 2025 & 2033
- Figure 4: Asia Pacific Bio alcohols Market Revenue (billion), by Application 2025 & 2033
- Figure 5: Asia Pacific Bio alcohols Market Revenue Share (%), by Application 2025 & 2033
- Figure 6: Asia Pacific Bio alcohols Market Revenue (billion), by Country 2025 & 2033
- Figure 7: Asia Pacific Bio alcohols Market Revenue Share (%), by Country 2025 & 2033
- Figure 8: North America Bio alcohols Market Revenue (billion), by Product Type 2025 & 2033
- Figure 9: North America Bio alcohols Market Revenue Share (%), by Product Type 2025 & 2033
- Figure 10: North America Bio alcohols Market Revenue (billion), by Application 2025 & 2033
- Figure 11: North America Bio alcohols Market Revenue Share (%), by Application 2025 & 2033
- Figure 12: North America Bio alcohols Market Revenue (billion), by Country 2025 & 2033
- Figure 13: North America Bio alcohols Market Revenue Share (%), by Country 2025 & 2033
- Figure 14: Europe Bio alcohols Market Revenue (billion), by Product Type 2025 & 2033
- Figure 15: Europe Bio alcohols Market Revenue Share (%), by Product Type 2025 & 2033
- Figure 16: Europe Bio alcohols Market Revenue (billion), by Application 2025 & 2033
- Figure 17: Europe Bio alcohols Market Revenue Share (%), by Application 2025 & 2033
- Figure 18: Europe Bio alcohols Market Revenue (billion), by Country 2025 & 2033
- Figure 19: Europe Bio alcohols Market Revenue Share (%), by Country 2025 & 2033
- Figure 20: South America Bio alcohols Market Revenue (billion), by Product Type 2025 & 2033
- Figure 21: South America Bio alcohols Market Revenue Share (%), by Product Type 2025 & 2033
- Figure 22: South America Bio alcohols Market Revenue (billion), by Application 2025 & 2033
- Figure 23: South America Bio alcohols Market Revenue Share (%), by Application 2025 & 2033
- Figure 24: South America Bio alcohols Market Revenue (billion), by Country 2025 & 2033
- Figure 25: South America Bio alcohols Market Revenue Share (%), by Country 2025 & 2033
- Figure 26: Middle East and Africa Bio alcohols Market Revenue (billion), by Product Type 2025 & 2033
- Figure 27: Middle East and Africa Bio alcohols Market Revenue Share (%), by Product Type 2025 & 2033
- Figure 28: Middle East and Africa Bio alcohols Market Revenue (billion), by Application 2025 & 2033
- Figure 29: Middle East and Africa Bio alcohols Market Revenue Share (%), by Application 2025 & 2033
- Figure 30: Middle East and Africa Bio alcohols Market Revenue (billion), by Country 2025 & 2033
- Figure 31: Middle East and Africa Bio alcohols Market Revenue Share (%), by Country 2025 & 2033
List of Tables
- Table 1: Global Bio alcohols Market Revenue billion Forecast, by Product Type 2020 & 2033
- Table 2: Global Bio alcohols Market Revenue billion Forecast, by Application 2020 & 2033
- Table 3: Global Bio alcohols Market Revenue billion Forecast, by Region 2020 & 2033
- Table 4: Global Bio alcohols Market Revenue billion Forecast, by Product Type 2020 & 2033
- Table 5: Global Bio alcohols Market Revenue billion Forecast, by Application 2020 & 2033
- Table 6: Global Bio alcohols Market Revenue billion Forecast, by Country 2020 & 2033
- Table 7: China Bio alcohols Market Revenue (billion) Forecast, by Application 2020 & 2033
- Table 8: India Bio alcohols Market Revenue (billion) Forecast, by Application 2020 & 2033
- Table 9: Japan Bio alcohols Market Revenue (billion) Forecast, by Application 2020 & 2033
- Table 10: South Korea Bio alcohols Market Revenue (billion) Forecast, by Application 2020 & 2033
- Table 11: ASEAN Countries Bio alcohols Market Revenue (billion) Forecast, by Application 2020 & 2033
- Table 12: Rest of Asia Pacific Bio alcohols Market Revenue (billion) Forecast, by Application 2020 & 2033
- Table 13: Global Bio alcohols Market Revenue billion Forecast, by Product Type 2020 & 2033
- Table 14: Global Bio alcohols Market Revenue billion Forecast, by Application 2020 & 2033
- Table 15: Global Bio alcohols Market Revenue billion Forecast, by Country 2020 & 2033
- Table 16: United States Bio alcohols Market Revenue (billion) Forecast, by Application 2020 & 2033
- Table 17: Canada Bio alcohols Market Revenue (billion) Forecast, by Application 2020 & 2033
- Table 18: Mexico Bio alcohols Market Revenue (billion) Forecast, by Application 2020 & 2033
- Table 19: Global Bio alcohols Market Revenue billion Forecast, by Product Type 2020 & 2033
- Table 20: Global Bio alcohols Market Revenue billion Forecast, by Application 2020 & 2033
- Table 21: Global Bio alcohols Market Revenue billion Forecast, by Country 2020 & 2033
- Table 22: Germany Bio alcohols Market Revenue (billion) Forecast, by Application 2020 & 2033
- Table 23: United Kingdom Bio alcohols Market Revenue (billion) Forecast, by Application 2020 & 2033
- Table 24: Italy Bio alcohols Market Revenue (billion) Forecast, by Application 2020 & 2033
- Table 25: France Bio alcohols Market Revenue (billion) Forecast, by Application 2020 & 2033
- Table 26: Rest of Europe Bio alcohols Market Revenue (billion) Forecast, by Application 2020 & 2033
- Table 27: Global Bio alcohols Market Revenue billion Forecast, by Product Type 2020 & 2033
- Table 28: Global Bio alcohols Market Revenue billion Forecast, by Application 2020 & 2033
- Table 29: Global Bio alcohols Market Revenue billion Forecast, by Country 2020 & 2033
- Table 30: Brazil Bio alcohols Market Revenue (billion) Forecast, by Application 2020 & 2033
- Table 31: Argentina Bio alcohols Market Revenue (billion) Forecast, by Application 2020 & 2033
- Table 32: Rest of South America Bio alcohols Market Revenue (billion) Forecast, by Application 2020 & 2033
- Table 33: Global Bio alcohols Market Revenue billion Forecast, by Product Type 2020 & 2033
- Table 34: Global Bio alcohols Market Revenue billion Forecast, by Application 2020 & 2033
- Table 35: Global Bio alcohols Market Revenue billion Forecast, by Country 2020 & 2033
- Table 36: Saudi Arabia Bio alcohols Market Revenue (billion) Forecast, by Application 2020 & 2033
- Table 37: South Africa Bio alcohols Market Revenue (billion) Forecast, by Application 2020 & 2033
- Table 38: Rest of Middle East and Africa Bio alcohols Market Revenue (billion) Forecast, by Application 2020 & 2033
Frequently Asked Questions
1. What is the projected Compound Annual Growth Rate (CAGR) of the Bio alcohols Market?
The projected CAGR is approximately 6.5%.
2. Which companies are prominent players in the Bio alcohols Market?
Key companies in the market include Cargill Incorporated, Braskem, Mitsubishi Chemical Corporation, Harvest Power, Venture Center *List Not Exhaustive, BASF SE, DSM, Valero Marketing and Supply Company, Mascoma LLC, Fulcrum BioEnergy.
3. What are the main segments of the Bio alcohols Market?
The market segments include Product Type, Application.
4. Can you provide details about the market size?
The market size is estimated to be USD 12.55 billion as of 2022.
5. What are some drivers contributing to market growth?
; Growing Demand for Bio-based Products; Other Drivers.
6. What are the notable trends driving market growth?
Bio-ethanol to Dominate the Market.
7. Are there any restraints impacting market growth?
; Declining Automotive Production; Impact of COVID-19 Pandemic.
8. Can you provide examples of recent developments in the market?
N/A
9. What pricing options are available for accessing the report?
Pricing options include single-user, multi-user, and enterprise licenses priced at USD 4750, USD 5250, and USD 8750 respectively.
10. Is the market size provided in terms of value or volume?
The market size is provided in terms of value, measured in billion.
11. Are there any specific market keywords associated with the report?
Yes, the market keyword associated with the report is "Bio alcohols Market," which aids in identifying and referencing the specific market segment covered.
12. How do I determine which pricing option suits my needs best?
The pricing options vary based on user requirements and access needs. Individual users may opt for single-user licenses, while businesses requiring broader access may choose multi-user or enterprise licenses for cost-effective access to the report.
13. Are there any additional resources or data provided in the Bio alcohols Market report?
While the report offers comprehensive insights, it's advisable to review the specific contents or supplementary materials provided to ascertain if additional resources or data are available.
14. How can I stay updated on further developments or reports in the Bio alcohols Market?
To stay informed about further developments, trends, and reports in the Bio alcohols Market, consider subscribing to industry newsletters, following relevant companies and organizations, or regularly checking reputable industry news sources and publications.
Methodology
Step 1 - Identification of Relevant Samples Size from Population Database


Step 2 - Approaches for Defining Global Market Size (Value, Volume* & Price*)

Note*: In applicable scenarios
Step 3 - Data Sources
Primary Research
- Web Analytics
- Survey Reports
- Research Institute
- Latest Research Reports
- Opinion Leaders
Secondary Research
- Annual Reports
- White Paper
- Latest Press Release
- Industry Association
- Paid Database
- Investor Presentations

Step 4 - Data Triangulation
Involves using different sources of information in order to increase the validity of a study
These sources are likely to be stakeholders in a program - participants, other researchers, program staff, other community members, and so on.
Then we put all data in single framework & apply various statistical tools to find out the dynamic on the market.
During the analysis stage, feedback from the stakeholder groups would be compared to determine areas of agreement as well as areas of divergence