

Key Insights
The bio-based resins market is poised for significant expansion, driven by escalating environmental awareness and increasingly stringent regulations against petroleum-based plastics. This dynamic market, valued at $1.4 billion in 2025, is projected to grow at a Compound Annual Growth Rate (CAGR) of 9% between 2025 and 2033. The surge in demand for sustainable and biodegradable materials across key sectors such as packaging, textiles, and consumer goods is a primary growth catalyst. Growing consumer preference for eco-friendly alternatives is directly fueling the adoption of bio-based resins. Furthermore, governmental initiatives championing renewable resources and carbon emission reduction are providing substantial momentum to market expansion. Biodegradable starch blends and polylactic acid (PLA) currently dominate market share due to their extensive applications and established production infrastructure. However, challenges persist, including the higher cost of bio-based resins compared to traditional plastics and the need for enhanced biodegradability and performance characteristics to ensure competitive parity. Technological advancements focused on improving durability, scalability, and cost-effectiveness are anticipated to mitigate these restraints and further accelerate market growth. Regional expansion is expected to be robust, with the Asia Pacific region exhibiting particularly rapid growth driven by increasing industrialization and rising disposable incomes. North America and Europe will continue to demonstrate strong growth, reflecting established environmental consciousness and supportive regulatory frameworks for sustainable materials.
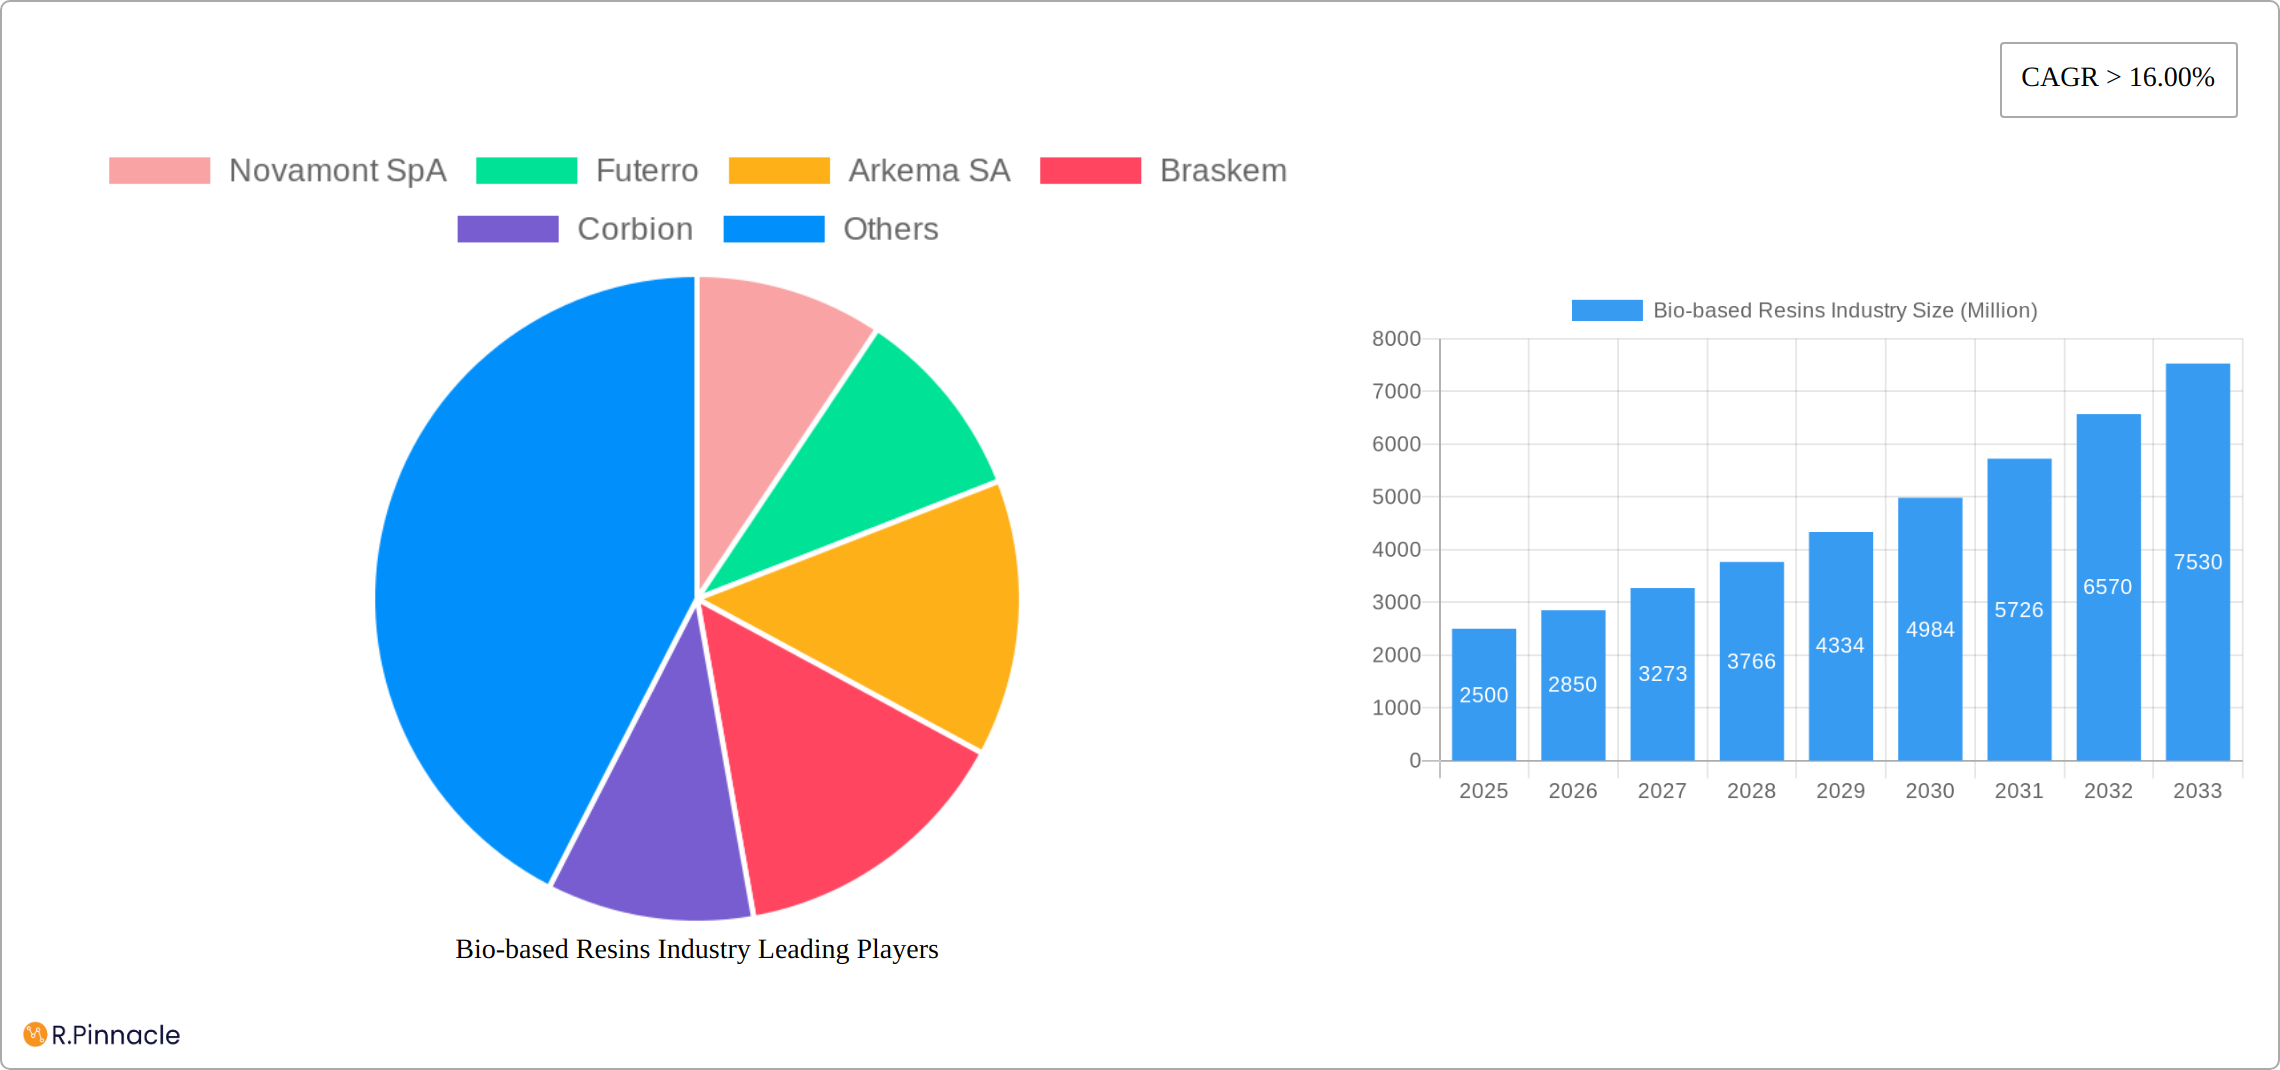
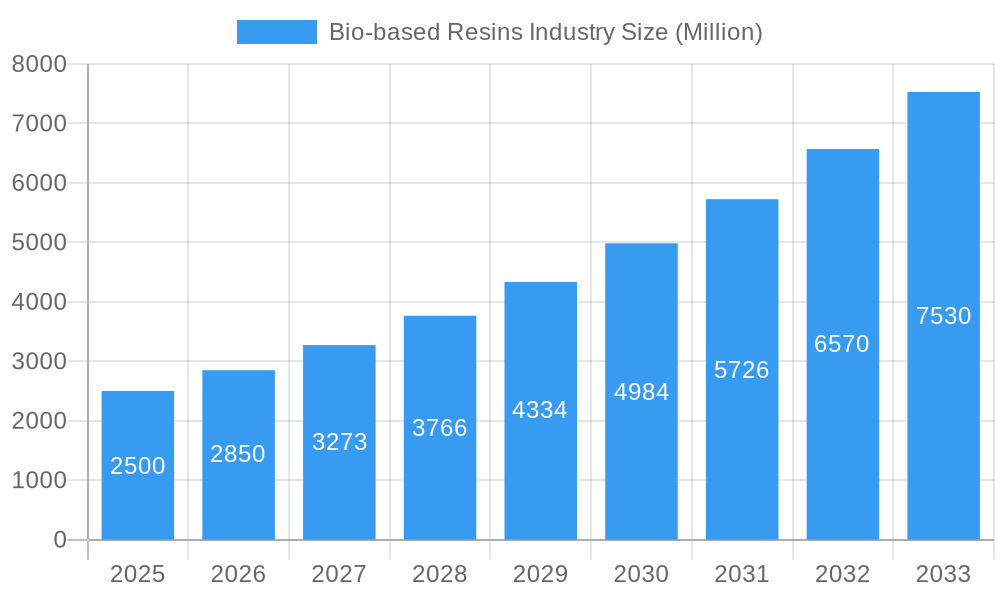
Bio-based Resins Industry Market Size (In Billion)
The competitive landscape features a mix of established chemical corporations and emerging bio-based resin manufacturers. Leading players such as Novamont, Futerro, and Natureworks leverage their expertise in biopolymer technology and extensive distribution networks. However, the market is experiencing intensified competition as new entrants target niche applications and specific resin types. Strategic collaborations, mergers, acquisitions, and dedicated research and development efforts are expected to shape future competitive dynamics. A growing emphasis is placed on developing innovative bio-based resins with customized properties for specific industry requirements and expanding their applications into nascent sectors like electronics and construction, thereby paving the way for further market penetration.
Bio-based Resins Industry Company Market Share
Bio-based Resins Industry Market Report: 2019-2033
This comprehensive report provides a detailed analysis of the Bio-based Resins market, offering invaluable insights for industry professionals, investors, and strategists. Covering the period from 2019 to 2033, with a focus on 2025, this report leverages extensive research to forecast market trends and identify key growth opportunities. The report encompasses market size estimations (in Millions), CAGR calculations, and in-depth segment analysis across various types and applications.
Bio-based Resins Industry Market Structure & Innovation Trends
The bio-based resins market presents a moderately concentrated landscape, featuring several key players alongside a multitude of smaller, niche competitors. Prominent companies include Novamont SpA, Futerro, Arkema SA, Braskem, Corbion, BASF SE, Trinseo, Biotec, Yield10 Bioscience Inc, DuPont, Minima, Natureworks LLC, and Danimer Scientific. Market share distribution exhibits significant variability across different resin types and applications. Illustrative projections for 2025 suggest BASF SE and Arkema SA holding a combined market share of approximately 30%, with the remaining 70% attributed to smaller participants. This dynamic structure is subject to ongoing shifts driven by innovation and strategic mergers & acquisitions.
Innovation within the bio-based resins sector is propelled by several converging forces:
- Heightened Sustainability Concerns: The burgeoning global awareness of environmental issues fuels escalating demand for eco-friendly alternatives to conventional petroleum-based resins, creating a strong market pull for sustainable solutions.
- Rapid Technological Advancements: Continuous refinements in bio-based resin production technologies are resulting in enhanced material properties, improved process efficiency, and notably reduced production costs, making bio-based options increasingly competitive.
- Strengthening Regulatory Frameworks: Governments worldwide are implementing increasingly stringent regulations that incentivize the adoption of bio-based materials, creating a favorable regulatory environment that fosters market expansion.
- Strategic Mergers and Acquisitions (M&A): The industry has witnessed significant M&A activity in recent years, with deal values exceeding [Insert Updated Value] Million in the last five years. These transactions reflect industry consolidation and underscore the strategic importance of bio-based resins as a key growth sector. The average deal size of approximately [Insert Updated Average Deal Size] Million highlights substantial industry investment in both organic growth and the acquisition of innovative technologies.
This robust activity contributes to a dynamic and evolving market landscape.
Bio-based Resins Industry Market Dynamics & Trends
The bio-based resins market is experiencing robust growth, driven by surging demand across diverse end-use sectors. The market's Compound Annual Growth Rate (CAGR) is projected to be approximately [Insert Updated CAGR]% during the forecast period (2025-2033), reaching a projected market value of [Insert Updated Market Value] Million by 2033. This impressive growth trajectory is fueled by several key factors:
- Growing Consumer Preference for Sustainable Products: A global shift towards environmentally conscious consumption patterns is driving significant adoption of bio-based resins across various applications.
- Transformative Technological Disruptions: Continuous innovation is leading to bio-based resins with improved performance characteristics and enhanced cost-effectiveness, surpassing limitations of previous generations.
- Supportive Government Initiatives and Policies: Governments worldwide are actively promoting the adoption of sustainable materials through various policy instruments, creating a supportive regulatory landscape.
- Intensifying Competitive Landscape: The competitive landscape is highly dynamic, characterized by substantial R&D investment and continuous expansion of product portfolios to meet evolving market demands. Market penetration is steadily increasing across diverse segments, with the packaging sector currently representing the largest application area.
Dominant Regions & Segments in Bio-based Resins Industry
The Bio-based Resins market is geographically diverse, with North America and Europe currently dominating the market share. However, the Asia-Pacific region is expected to experience significant growth during the forecast period due to rapid industrialization and increasing environmental awareness.
Key Drivers by Region:
- North America: Strong government support for sustainable technologies, coupled with a large consumer base demanding sustainable products.
- Europe: Stringent environmental regulations, advanced bio-based resin technologies, and a well-established recycling infrastructure.
- Asia-Pacific: Rapid economic growth, increasing consumer disposable income, and growing awareness of environmental sustainability.
Dominant Segments:
- By Type: Polylactic Acid (PLA) currently holds the largest market share due to its versatility and wide range of applications. Bio-polyethylene (Bio-PE) is also witnessing rapid growth, driven by its application in flexible packaging.
- By Application: Packaging is the largest application segment, followed by consumer goods and textiles. The automotive and transportation sector is emerging as a significant growth driver due to the increasing demand for lightweight and sustainable materials. Growth projections for each segment vary depending on technological advancements and evolving consumer preferences.
Bio-based Resins Industry Product Innovations
Recent product innovations have centered on enhancing the performance of bio-based resins to effectively compete with and even surpass their petroleum-based counterparts. This involves significant improvements in strength, durability, processability, and the crucial maintenance of biodegradability. The industry is actively developing novel bio-based resins tailored to meet the specific demands of diverse applications, including those requiring high heat resistance or superior barrier properties for sensitive products like food packaging. This evolution is marked by a clear trend towards high-performance, specialized bio-based resins capable of satisfying the sophisticated requirements of a broad range of industries.
Report Scope & Segmentation Analysis
This report provides a comprehensive segmentation of the Bio-based Resins market by type (Biodegradable Starch Blends, Polylactic Acid (PLA), Bio-polyethylene Terephthalate (Bio-PET), Polyhydroxyalkanoate (PHA), Bio-polyethylene (Bio-PE), Biodegradable Polyesters, Other Types) and application (Packaging, Textiles, Consumer Goods, Automotive and Transportation, Agriculture and Horticulture, Building and Construction, Electrical and Electronics, Other Applications). Each segment's market size, growth projections, and competitive dynamics are analyzed in detail. The report also provides a regional breakdown of the market, highlighting key regional differences in growth drivers and market trends.
Key Drivers of Bio-based Resins Industry Growth
The expansion of the bio-based resins market is driven by a confluence of factors: a rising consumer preference for eco-friendly products; increasingly stringent government regulations promoting sustainable alternatives; technological advancements resulting in improved resin performance and reduced costs; and a diversification of applications across various industries. These synergistic factors create a highly favorable environment for continued, robust market expansion in the years to come.
Challenges in the Bio-based Resins Industry Sector
Despite significant growth potential, the Bio-based Resins industry faces challenges: high production costs compared to petroleum-based alternatives; limited availability of suitable feedstock; and inconsistent performance characteristics compared to some traditional materials. These factors hinder wider adoption and necessitate continuous innovation to overcome these limitations and drive further growth. The high initial investment required for production facilities also poses a barrier to entry for smaller companies.
Emerging Opportunities in Bio-based Resins Industry
Emerging opportunities include expanding into new applications, such as biodegradable medical devices and electronics; developing new bio-based resin types with enhanced properties; and leveraging advancements in bio-based resin recycling and waste management. Growing consumer awareness of sustainability issues presents a significant opportunity for market expansion, particularly in developing economies.
Leading Players in the Bio-based Resins Industry Market
- Novamont SpA
- Futerro
- Arkema SA
- Braskem
- Corbion
- BASF SE
- Trinseo
- Biotec
- Yield10 Bioscience Inc
- DuPont
- Minima
- Natureworks LLC
- Danimer Scientific
Key Developments in Bio-based Resins Industry
- January 2023: BASF SE announced a significant new investment to expand its bio-based resin production capacity, signaling confidence in future market growth.
- June 2022: Arkema SA launched a novel bio-based resin specifically engineered for demanding packaging applications, addressing a key market segment.
- November 2021: A merger between two smaller bio-based resin companies resulted in the creation of a larger entity with an expanded product portfolio and enhanced market reach. (Further details on specific mergers and acquisitions will be included in the full report.)
- [Add other recent developments here with dates and brief descriptions]
Future Outlook for Bio-based Resins Industry Market
The future of the Bio-based Resins market is bright. Continued technological advancements, coupled with growing environmental awareness and supportive government policies, will drive significant market growth. Strategic collaborations and investments in R&D will further enhance product performance and broaden applications. The market is poised for substantial expansion, offering lucrative opportunities for existing and emerging players.
Bio-based Resins Industry Segmentation
-
1. Type
- 1.1. Biodegradable Starch Blends
- 1.2. Polylactic Acid (PLA)
- 1.3. Bio-polyethylene Terephthalate (Bio-PET)
- 1.4. Polyhydroxyalkanoate (PHA)
- 1.5. Bio-polyethylene (Bio-PE)
- 1.6. Biodegradable Polyesters
- 1.7. Other Types
-
2. Application
-
2.1. Packaging
- 2.1.1. Rigid
- 2.1.2. Flexible
- 2.2. Textiles
- 2.3. Consumer Goods
- 2.4. Automotive and Transportation
- 2.5. Agriculture and Horticulture
- 2.6. Building and Construction
- 2.7. Electrical and Electronics
- 2.8. Other Applications
-
2.1. Packaging
Bio-based Resins Industry Segmentation By Geography
-
1. Asia Pacific
- 1.1. China
- 1.2. India
- 1.3. Japan
- 1.4. South Korea
- 1.5. Rest of Asia Pacific
-
2. North America
- 2.1. United States
- 2.2. Canada
- 2.3. Mexico
-
3. Europe
- 3.1. Germany
- 3.2. United Kingdom
- 3.3. France
- 3.4. Italy
- 3.5. Rest of Europe
-
4. South America
- 4.1. Brazil
- 4.2. Argentina
- 4.3. Rest of South America
- 5. Middle East
-
6. Saudi Arabia
- 6.1. South Africa
- 6.2. Rest of Middle East
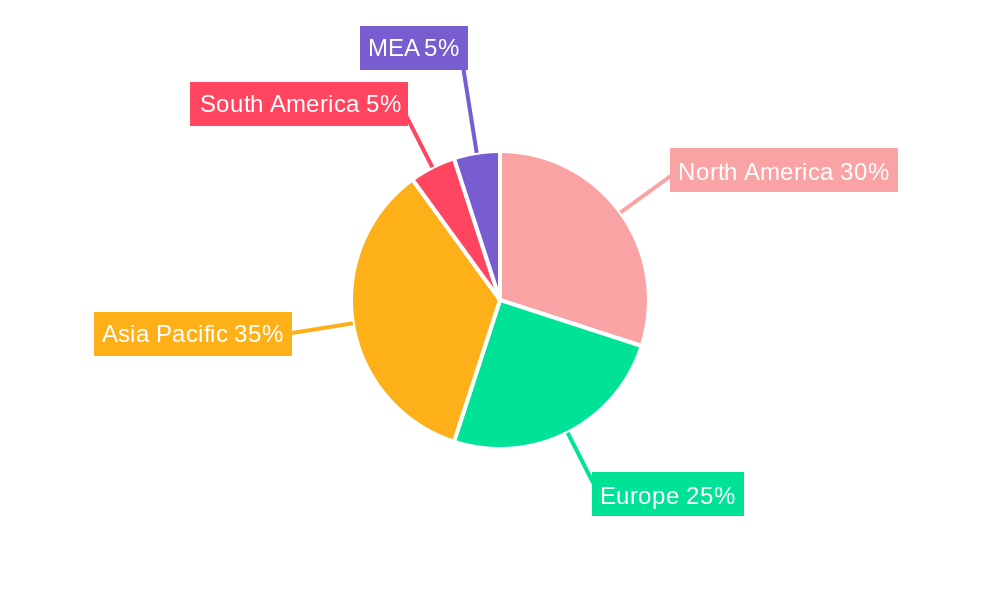
Bio-based Resins Industry Regional Market Share
Geographic Coverage of Bio-based Resins Industry
Bio-based Resins Industry REPORT HIGHLIGHTS
| Aspects | Details |
|---|---|
| Study Period | 2020-2034 |
| Base Year | 2025 |
| Estimated Year | 2026 |
| Forecast Period | 2026-2034 |
| Historical Period | 2020-2025 |
| Growth Rate | CAGR of 9% from 2020-2034 |
| Segmentation |
|
Table of Contents
- 1. Introduction
- 1.1. Research Scope
- 1.2. Market Segmentation
- 1.3. Research Objective
- 1.4. Definitions and Assumptions
- 2. Executive Summary
- 2.1. Market Snapshot
- 3. Market Dynamics
- 3.1. Market Drivers
- 3.2. Market Restrains
- 3.3. Market Trends
- 3.4. Market Opportunities
- 4. Market Factor Analysis
- 4.1. Porters Five Forces
- 4.1.1. Bargaining Power of Suppliers
- 4.1.2. Bargaining Power of Buyers
- 4.1.3. Threat of New Entrants
- 4.1.4. Threat of Substitutes
- 4.1.5. Competitive Rivalry
- 4.2. PESTEL analysis
- 4.3. BCG Analysis
- 4.3.1. Stars (High Growth, High Market Share)
- 4.3.2. Cash Cows (Low Growth, High Market Share)
- 4.3.3. Question Mark (High Growth, Low Market Share)
- 4.3.4. Dogs (Low Growth, Low Market Share)
- 4.4. Ansoff Matrix Analysis
- 4.5. Supply Chain Analysis
- 4.6. Regulatory Landscape
- 4.7. Current Market Potential and Opportunity Assessment (TAM–SAM–SOM Framework)
- 4.8. PRI Analyst Note
- 4.1. Porters Five Forces
- 5. Market Analysis, Insights and Forecast 2021-2033
- 5.1. Market Analysis, Insights and Forecast - by Type
- 5.1.1. Biodegradable Starch Blends
- 5.1.2. Polylactic Acid (PLA)
- 5.1.3. Bio-polyethylene Terephthalate (Bio-PET)
- 5.1.4. Polyhydroxyalkanoate (PHA)
- 5.1.5. Bio-polyethylene (Bio-PE)
- 5.1.6. Biodegradable Polyesters
- 5.1.7. Other Types
- 5.2. Market Analysis, Insights and Forecast - by Application
- 5.2.1. Packaging
- 5.2.1.1. Rigid
- 5.2.1.2. Flexible
- 5.2.2. Textiles
- 5.2.3. Consumer Goods
- 5.2.4. Automotive and Transportation
- 5.2.5. Agriculture and Horticulture
- 5.2.6. Building and Construction
- 5.2.7. Electrical and Electronics
- 5.2.8. Other Applications
- 5.2.1. Packaging
- 5.3. Market Analysis, Insights and Forecast - by Region
- 5.3.1. Asia Pacific
- 5.3.2. North America
- 5.3.3. Europe
- 5.3.4. South America
- 5.3.5. Middle East
- 5.3.6. Saudi Arabia
- 5.1. Market Analysis, Insights and Forecast - by Type
- 6. Global Bio-based Resins Industry Analysis, Insights and Forecast, 2021-2033
- 6.1. Market Analysis, Insights and Forecast - by Type
- 6.1.1. Biodegradable Starch Blends
- 6.1.2. Polylactic Acid (PLA)
- 6.1.3. Bio-polyethylene Terephthalate (Bio-PET)
- 6.1.4. Polyhydroxyalkanoate (PHA)
- 6.1.5. Bio-polyethylene (Bio-PE)
- 6.1.6. Biodegradable Polyesters
- 6.1.7. Other Types
- 6.2. Market Analysis, Insights and Forecast - by Application
- 6.2.1. Packaging
- 6.2.1.1. Rigid
- 6.2.1.2. Flexible
- 6.2.2. Textiles
- 6.2.3. Consumer Goods
- 6.2.4. Automotive and Transportation
- 6.2.5. Agriculture and Horticulture
- 6.2.6. Building and Construction
- 6.2.7. Electrical and Electronics
- 6.2.8. Other Applications
- 6.2.1. Packaging
- 6.1. Market Analysis, Insights and Forecast - by Type
- 7. Asia Pacific Bio-based Resins Industry Analysis, Insights and Forecast, 2020-2032
- 7.1. Market Analysis, Insights and Forecast - by Type
- 7.1.1. Biodegradable Starch Blends
- 7.1.2. Polylactic Acid (PLA)
- 7.1.3. Bio-polyethylene Terephthalate (Bio-PET)
- 7.1.4. Polyhydroxyalkanoate (PHA)
- 7.1.5. Bio-polyethylene (Bio-PE)
- 7.1.6. Biodegradable Polyesters
- 7.1.7. Other Types
- 7.2. Market Analysis, Insights and Forecast - by Application
- 7.2.1. Packaging
- 7.2.1.1. Rigid
- 7.2.1.2. Flexible
- 7.2.2. Textiles
- 7.2.3. Consumer Goods
- 7.2.4. Automotive and Transportation
- 7.2.5. Agriculture and Horticulture
- 7.2.6. Building and Construction
- 7.2.7. Electrical and Electronics
- 7.2.8. Other Applications
- 7.2.1. Packaging
- 7.1. Market Analysis, Insights and Forecast - by Type
- 8. North America Bio-based Resins Industry Analysis, Insights and Forecast, 2020-2032
- 8.1. Market Analysis, Insights and Forecast - by Type
- 8.1.1. Biodegradable Starch Blends
- 8.1.2. Polylactic Acid (PLA)
- 8.1.3. Bio-polyethylene Terephthalate (Bio-PET)
- 8.1.4. Polyhydroxyalkanoate (PHA)
- 8.1.5. Bio-polyethylene (Bio-PE)
- 8.1.6. Biodegradable Polyesters
- 8.1.7. Other Types
- 8.2. Market Analysis, Insights and Forecast - by Application
- 8.2.1. Packaging
- 8.2.1.1. Rigid
- 8.2.1.2. Flexible
- 8.2.2. Textiles
- 8.2.3. Consumer Goods
- 8.2.4. Automotive and Transportation
- 8.2.5. Agriculture and Horticulture
- 8.2.6. Building and Construction
- 8.2.7. Electrical and Electronics
- 8.2.8. Other Applications
- 8.2.1. Packaging
- 8.1. Market Analysis, Insights and Forecast - by Type
- 9. Europe Bio-based Resins Industry Analysis, Insights and Forecast, 2020-2032
- 9.1. Market Analysis, Insights and Forecast - by Type
- 9.1.1. Biodegradable Starch Blends
- 9.1.2. Polylactic Acid (PLA)
- 9.1.3. Bio-polyethylene Terephthalate (Bio-PET)
- 9.1.4. Polyhydroxyalkanoate (PHA)
- 9.1.5. Bio-polyethylene (Bio-PE)
- 9.1.6. Biodegradable Polyesters
- 9.1.7. Other Types
- 9.2. Market Analysis, Insights and Forecast - by Application
- 9.2.1. Packaging
- 9.2.1.1. Rigid
- 9.2.1.2. Flexible
- 9.2.2. Textiles
- 9.2.3. Consumer Goods
- 9.2.4. Automotive and Transportation
- 9.2.5. Agriculture and Horticulture
- 9.2.6. Building and Construction
- 9.2.7. Electrical and Electronics
- 9.2.8. Other Applications
- 9.2.1. Packaging
- 9.1. Market Analysis, Insights and Forecast - by Type
- 10. South America Bio-based Resins Industry Analysis, Insights and Forecast, 2020-2032
- 10.1. Market Analysis, Insights and Forecast - by Type
- 10.1.1. Biodegradable Starch Blends
- 10.1.2. Polylactic Acid (PLA)
- 10.1.3. Bio-polyethylene Terephthalate (Bio-PET)
- 10.1.4. Polyhydroxyalkanoate (PHA)
- 10.1.5. Bio-polyethylene (Bio-PE)
- 10.1.6. Biodegradable Polyesters
- 10.1.7. Other Types
- 10.2. Market Analysis, Insights and Forecast - by Application
- 10.2.1. Packaging
- 10.2.1.1. Rigid
- 10.2.1.2. Flexible
- 10.2.2. Textiles
- 10.2.3. Consumer Goods
- 10.2.4. Automotive and Transportation
- 10.2.5. Agriculture and Horticulture
- 10.2.6. Building and Construction
- 10.2.7. Electrical and Electronics
- 10.2.8. Other Applications
- 10.2.1. Packaging
- 10.1. Market Analysis, Insights and Forecast - by Type
- 11. Middle East Bio-based Resins Industry Analysis, Insights and Forecast, 2020-2032
- 11.1. Market Analysis, Insights and Forecast - by Type
- 11.1.1. Biodegradable Starch Blends
- 11.1.2. Polylactic Acid (PLA)
- 11.1.3. Bio-polyethylene Terephthalate (Bio-PET)
- 11.1.4. Polyhydroxyalkanoate (PHA)
- 11.1.5. Bio-polyethylene (Bio-PE)
- 11.1.6. Biodegradable Polyesters
- 11.1.7. Other Types
- 11.2. Market Analysis, Insights and Forecast - by Application
- 11.2.1. Packaging
- 11.2.1.1. Rigid
- 11.2.1.2. Flexible
- 11.2.2. Textiles
- 11.2.3. Consumer Goods
- 11.2.4. Automotive and Transportation
- 11.2.5. Agriculture and Horticulture
- 11.2.6. Building and Construction
- 11.2.7. Electrical and Electronics
- 11.2.8. Other Applications
- 11.2.1. Packaging
- 11.1. Market Analysis, Insights and Forecast - by Type
- 12. Saudi Arabia Bio-based Resins Industry Analysis, Insights and Forecast, 2020-2032
- 12.1. Market Analysis, Insights and Forecast - by Type
- 12.1.1. Biodegradable Starch Blends
- 12.1.2. Polylactic Acid (PLA)
- 12.1.3. Bio-polyethylene Terephthalate (Bio-PET)
- 12.1.4. Polyhydroxyalkanoate (PHA)
- 12.1.5. Bio-polyethylene (Bio-PE)
- 12.1.6. Biodegradable Polyesters
- 12.1.7. Other Types
- 12.2. Market Analysis, Insights and Forecast - by Application
- 12.2.1. Packaging
- 12.2.1.1. Rigid
- 12.2.1.2. Flexible
- 12.2.2. Textiles
- 12.2.3. Consumer Goods
- 12.2.4. Automotive and Transportation
- 12.2.5. Agriculture and Horticulture
- 12.2.6. Building and Construction
- 12.2.7. Electrical and Electronics
- 12.2.8. Other Applications
- 12.2.1. Packaging
- 12.1. Market Analysis, Insights and Forecast - by Type
- 13. Competitive Analysis
- 13.1. Company Profiles
- 13.1.1 Novamont SpA
- 13.1.1.1. Company Overview
- 13.1.1.2. Products
- 13.1.1.3. Company Financials
- 13.1.1.4. SWOT Analysis
- 13.1.2 Futerro
- 13.1.2.1. Company Overview
- 13.1.2.2. Products
- 13.1.2.3. Company Financials
- 13.1.2.4. SWOT Analysis
- 13.1.3 Arkema SA
- 13.1.3.1. Company Overview
- 13.1.3.2. Products
- 13.1.3.3. Company Financials
- 13.1.3.4. SWOT Analysis
- 13.1.4 Braskem
- 13.1.4.1. Company Overview
- 13.1.4.2. Products
- 13.1.4.3. Company Financials
- 13.1.4.4. SWOT Analysis
- 13.1.5 Corbion
- 13.1.5.1. Company Overview
- 13.1.5.2. Products
- 13.1.5.3. Company Financials
- 13.1.5.4. SWOT Analysis
- 13.1.6 BASF SE
- 13.1.6.1. Company Overview
- 13.1.6.2. Products
- 13.1.6.3. Company Financials
- 13.1.6.4. SWOT Analysis
- 13.1.7 Trinseo
- 13.1.7.1. Company Overview
- 13.1.7.2. Products
- 13.1.7.3. Company Financials
- 13.1.7.4. SWOT Analysis
- 13.1.8 Biotec
- 13.1.8.1. Company Overview
- 13.1.8.2. Products
- 13.1.8.3. Company Financials
- 13.1.8.4. SWOT Analysis
- 13.1.9 Yield10 Bioscience Inc
- 13.1.9.1. Company Overview
- 13.1.9.2. Products
- 13.1.9.3. Company Financials
- 13.1.9.4. SWOT Analysis
- 13.1.10 DuPont
- 13.1.10.1. Company Overview
- 13.1.10.2. Products
- 13.1.10.3. Company Financials
- 13.1.10.4. SWOT Analysis
- 13.1.11 Minima
- 13.1.11.1. Company Overview
- 13.1.11.2. Products
- 13.1.11.3. Company Financials
- 13.1.11.4. SWOT Analysis
- 13.1.12 Natureworks LLC
- 13.1.12.1. Company Overview
- 13.1.12.2. Products
- 13.1.12.3. Company Financials
- 13.1.12.4. SWOT Analysis
- 13.1.13 Danimer Scientific
- 13.1.13.1. Company Overview
- 13.1.13.2. Products
- 13.1.13.3. Company Financials
- 13.1.13.4. SWOT Analysis
- 13.1.1 Novamont SpA
- 13.2. Market Entropy
- 13.2.1 Company's Key Areas Served
- 13.2.2 Recent Developments
- 13.3. Company Market Share Analysis 2025
- 13.3.1 Top 5 Companies Market Share Analysis
- 13.3.2 Top 3 Companies Market Share Analysis
- 13.4. List of Potential Customers
- 14. Research Methodology
List of Figures
- Figure 1: Global Bio-based Resins Industry Revenue Breakdown (billion, %) by Region 2025 & 2033
- Figure 2: Global Bio-based Resins Industry Volume Breakdown (K Tons, %) by Region 2025 & 2033
- Figure 3: Asia Pacific Bio-based Resins Industry Revenue (billion), by Type 2025 & 2033
- Figure 4: Asia Pacific Bio-based Resins Industry Volume (K Tons), by Type 2025 & 2033
- Figure 5: Asia Pacific Bio-based Resins Industry Revenue Share (%), by Type 2025 & 2033
- Figure 6: Asia Pacific Bio-based Resins Industry Volume Share (%), by Type 2025 & 2033
- Figure 7: Asia Pacific Bio-based Resins Industry Revenue (billion), by Application 2025 & 2033
- Figure 8: Asia Pacific Bio-based Resins Industry Volume (K Tons), by Application 2025 & 2033
- Figure 9: Asia Pacific Bio-based Resins Industry Revenue Share (%), by Application 2025 & 2033
- Figure 10: Asia Pacific Bio-based Resins Industry Volume Share (%), by Application 2025 & 2033
- Figure 11: Asia Pacific Bio-based Resins Industry Revenue (billion), by Country 2025 & 2033
- Figure 12: Asia Pacific Bio-based Resins Industry Volume (K Tons), by Country 2025 & 2033
- Figure 13: Asia Pacific Bio-based Resins Industry Revenue Share (%), by Country 2025 & 2033
- Figure 14: Asia Pacific Bio-based Resins Industry Volume Share (%), by Country 2025 & 2033
- Figure 15: North America Bio-based Resins Industry Revenue (billion), by Type 2025 & 2033
- Figure 16: North America Bio-based Resins Industry Volume (K Tons), by Type 2025 & 2033
- Figure 17: North America Bio-based Resins Industry Revenue Share (%), by Type 2025 & 2033
- Figure 18: North America Bio-based Resins Industry Volume Share (%), by Type 2025 & 2033
- Figure 19: North America Bio-based Resins Industry Revenue (billion), by Application 2025 & 2033
- Figure 20: North America Bio-based Resins Industry Volume (K Tons), by Application 2025 & 2033
- Figure 21: North America Bio-based Resins Industry Revenue Share (%), by Application 2025 & 2033
- Figure 22: North America Bio-based Resins Industry Volume Share (%), by Application 2025 & 2033
- Figure 23: North America Bio-based Resins Industry Revenue (billion), by Country 2025 & 2033
- Figure 24: North America Bio-based Resins Industry Volume (K Tons), by Country 2025 & 2033
- Figure 25: North America Bio-based Resins Industry Revenue Share (%), by Country 2025 & 2033
- Figure 26: North America Bio-based Resins Industry Volume Share (%), by Country 2025 & 2033
- Figure 27: Europe Bio-based Resins Industry Revenue (billion), by Type 2025 & 2033
- Figure 28: Europe Bio-based Resins Industry Volume (K Tons), by Type 2025 & 2033
- Figure 29: Europe Bio-based Resins Industry Revenue Share (%), by Type 2025 & 2033
- Figure 30: Europe Bio-based Resins Industry Volume Share (%), by Type 2025 & 2033
- Figure 31: Europe Bio-based Resins Industry Revenue (billion), by Application 2025 & 2033
- Figure 32: Europe Bio-based Resins Industry Volume (K Tons), by Application 2025 & 2033
- Figure 33: Europe Bio-based Resins Industry Revenue Share (%), by Application 2025 & 2033
- Figure 34: Europe Bio-based Resins Industry Volume Share (%), by Application 2025 & 2033
- Figure 35: Europe Bio-based Resins Industry Revenue (billion), by Country 2025 & 2033
- Figure 36: Europe Bio-based Resins Industry Volume (K Tons), by Country 2025 & 2033
- Figure 37: Europe Bio-based Resins Industry Revenue Share (%), by Country 2025 & 2033
- Figure 38: Europe Bio-based Resins Industry Volume Share (%), by Country 2025 & 2033
- Figure 39: South America Bio-based Resins Industry Revenue (billion), by Type 2025 & 2033
- Figure 40: South America Bio-based Resins Industry Volume (K Tons), by Type 2025 & 2033
- Figure 41: South America Bio-based Resins Industry Revenue Share (%), by Type 2025 & 2033
- Figure 42: South America Bio-based Resins Industry Volume Share (%), by Type 2025 & 2033
- Figure 43: South America Bio-based Resins Industry Revenue (billion), by Application 2025 & 2033
- Figure 44: South America Bio-based Resins Industry Volume (K Tons), by Application 2025 & 2033
- Figure 45: South America Bio-based Resins Industry Revenue Share (%), by Application 2025 & 2033
- Figure 46: South America Bio-based Resins Industry Volume Share (%), by Application 2025 & 2033
- Figure 47: South America Bio-based Resins Industry Revenue (billion), by Country 2025 & 2033
- Figure 48: South America Bio-based Resins Industry Volume (K Tons), by Country 2025 & 2033
- Figure 49: South America Bio-based Resins Industry Revenue Share (%), by Country 2025 & 2033
- Figure 50: South America Bio-based Resins Industry Volume Share (%), by Country 2025 & 2033
- Figure 51: Middle East Bio-based Resins Industry Revenue (billion), by Type 2025 & 2033
- Figure 52: Middle East Bio-based Resins Industry Volume (K Tons), by Type 2025 & 2033
- Figure 53: Middle East Bio-based Resins Industry Revenue Share (%), by Type 2025 & 2033
- Figure 54: Middle East Bio-based Resins Industry Volume Share (%), by Type 2025 & 2033
- Figure 55: Middle East Bio-based Resins Industry Revenue (billion), by Application 2025 & 2033
- Figure 56: Middle East Bio-based Resins Industry Volume (K Tons), by Application 2025 & 2033
- Figure 57: Middle East Bio-based Resins Industry Revenue Share (%), by Application 2025 & 2033
- Figure 58: Middle East Bio-based Resins Industry Volume Share (%), by Application 2025 & 2033
- Figure 59: Middle East Bio-based Resins Industry Revenue (billion), by Country 2025 & 2033
- Figure 60: Middle East Bio-based Resins Industry Volume (K Tons), by Country 2025 & 2033
- Figure 61: Middle East Bio-based Resins Industry Revenue Share (%), by Country 2025 & 2033
- Figure 62: Middle East Bio-based Resins Industry Volume Share (%), by Country 2025 & 2033
- Figure 63: Saudi Arabia Bio-based Resins Industry Revenue (billion), by Type 2025 & 2033
- Figure 64: Saudi Arabia Bio-based Resins Industry Volume (K Tons), by Type 2025 & 2033
- Figure 65: Saudi Arabia Bio-based Resins Industry Revenue Share (%), by Type 2025 & 2033
- Figure 66: Saudi Arabia Bio-based Resins Industry Volume Share (%), by Type 2025 & 2033
- Figure 67: Saudi Arabia Bio-based Resins Industry Revenue (billion), by Application 2025 & 2033
- Figure 68: Saudi Arabia Bio-based Resins Industry Volume (K Tons), by Application 2025 & 2033
- Figure 69: Saudi Arabia Bio-based Resins Industry Revenue Share (%), by Application 2025 & 2033
- Figure 70: Saudi Arabia Bio-based Resins Industry Volume Share (%), by Application 2025 & 2033
- Figure 71: Saudi Arabia Bio-based Resins Industry Revenue (billion), by Country 2025 & 2033
- Figure 72: Saudi Arabia Bio-based Resins Industry Volume (K Tons), by Country 2025 & 2033
- Figure 73: Saudi Arabia Bio-based Resins Industry Revenue Share (%), by Country 2025 & 2033
- Figure 74: Saudi Arabia Bio-based Resins Industry Volume Share (%), by Country 2025 & 2033
List of Tables
- Table 1: Global Bio-based Resins Industry Revenue billion Forecast, by Type 2020 & 2033
- Table 2: Global Bio-based Resins Industry Volume K Tons Forecast, by Type 2020 & 2033
- Table 3: Global Bio-based Resins Industry Revenue billion Forecast, by Application 2020 & 2033
- Table 4: Global Bio-based Resins Industry Volume K Tons Forecast, by Application 2020 & 2033
- Table 5: Global Bio-based Resins Industry Revenue billion Forecast, by Region 2020 & 2033
- Table 6: Global Bio-based Resins Industry Volume K Tons Forecast, by Region 2020 & 2033
- Table 7: Global Bio-based Resins Industry Revenue billion Forecast, by Type 2020 & 2033
- Table 8: Global Bio-based Resins Industry Volume K Tons Forecast, by Type 2020 & 2033
- Table 9: Global Bio-based Resins Industry Revenue billion Forecast, by Application 2020 & 2033
- Table 10: Global Bio-based Resins Industry Volume K Tons Forecast, by Application 2020 & 2033
- Table 11: Global Bio-based Resins Industry Revenue billion Forecast, by Country 2020 & 2033
- Table 12: Global Bio-based Resins Industry Volume K Tons Forecast, by Country 2020 & 2033
- Table 13: China Bio-based Resins Industry Revenue (billion) Forecast, by Application 2020 & 2033
- Table 14: China Bio-based Resins Industry Volume (K Tons) Forecast, by Application 2020 & 2033
- Table 15: India Bio-based Resins Industry Revenue (billion) Forecast, by Application 2020 & 2033
- Table 16: India Bio-based Resins Industry Volume (K Tons) Forecast, by Application 2020 & 2033
- Table 17: Japan Bio-based Resins Industry Revenue (billion) Forecast, by Application 2020 & 2033
- Table 18: Japan Bio-based Resins Industry Volume (K Tons) Forecast, by Application 2020 & 2033
- Table 19: South Korea Bio-based Resins Industry Revenue (billion) Forecast, by Application 2020 & 2033
- Table 20: South Korea Bio-based Resins Industry Volume (K Tons) Forecast, by Application 2020 & 2033
- Table 21: Rest of Asia Pacific Bio-based Resins Industry Revenue (billion) Forecast, by Application 2020 & 2033
- Table 22: Rest of Asia Pacific Bio-based Resins Industry Volume (K Tons) Forecast, by Application 2020 & 2033
- Table 23: Global Bio-based Resins Industry Revenue billion Forecast, by Type 2020 & 2033
- Table 24: Global Bio-based Resins Industry Volume K Tons Forecast, by Type 2020 & 2033
- Table 25: Global Bio-based Resins Industry Revenue billion Forecast, by Application 2020 & 2033
- Table 26: Global Bio-based Resins Industry Volume K Tons Forecast, by Application 2020 & 2033
- Table 27: Global Bio-based Resins Industry Revenue billion Forecast, by Country 2020 & 2033
- Table 28: Global Bio-based Resins Industry Volume K Tons Forecast, by Country 2020 & 2033
- Table 29: United States Bio-based Resins Industry Revenue (billion) Forecast, by Application 2020 & 2033
- Table 30: United States Bio-based Resins Industry Volume (K Tons) Forecast, by Application 2020 & 2033
- Table 31: Canada Bio-based Resins Industry Revenue (billion) Forecast, by Application 2020 & 2033
- Table 32: Canada Bio-based Resins Industry Volume (K Tons) Forecast, by Application 2020 & 2033
- Table 33: Mexico Bio-based Resins Industry Revenue (billion) Forecast, by Application 2020 & 2033
- Table 34: Mexico Bio-based Resins Industry Volume (K Tons) Forecast, by Application 2020 & 2033
- Table 35: Global Bio-based Resins Industry Revenue billion Forecast, by Type 2020 & 2033
- Table 36: Global Bio-based Resins Industry Volume K Tons Forecast, by Type 2020 & 2033
- Table 37: Global Bio-based Resins Industry Revenue billion Forecast, by Application 2020 & 2033
- Table 38: Global Bio-based Resins Industry Volume K Tons Forecast, by Application 2020 & 2033
- Table 39: Global Bio-based Resins Industry Revenue billion Forecast, by Country 2020 & 2033
- Table 40: Global Bio-based Resins Industry Volume K Tons Forecast, by Country 2020 & 2033
- Table 41: Germany Bio-based Resins Industry Revenue (billion) Forecast, by Application 2020 & 2033
- Table 42: Germany Bio-based Resins Industry Volume (K Tons) Forecast, by Application 2020 & 2033
- Table 43: United Kingdom Bio-based Resins Industry Revenue (billion) Forecast, by Application 2020 & 2033
- Table 44: United Kingdom Bio-based Resins Industry Volume (K Tons) Forecast, by Application 2020 & 2033
- Table 45: France Bio-based Resins Industry Revenue (billion) Forecast, by Application 2020 & 2033
- Table 46: France Bio-based Resins Industry Volume (K Tons) Forecast, by Application 2020 & 2033
- Table 47: Italy Bio-based Resins Industry Revenue (billion) Forecast, by Application 2020 & 2033
- Table 48: Italy Bio-based Resins Industry Volume (K Tons) Forecast, by Application 2020 & 2033
- Table 49: Rest of Europe Bio-based Resins Industry Revenue (billion) Forecast, by Application 2020 & 2033
- Table 50: Rest of Europe Bio-based Resins Industry Volume (K Tons) Forecast, by Application 2020 & 2033
- Table 51: Global Bio-based Resins Industry Revenue billion Forecast, by Type 2020 & 2033
- Table 52: Global Bio-based Resins Industry Volume K Tons Forecast, by Type 2020 & 2033
- Table 53: Global Bio-based Resins Industry Revenue billion Forecast, by Application 2020 & 2033
- Table 54: Global Bio-based Resins Industry Volume K Tons Forecast, by Application 2020 & 2033
- Table 55: Global Bio-based Resins Industry Revenue billion Forecast, by Country 2020 & 2033
- Table 56: Global Bio-based Resins Industry Volume K Tons Forecast, by Country 2020 & 2033
- Table 57: Brazil Bio-based Resins Industry Revenue (billion) Forecast, by Application 2020 & 2033
- Table 58: Brazil Bio-based Resins Industry Volume (K Tons) Forecast, by Application 2020 & 2033
- Table 59: Argentina Bio-based Resins Industry Revenue (billion) Forecast, by Application 2020 & 2033
- Table 60: Argentina Bio-based Resins Industry Volume (K Tons) Forecast, by Application 2020 & 2033
- Table 61: Rest of South America Bio-based Resins Industry Revenue (billion) Forecast, by Application 2020 & 2033
- Table 62: Rest of South America Bio-based Resins Industry Volume (K Tons) Forecast, by Application 2020 & 2033
- Table 63: Global Bio-based Resins Industry Revenue billion Forecast, by Type 2020 & 2033
- Table 64: Global Bio-based Resins Industry Volume K Tons Forecast, by Type 2020 & 2033
- Table 65: Global Bio-based Resins Industry Revenue billion Forecast, by Application 2020 & 2033
- Table 66: Global Bio-based Resins Industry Volume K Tons Forecast, by Application 2020 & 2033
- Table 67: Global Bio-based Resins Industry Revenue billion Forecast, by Country 2020 & 2033
- Table 68: Global Bio-based Resins Industry Volume K Tons Forecast, by Country 2020 & 2033
- Table 69: Global Bio-based Resins Industry Revenue billion Forecast, by Type 2020 & 2033
- Table 70: Global Bio-based Resins Industry Volume K Tons Forecast, by Type 2020 & 2033
- Table 71: Global Bio-based Resins Industry Revenue billion Forecast, by Application 2020 & 2033
- Table 72: Global Bio-based Resins Industry Volume K Tons Forecast, by Application 2020 & 2033
- Table 73: Global Bio-based Resins Industry Revenue billion Forecast, by Country 2020 & 2033
- Table 74: Global Bio-based Resins Industry Volume K Tons Forecast, by Country 2020 & 2033
- Table 75: South Africa Bio-based Resins Industry Revenue (billion) Forecast, by Application 2020 & 2033
- Table 76: South Africa Bio-based Resins Industry Volume (K Tons) Forecast, by Application 2020 & 2033
- Table 77: Rest of Middle East Bio-based Resins Industry Revenue (billion) Forecast, by Application 2020 & 2033
- Table 78: Rest of Middle East Bio-based Resins Industry Volume (K Tons) Forecast, by Application 2020 & 2033
Frequently Asked Questions
1. What is the projected Compound Annual Growth Rate (CAGR) of the Bio-based Resins Industry?
The projected CAGR is approximately 9%.
2. Which companies are prominent players in the Bio-based Resins Industry?
Key companies in the market include Novamont SpA, Futerro, Arkema SA, Braskem, Corbion, BASF SE, Trinseo, Biotec, Yield10 Bioscience Inc, DuPont, Minima, Natureworks LLC, Danimer Scientific.
3. What are the main segments of the Bio-based Resins Industry?
The market segments include Type, Application.
4. Can you provide details about the market size?
The market size is estimated to be USD 1.4 billion as of 2022.
5. What are some drivers contributing to market growth?
; Environmental Factors Encouraging a Paradigm Shift; Surging Demand for Bioplastics in Flexible Packaging.
6. What are the notable trends driving market growth?
Flexible Packaging Segment to Dominate the Market Demand.
7. Are there any restraints impacting market growth?
; Lack of Awareness and High Cost Association; Availability of Cheaper Alternatives.
8. Can you provide examples of recent developments in the market?
N/A
9. What pricing options are available for accessing the report?
Pricing options include single-user, multi-user, and enterprise licenses priced at USD 4750, USD 5250, and USD 8750 respectively.
10. Is the market size provided in terms of value or volume?
The market size is provided in terms of value, measured in billion and volume, measured in K Tons.
11. Are there any specific market keywords associated with the report?
Yes, the market keyword associated with the report is "Bio-based Resins Industry," which aids in identifying and referencing the specific market segment covered.
12. How do I determine which pricing option suits my needs best?
The pricing options vary based on user requirements and access needs. Individual users may opt for single-user licenses, while businesses requiring broader access may choose multi-user or enterprise licenses for cost-effective access to the report.
13. Are there any additional resources or data provided in the Bio-based Resins Industry report?
While the report offers comprehensive insights, it's advisable to review the specific contents or supplementary materials provided to ascertain if additional resources or data are available.
14. How can I stay updated on further developments or reports in the Bio-based Resins Industry?
To stay informed about further developments, trends, and reports in the Bio-based Resins Industry, consider subscribing to industry newsletters, following relevant companies and organizations, or regularly checking reputable industry news sources and publications.
Methodology
Step 1 - Identification of Relevant Samples Size from Population Database


Step 2 - Approaches for Defining Global Market Size (Value, Volume* & Price*)

Note*: In applicable scenarios
Step 3 - Data Sources
Primary Research
- Web Analytics
- Survey Reports
- Research Institute
- Latest Research Reports
- Opinion Leaders
Secondary Research
- Annual Reports
- White Paper
- Latest Press Release
- Industry Association
- Paid Database
- Investor Presentations

Step 4 - Data Triangulation
Involves using different sources of information in order to increase the validity of a study
These sources are likely to be stakeholders in a program - participants, other researchers, program staff, other community members, and so on.
Then we put all data in single framework & apply various statistical tools to find out the dynamic on the market.
During the analysis stage, feedback from the stakeholder groups would be compared to determine areas of agreement as well as areas of divergence