Key Insights
The bio-ketones market is poised for substantial expansion, driven by escalating demand for sustainable and bio-based alternatives in ketone production. The market is projected to grow at a Compound Annual Growth Rate (CAGR) of 5.9%, reaching an estimated market size of 24.25 billion by 2025. Key growth catalysts include the burgeoning popularity of ketogenic diets, heightened awareness of ketone health benefits, and a strong industry focus on eco-friendly manufacturing processes. Innovations in biotechnology and fermentation are facilitating cost-effective and scalable bio-ketone production, further accelerating market growth. Despite initial investment requirements and potential regulatory considerations, the inherent sustainability and diverse application potential of bio-ketones across pharmaceuticals, cosmetics, and industrial chemicals ensure a positive long-term outlook.
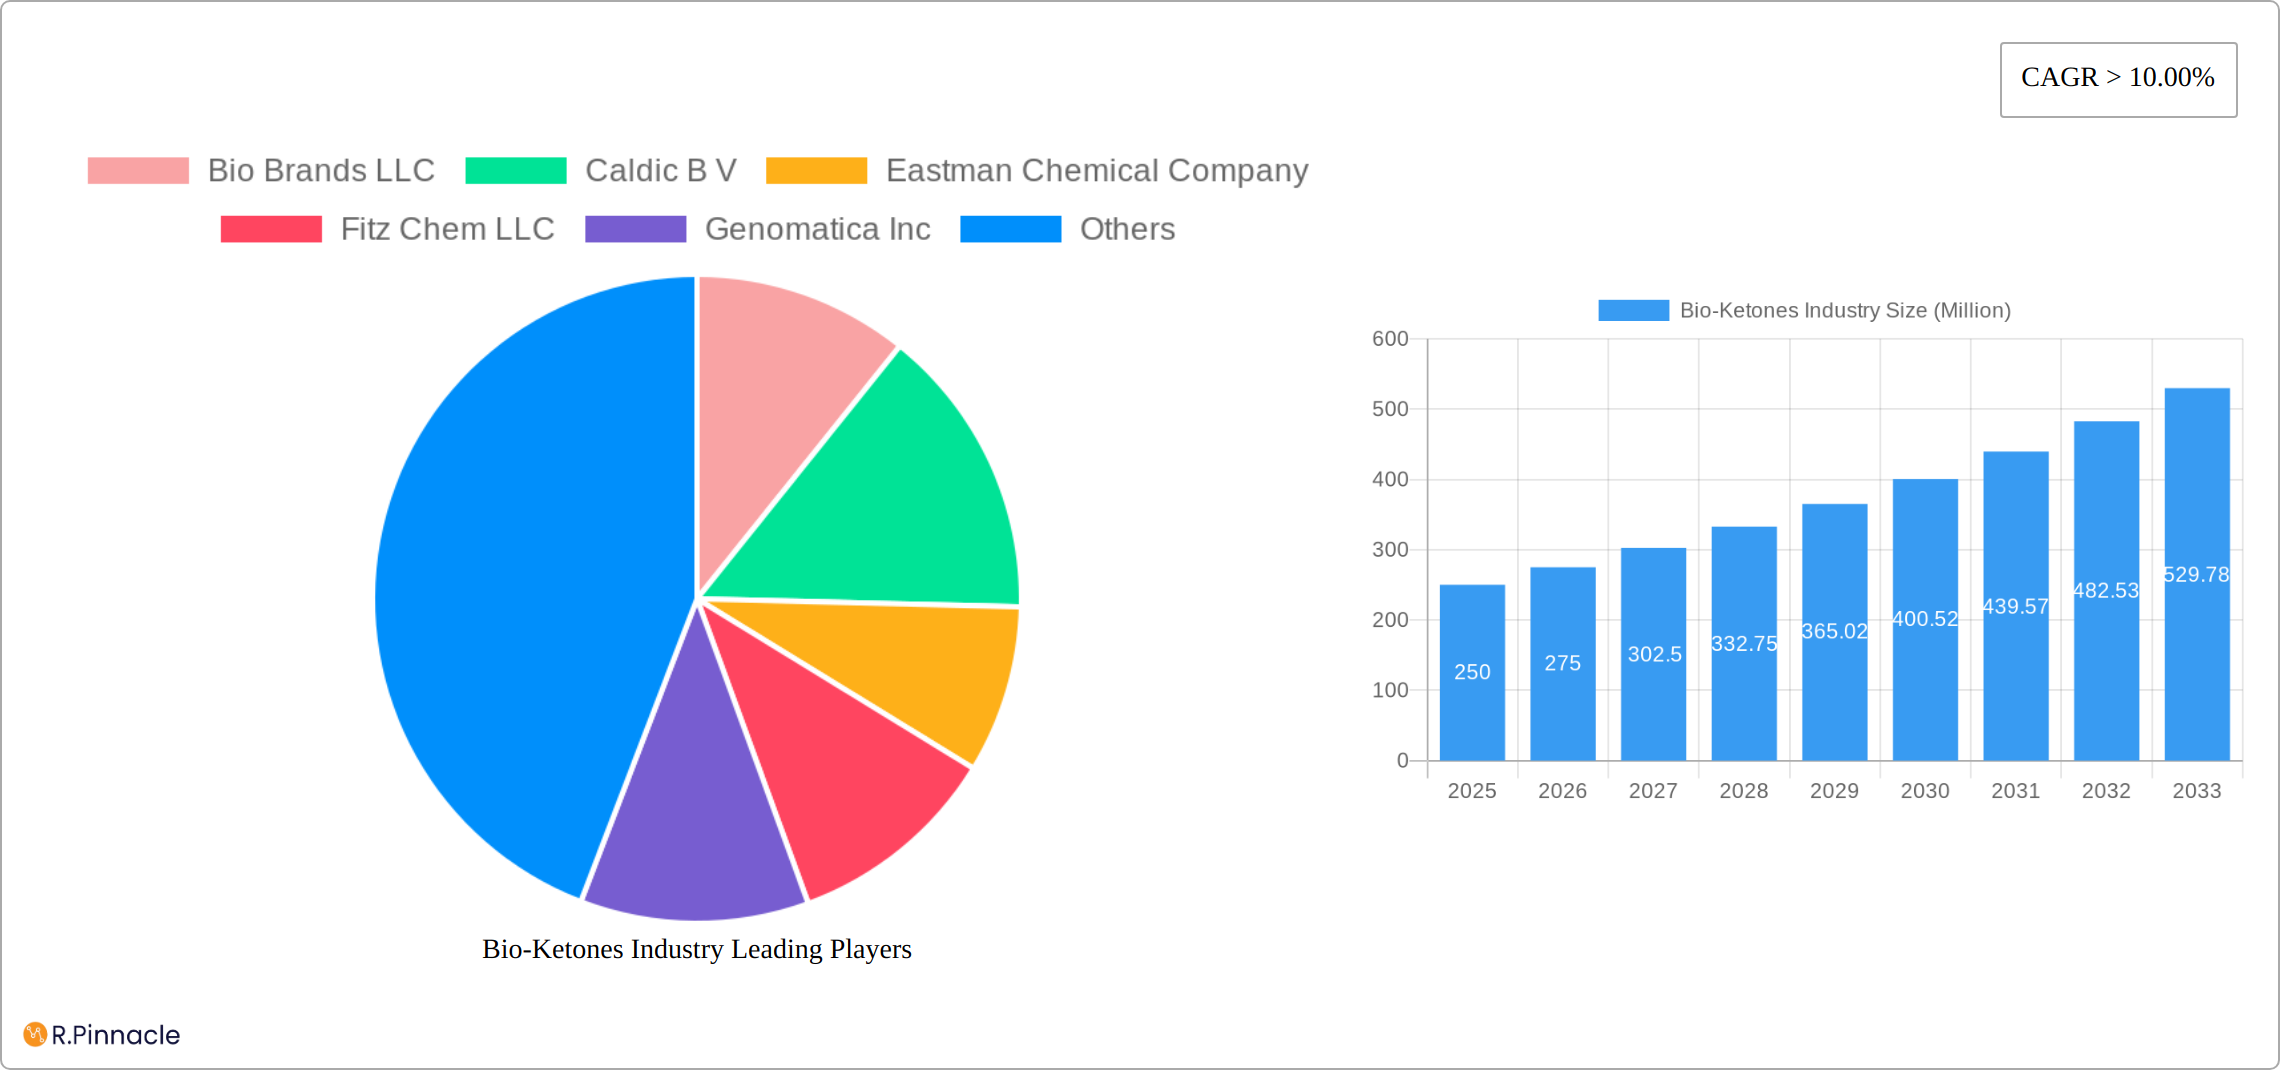
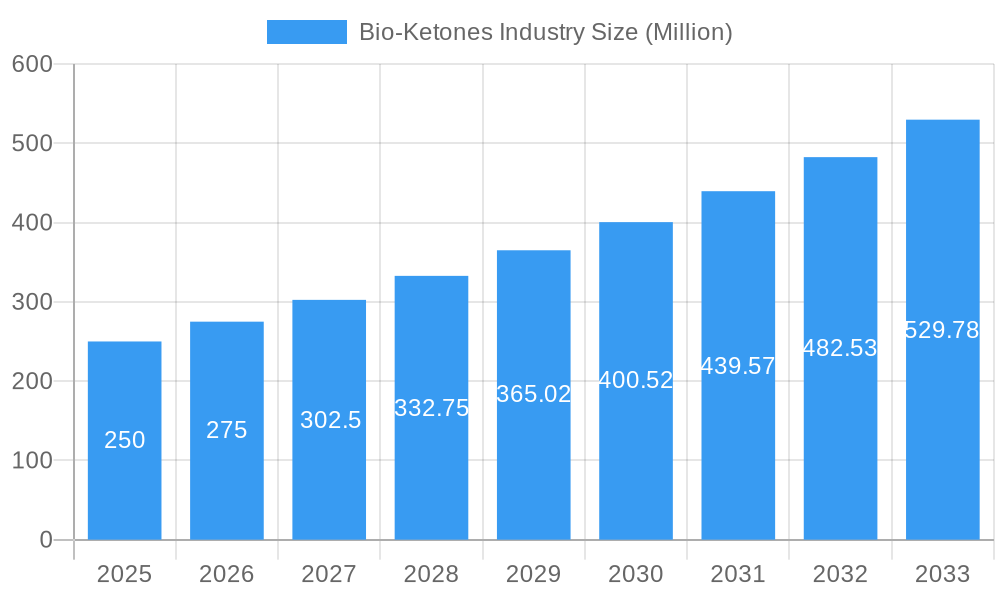
Bio-Ketones Industry Market Size (In Billion)
The bio-ketones market is segmented across food and beverages, dietary supplements, pharmaceuticals, and industrial chemicals. Leading entities, including Bio Brands LLC, Caldic B.V., Eastman Chemical Company, and Genomatica Inc., are prioritizing research and development to optimize production and enter new segments. North America and Europe are anticipated to lead market expansion due to robust consumer demand and developed infrastructure. However, emerging markets in Asia-Pacific and Latin America present significant growth potential, fueled by rising disposable incomes and increasing health and wellness consciousness. The forecast period of 2025-2033 anticipates continued market expansion, supported by ongoing innovation and the aforementioned drivers. The historical period (2019-2024) reflects growing market recognition and initial adoption, setting the stage for the significant growth projected in the coming years.
Bio-Ketones Industry Company Market Share
Bio-Ketones Industry Market Report: 2019-2033
This comprehensive report provides an in-depth analysis of the Bio-Ketones industry, offering valuable insights for industry professionals, investors, and strategic decision-makers. Covering the period from 2019 to 2033, with a base year of 2025 and a forecast period of 2025-2033, this report unveils the market's structure, dynamics, and future potential. The study includes detailed segmentation analysis, identifying key growth drivers and challenges, and profiling leading players such as Bio Brands LLC, Caldic B V, Eastman Chemical Company, Fitz Chem LLC, Genomatica Inc, Green Biologics Limited, LANZATECH, and Merck KGaA (note: list not exhaustive). The report projects a market valued at xx Million by 2033, presenting a compelling overview of this rapidly evolving sector.
Bio-Ketones Industry Market Structure & Innovation Trends
The Bio-Ketones market exhibits a moderately concentrated structure, with several key players holding significant market share. Eastman Chemical Company and Genomatica Inc., for instance, collectively hold an estimated xx% market share in 2025. However, the market also features a number of smaller, specialized players. Innovation is driven by the growing demand for sustainable and high-performance bio-based chemicals, coupled with advancements in biotechnology and fermentation technologies. Regulatory frameworks, particularly those concerning environmental sustainability and food safety, significantly influence market dynamics. The market faces competition from traditional petroleum-based ketone alternatives. End-user demographics are broad, encompassing diverse industries like food & beverage, pharmaceuticals, and cosmetics. Mergers and acquisitions (M&A) activity has been relatively moderate in recent years, with total deal values estimated at xx Million during 2019-2024, indicating potential for future consolidation.
Bio-Ketones Industry Market Dynamics & Trends
The bio-ketones market is experiencing robust growth, fueled by the burgeoning consumer demand for natural and sustainable products. Projected to achieve a CAGR of xx% between 2025 and 2033, the market demonstrates strong penetration across diverse applications. Significant advancements in fermentation technologies and genetic engineering are driving down production costs, making bio-ketones a compelling alternative to petrochemical-derived counterparts. This shift is further accelerated by increasingly stringent environmental regulations globally, pushing industries towards eco-friendly solutions. The competitive landscape is dynamic, characterized by established players and emerging competitors vying for market share through product differentiation, strategic alliances, and technological innovation. Specifically, market penetration within key sectors such as food and beverage is anticipated to increase by xx% during the forecast period. This growth is being driven by both increased consumer demand and a broader recognition of the sustainability benefits of bio-ketones.
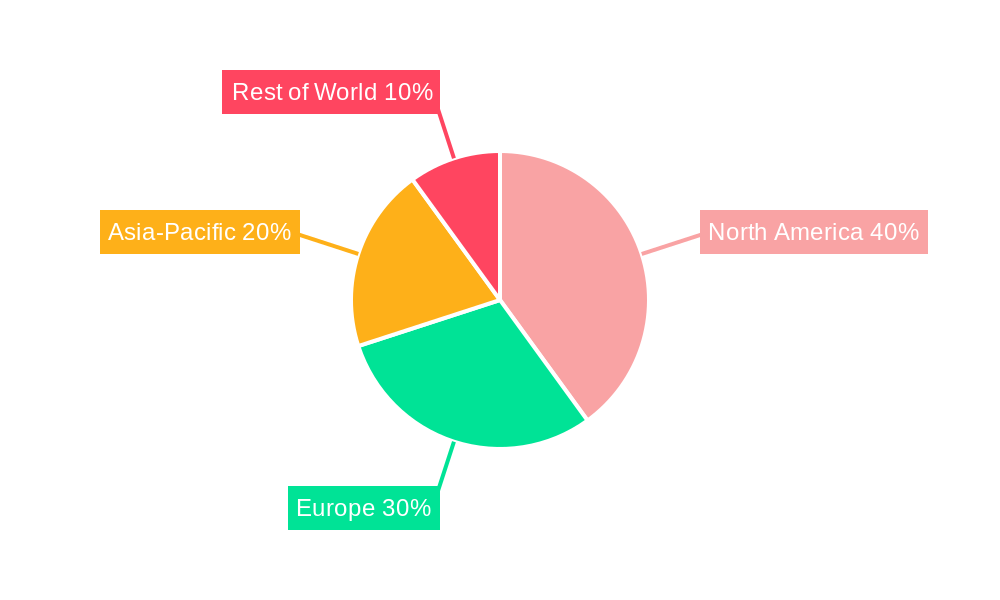
Dominant Regions & Segments in Bio-Ketones Industry
North America currently leads the global bio-ketones market, propelled by robust demand from the food and beverage industry, a sophisticated biotechnology infrastructure, and supportive government policies encouraging bio-based products.
- Key Drivers in North America:
- Substantial R&D investment in biotechnology.
- Well-established and efficient supply chains.
- A favorable regulatory environment that fosters the adoption of bio-based products.
- Strong consumer awareness and preference for sustainable alternatives.
North America's dominance is further reinforced by the presence of major industry players and widespread consumer acceptance of bio-based alternatives. While Europe and the Asia-Pacific region are poised for significant growth in the coming years, North America's established infrastructure and technological leadership are expected to maintain its leading position. A comprehensive regional analysis, detailing variations across different markets, is available in the complete report.
Bio-Ketones Industry Product Innovations
Recent innovations in the Bio-Ketones industry center on improving production efficiency and expanding applications. Advancements in fermentation technology, along with the development of novel microbial strains, are leading to higher yields and reduced production costs. New applications are continuously emerging, including the use of bio-ketones in biodegradable plastics and high-value specialty chemicals. This aligns with the broader trend towards sustainable and environmentally friendly alternatives to traditional petrochemical-based products. The ability to tailor the properties of bio-ketones opens up opportunities across a wide range of industries, creating a competitive advantage for producers.
Report Scope & Segmentation Analysis
This report segments the Bio-Ketones market by product type (e.g., acetone, butanone, etc.), application (e.g., food & beverage, pharmaceuticals, etc.), and geography (North America, Europe, Asia-Pacific, etc.). Each segment is analyzed individually, considering its growth projections, market size, and competitive dynamics. For example, the food & beverage segment is projected to experience a CAGR of xx% during the forecast period, driven by increasing demand for natural food additives. The pharmaceutical segment shows promise due to the use of bio-ketones in drug formulations, while the industrial segment growth is tied to eco-friendly alternatives in chemical production.
Key Drivers of Bio-Ketones Industry Growth
The Bio-Ketones industry is experiencing rapid growth propelled by several key factors: Firstly, the increasing demand for sustainable and environmentally friendly products is creating a significant market opportunity. Government regulations and incentives promoting the use of bio-based alternatives are further accelerating market expansion. Secondly, technological advancements in fermentation and bioprocess engineering are continuously improving production efficiency and reducing costs. Finally, the expanding applications of bio-ketones in diverse industries like food & beverage, pharmaceuticals, and cosmetics are fueling market growth.
Challenges in the Bio-Ketones Industry Sector
Despite its considerable growth potential, the bio-ketones industry confronts several challenges. High production costs relative to petrochemical-based alternatives remain a barrier to broader adoption. Supply chain complexities and securing consistent, sustainable feedstock sources present significant hurdles. Fluctuations in raw material prices also impact profitability and require robust risk management strategies. Furthermore, regulatory uncertainties and stringent environmental standards can increase production costs and create market entry barriers. Intense competition from established players and the emergence of new entrants further add to the complexities faced by businesses in this sector.
Emerging Opportunities in Bio-Ketones Industry
The bio-ketones industry offers compelling opportunities for expansion. Penetration into new and emerging markets, particularly in developing economies with growing consumer bases, presents significant potential. Technological innovation, including the development of more efficient fermentation processes and novel microbial strains, can further reduce production costs and enhance product quality. Exploring new applications in high-growth sectors like bioplastics and specialty chemicals creates avenues for market expansion. A strong focus on meeting consumer demand for sustainable and high-performance products will be critical for driving market penetration and adoption. Strategic partnerships and collaborations can also play a vital role in accelerating innovation and market access.
Leading Players in the Bio-Ketones Industry Market
- Bio Brands LLC
- Caldic B V
- Eastman Chemical Company
- Fitz Chem LLC
- Genomatica Inc
- Green Biologics Limited
- LANZATECH
- Merck KGaA
- List Not Exhaustive
Key Developments in Bio-Ketones Industry
- 2022 Q4: Genomatica Inc. announced a significant expansion of its bio-based acetone production facility.
- 2023 Q1: Eastman Chemical Company launched a new line of bio-based ketone derivatives for the cosmetics industry.
- 2024 Q2: A joint venture between Bio Brands LLC and Caldic B V was formed to explore new applications of bio-ketones in biodegradable plastics. (Further detailed developments are included in the full report)
Future Outlook for Bio-Ketones Industry Market
The future of the bio-ketones market appears promising, driven by increasing consumer demand for sustainable alternatives, continuous technological advancements, and supportive government policies. The market is poised for considerable expansion, with new applications and geographical markets constantly emerging. Companies implementing innovative strategies, emphasizing sustainability, and investing strategically in research and development are well-positioned to capture significant market share. The sustained growth of this market depends on effectively addressing cost challenges and optimizing supply chains for greater efficiency and resilience.
Bio-Ketones Industry Segmentation
-
1. Product Type
- 1.1. Bio MEK
- 1.2. Bio PEEK
- 1.3. Bio Acetone
- 1.4. Other Product Types
-
2. End-user Industry
- 2.1. Paints and Coatings
- 2.2. Automobile
- 2.3. Infrastructure
- 2.4. Pharmaceutical
- 2.5. Other End-user Industries
Bio-Ketones Industry Segmentation By Geography
-
1. Asia Pacific
- 1.1. China
- 1.2. India
- 1.3. Japan
- 1.4. South Korea
- 1.5. ASEAN Countries
- 1.6. Rest of Asia Pacific
-
2. North America
- 2.1. United States
- 2.2. Canada
- 2.3. Mexico
-
3. Europe
- 3.1. Germany
- 3.2. United Kingdom
- 3.3. Italy
- 3.4. France
- 3.5. Rest of Europe
-
4. South America
- 4.1. Brazil
- 4.2. Argentina
- 4.3. Rest of South America
-
5. Middle East and Africa
- 5.1. Saudi Arabia
- 5.2. South Africa
- 5.3. Rest of Middle East and Africa
Bio-Ketones Industry Regional Market Share
Geographic Coverage of Bio-Ketones Industry
Bio-Ketones Industry REPORT HIGHLIGHTS
| Aspects | Details |
|---|---|
| Study Period | 2020-2034 |
| Base Year | 2025 |
| Estimated Year | 2026 |
| Forecast Period | 2026-2034 |
| Historical Period | 2020-2025 |
| Growth Rate | CAGR of 5.9% from 2020-2034 |
| Segmentation |
|
Table of Contents
- 1. Introduction
- 1.1. Research Scope
- 1.2. Market Segmentation
- 1.3. Research Objective
- 1.4. Definitions and Assumptions
- 2. Executive Summary
- 2.1. Market Snapshot
- 3. Market Dynamics
- 3.1. Market Drivers
- 3.2. Market Restrains
- 3.3. Market Trends
- 3.4. Market Opportunities
- 4. Market Factor Analysis
- 4.1. Porters Five Forces
- 4.1.1. Bargaining Power of Suppliers
- 4.1.2. Bargaining Power of Buyers
- 4.1.3. Threat of New Entrants
- 4.1.4. Threat of Substitutes
- 4.1.5. Competitive Rivalry
- 4.2. PESTEL analysis
- 4.3. BCG Analysis
- 4.3.1. Stars (High Growth, High Market Share)
- 4.3.2. Cash Cows (Low Growth, High Market Share)
- 4.3.3. Question Mark (High Growth, Low Market Share)
- 4.3.4. Dogs (Low Growth, Low Market Share)
- 4.4. Ansoff Matrix Analysis
- 4.5. Supply Chain Analysis
- 4.6. Regulatory Landscape
- 4.7. Current Market Potential and Opportunity Assessment (TAM–SAM–SOM Framework)
- 4.8. PRI Analyst Note
- 4.1. Porters Five Forces
- 5. Market Analysis, Insights and Forecast 2021-2033
- 5.1. Market Analysis, Insights and Forecast - by Product Type
- 5.1.1. Bio MEK
- 5.1.2. Bio PEEK
- 5.1.3. Bio Acetone
- 5.1.4. Other Product Types
- 5.2. Market Analysis, Insights and Forecast - by End-user Industry
- 5.2.1. Paints and Coatings
- 5.2.2. Automobile
- 5.2.3. Infrastructure
- 5.2.4. Pharmaceutical
- 5.2.5. Other End-user Industries
- 5.3. Market Analysis, Insights and Forecast - by Region
- 5.3.1. Asia Pacific
- 5.3.2. North America
- 5.3.3. Europe
- 5.3.4. South America
- 5.3.5. Middle East and Africa
- 5.1. Market Analysis, Insights and Forecast - by Product Type
- 6. Global Bio-Ketones Industry Analysis, Insights and Forecast, 2021-2033
- 6.1. Market Analysis, Insights and Forecast - by Product Type
- 6.1.1. Bio MEK
- 6.1.2. Bio PEEK
- 6.1.3. Bio Acetone
- 6.1.4. Other Product Types
- 6.2. Market Analysis, Insights and Forecast - by End-user Industry
- 6.2.1. Paints and Coatings
- 6.2.2. Automobile
- 6.2.3. Infrastructure
- 6.2.4. Pharmaceutical
- 6.2.5. Other End-user Industries
- 6.1. Market Analysis, Insights and Forecast - by Product Type
- 7. Asia Pacific Bio-Ketones Industry Analysis, Insights and Forecast, 2020-2032
- 7.1. Market Analysis, Insights and Forecast - by Product Type
- 7.1.1. Bio MEK
- 7.1.2. Bio PEEK
- 7.1.3. Bio Acetone
- 7.1.4. Other Product Types
- 7.2. Market Analysis, Insights and Forecast - by End-user Industry
- 7.2.1. Paints and Coatings
- 7.2.2. Automobile
- 7.2.3. Infrastructure
- 7.2.4. Pharmaceutical
- 7.2.5. Other End-user Industries
- 7.1. Market Analysis, Insights and Forecast - by Product Type
- 8. North America Bio-Ketones Industry Analysis, Insights and Forecast, 2020-2032
- 8.1. Market Analysis, Insights and Forecast - by Product Type
- 8.1.1. Bio MEK
- 8.1.2. Bio PEEK
- 8.1.3. Bio Acetone
- 8.1.4. Other Product Types
- 8.2. Market Analysis, Insights and Forecast - by End-user Industry
- 8.2.1. Paints and Coatings
- 8.2.2. Automobile
- 8.2.3. Infrastructure
- 8.2.4. Pharmaceutical
- 8.2.5. Other End-user Industries
- 8.1. Market Analysis, Insights and Forecast - by Product Type
- 9. Europe Bio-Ketones Industry Analysis, Insights and Forecast, 2020-2032
- 9.1. Market Analysis, Insights and Forecast - by Product Type
- 9.1.1. Bio MEK
- 9.1.2. Bio PEEK
- 9.1.3. Bio Acetone
- 9.1.4. Other Product Types
- 9.2. Market Analysis, Insights and Forecast - by End-user Industry
- 9.2.1. Paints and Coatings
- 9.2.2. Automobile
- 9.2.3. Infrastructure
- 9.2.4. Pharmaceutical
- 9.2.5. Other End-user Industries
- 9.1. Market Analysis, Insights and Forecast - by Product Type
- 10. South America Bio-Ketones Industry Analysis, Insights and Forecast, 2020-2032
- 10.1. Market Analysis, Insights and Forecast - by Product Type
- 10.1.1. Bio MEK
- 10.1.2. Bio PEEK
- 10.1.3. Bio Acetone
- 10.1.4. Other Product Types
- 10.2. Market Analysis, Insights and Forecast - by End-user Industry
- 10.2.1. Paints and Coatings
- 10.2.2. Automobile
- 10.2.3. Infrastructure
- 10.2.4. Pharmaceutical
- 10.2.5. Other End-user Industries
- 10.1. Market Analysis, Insights and Forecast - by Product Type
- 11. Middle East and Africa Bio-Ketones Industry Analysis, Insights and Forecast, 2020-2032
- 11.1. Market Analysis, Insights and Forecast - by Product Type
- 11.1.1. Bio MEK
- 11.1.2. Bio PEEK
- 11.1.3. Bio Acetone
- 11.1.4. Other Product Types
- 11.2. Market Analysis, Insights and Forecast - by End-user Industry
- 11.2.1. Paints and Coatings
- 11.2.2. Automobile
- 11.2.3. Infrastructure
- 11.2.4. Pharmaceutical
- 11.2.5. Other End-user Industries
- 11.1. Market Analysis, Insights and Forecast - by Product Type
- 12. Competitive Analysis
- 12.1. Company Profiles
- 12.1.1 Bio Brands LLC
- 12.1.1.1. Company Overview
- 12.1.1.2. Products
- 12.1.1.3. Company Financials
- 12.1.1.4. SWOT Analysis
- 12.1.2 Caldic B V
- 12.1.2.1. Company Overview
- 12.1.2.2. Products
- 12.1.2.3. Company Financials
- 12.1.2.4. SWOT Analysis
- 12.1.3 Eastman Chemical Company
- 12.1.3.1. Company Overview
- 12.1.3.2. Products
- 12.1.3.3. Company Financials
- 12.1.3.4. SWOT Analysis
- 12.1.4 Fitz Chem LLC
- 12.1.4.1. Company Overview
- 12.1.4.2. Products
- 12.1.4.3. Company Financials
- 12.1.4.4. SWOT Analysis
- 12.1.5 Genomatica Inc
- 12.1.5.1. Company Overview
- 12.1.5.2. Products
- 12.1.5.3. Company Financials
- 12.1.5.4. SWOT Analysis
- 12.1.6 Green Biologics Limited
- 12.1.6.1. Company Overview
- 12.1.6.2. Products
- 12.1.6.3. Company Financials
- 12.1.6.4. SWOT Analysis
- 12.1.7 LANZATECH
- 12.1.7.1. Company Overview
- 12.1.7.2. Products
- 12.1.7.3. Company Financials
- 12.1.7.4. SWOT Analysis
- 12.1.8 Merck KGaA*List Not Exhaustive
- 12.1.8.1. Company Overview
- 12.1.8.2. Products
- 12.1.8.3. Company Financials
- 12.1.8.4. SWOT Analysis
- 12.1.1 Bio Brands LLC
- 12.2. Market Entropy
- 12.2.1 Company's Key Areas Served
- 12.2.2 Recent Developments
- 12.3. Company Market Share Analysis 2025
- 12.3.1 Top 5 Companies Market Share Analysis
- 12.3.2 Top 3 Companies Market Share Analysis
- 12.4. List of Potential Customers
- 13. Research Methodology
List of Figures
- Figure 1: Global Bio-Ketones Industry Revenue Breakdown (billion, %) by Region 2025 & 2033
- Figure 2: Asia Pacific Bio-Ketones Industry Revenue (billion), by Product Type 2025 & 2033
- Figure 3: Asia Pacific Bio-Ketones Industry Revenue Share (%), by Product Type 2025 & 2033
- Figure 4: Asia Pacific Bio-Ketones Industry Revenue (billion), by End-user Industry 2025 & 2033
- Figure 5: Asia Pacific Bio-Ketones Industry Revenue Share (%), by End-user Industry 2025 & 2033
- Figure 6: Asia Pacific Bio-Ketones Industry Revenue (billion), by Country 2025 & 2033
- Figure 7: Asia Pacific Bio-Ketones Industry Revenue Share (%), by Country 2025 & 2033
- Figure 8: North America Bio-Ketones Industry Revenue (billion), by Product Type 2025 & 2033
- Figure 9: North America Bio-Ketones Industry Revenue Share (%), by Product Type 2025 & 2033
- Figure 10: North America Bio-Ketones Industry Revenue (billion), by End-user Industry 2025 & 2033
- Figure 11: North America Bio-Ketones Industry Revenue Share (%), by End-user Industry 2025 & 2033
- Figure 12: North America Bio-Ketones Industry Revenue (billion), by Country 2025 & 2033
- Figure 13: North America Bio-Ketones Industry Revenue Share (%), by Country 2025 & 2033
- Figure 14: Europe Bio-Ketones Industry Revenue (billion), by Product Type 2025 & 2033
- Figure 15: Europe Bio-Ketones Industry Revenue Share (%), by Product Type 2025 & 2033
- Figure 16: Europe Bio-Ketones Industry Revenue (billion), by End-user Industry 2025 & 2033
- Figure 17: Europe Bio-Ketones Industry Revenue Share (%), by End-user Industry 2025 & 2033
- Figure 18: Europe Bio-Ketones Industry Revenue (billion), by Country 2025 & 2033
- Figure 19: Europe Bio-Ketones Industry Revenue Share (%), by Country 2025 & 2033
- Figure 20: South America Bio-Ketones Industry Revenue (billion), by Product Type 2025 & 2033
- Figure 21: South America Bio-Ketones Industry Revenue Share (%), by Product Type 2025 & 2033
- Figure 22: South America Bio-Ketones Industry Revenue (billion), by End-user Industry 2025 & 2033
- Figure 23: South America Bio-Ketones Industry Revenue Share (%), by End-user Industry 2025 & 2033
- Figure 24: South America Bio-Ketones Industry Revenue (billion), by Country 2025 & 2033
- Figure 25: South America Bio-Ketones Industry Revenue Share (%), by Country 2025 & 2033
- Figure 26: Middle East and Africa Bio-Ketones Industry Revenue (billion), by Product Type 2025 & 2033
- Figure 27: Middle East and Africa Bio-Ketones Industry Revenue Share (%), by Product Type 2025 & 2033
- Figure 28: Middle East and Africa Bio-Ketones Industry Revenue (billion), by End-user Industry 2025 & 2033
- Figure 29: Middle East and Africa Bio-Ketones Industry Revenue Share (%), by End-user Industry 2025 & 2033
- Figure 30: Middle East and Africa Bio-Ketones Industry Revenue (billion), by Country 2025 & 2033
- Figure 31: Middle East and Africa Bio-Ketones Industry Revenue Share (%), by Country 2025 & 2033
List of Tables
- Table 1: Global Bio-Ketones Industry Revenue billion Forecast, by Product Type 2020 & 2033
- Table 2: Global Bio-Ketones Industry Revenue billion Forecast, by End-user Industry 2020 & 2033
- Table 3: Global Bio-Ketones Industry Revenue billion Forecast, by Region 2020 & 2033
- Table 4: Global Bio-Ketones Industry Revenue billion Forecast, by Product Type 2020 & 2033
- Table 5: Global Bio-Ketones Industry Revenue billion Forecast, by End-user Industry 2020 & 2033
- Table 6: Global Bio-Ketones Industry Revenue billion Forecast, by Country 2020 & 2033
- Table 7: China Bio-Ketones Industry Revenue (billion) Forecast, by Application 2020 & 2033
- Table 8: India Bio-Ketones Industry Revenue (billion) Forecast, by Application 2020 & 2033
- Table 9: Japan Bio-Ketones Industry Revenue (billion) Forecast, by Application 2020 & 2033
- Table 10: South Korea Bio-Ketones Industry Revenue (billion) Forecast, by Application 2020 & 2033
- Table 11: ASEAN Countries Bio-Ketones Industry Revenue (billion) Forecast, by Application 2020 & 2033
- Table 12: Rest of Asia Pacific Bio-Ketones Industry Revenue (billion) Forecast, by Application 2020 & 2033
- Table 13: Global Bio-Ketones Industry Revenue billion Forecast, by Product Type 2020 & 2033
- Table 14: Global Bio-Ketones Industry Revenue billion Forecast, by End-user Industry 2020 & 2033
- Table 15: Global Bio-Ketones Industry Revenue billion Forecast, by Country 2020 & 2033
- Table 16: United States Bio-Ketones Industry Revenue (billion) Forecast, by Application 2020 & 2033
- Table 17: Canada Bio-Ketones Industry Revenue (billion) Forecast, by Application 2020 & 2033
- Table 18: Mexico Bio-Ketones Industry Revenue (billion) Forecast, by Application 2020 & 2033
- Table 19: Global Bio-Ketones Industry Revenue billion Forecast, by Product Type 2020 & 2033
- Table 20: Global Bio-Ketones Industry Revenue billion Forecast, by End-user Industry 2020 & 2033
- Table 21: Global Bio-Ketones Industry Revenue billion Forecast, by Country 2020 & 2033
- Table 22: Germany Bio-Ketones Industry Revenue (billion) Forecast, by Application 2020 & 2033
- Table 23: United Kingdom Bio-Ketones Industry Revenue (billion) Forecast, by Application 2020 & 2033
- Table 24: Italy Bio-Ketones Industry Revenue (billion) Forecast, by Application 2020 & 2033
- Table 25: France Bio-Ketones Industry Revenue (billion) Forecast, by Application 2020 & 2033
- Table 26: Rest of Europe Bio-Ketones Industry Revenue (billion) Forecast, by Application 2020 & 2033
- Table 27: Global Bio-Ketones Industry Revenue billion Forecast, by Product Type 2020 & 2033
- Table 28: Global Bio-Ketones Industry Revenue billion Forecast, by End-user Industry 2020 & 2033
- Table 29: Global Bio-Ketones Industry Revenue billion Forecast, by Country 2020 & 2033
- Table 30: Brazil Bio-Ketones Industry Revenue (billion) Forecast, by Application 2020 & 2033
- Table 31: Argentina Bio-Ketones Industry Revenue (billion) Forecast, by Application 2020 & 2033
- Table 32: Rest of South America Bio-Ketones Industry Revenue (billion) Forecast, by Application 2020 & 2033
- Table 33: Global Bio-Ketones Industry Revenue billion Forecast, by Product Type 2020 & 2033
- Table 34: Global Bio-Ketones Industry Revenue billion Forecast, by End-user Industry 2020 & 2033
- Table 35: Global Bio-Ketones Industry Revenue billion Forecast, by Country 2020 & 2033
- Table 36: Saudi Arabia Bio-Ketones Industry Revenue (billion) Forecast, by Application 2020 & 2033
- Table 37: South Africa Bio-Ketones Industry Revenue (billion) Forecast, by Application 2020 & 2033
- Table 38: Rest of Middle East and Africa Bio-Ketones Industry Revenue (billion) Forecast, by Application 2020 & 2033
Frequently Asked Questions
1. What is the projected Compound Annual Growth Rate (CAGR) of the Bio-Ketones Industry?
The projected CAGR is approximately 5.9%.
2. Which companies are prominent players in the Bio-Ketones Industry?
Key companies in the market include Bio Brands LLC, Caldic B V, Eastman Chemical Company, Fitz Chem LLC, Genomatica Inc, Green Biologics Limited, LANZATECH, Merck KGaA*List Not Exhaustive.
3. What are the main segments of the Bio-Ketones Industry?
The market segments include Product Type, End-user Industry.
4. Can you provide details about the market size?
The market size is estimated to be USD 24.25 billion as of 2022.
5. What are some drivers contributing to market growth?
; Increasing Demand from Cosmetics and Personal Care Industry; Supporting Government Regulations for the Use of Bio-products.
6. What are the notable trends driving market growth?
Bio PEEK to Dominate the Market.
7. Are there any restraints impacting market growth?
; Increasing Demand from Cosmetics and Personal Care Industry; Supporting Government Regulations for the Use of Bio-products.
8. Can you provide examples of recent developments in the market?
N/A
9. What pricing options are available for accessing the report?
Pricing options include single-user, multi-user, and enterprise licenses priced at USD 4750, USD 5250, and USD 8750 respectively.
10. Is the market size provided in terms of value or volume?
The market size is provided in terms of value, measured in billion.
11. Are there any specific market keywords associated with the report?
Yes, the market keyword associated with the report is "Bio-Ketones Industry," which aids in identifying and referencing the specific market segment covered.
12. How do I determine which pricing option suits my needs best?
The pricing options vary based on user requirements and access needs. Individual users may opt for single-user licenses, while businesses requiring broader access may choose multi-user or enterprise licenses for cost-effective access to the report.
13. Are there any additional resources or data provided in the Bio-Ketones Industry report?
While the report offers comprehensive insights, it's advisable to review the specific contents or supplementary materials provided to ascertain if additional resources or data are available.
14. How can I stay updated on further developments or reports in the Bio-Ketones Industry?
To stay informed about further developments, trends, and reports in the Bio-Ketones Industry, consider subscribing to industry newsletters, following relevant companies and organizations, or regularly checking reputable industry news sources and publications.
Methodology
Step 1 - Identification of Relevant Samples Size from Population Database


Step 2 - Approaches for Defining Global Market Size (Value, Volume* & Price*)

Note*: In applicable scenarios
Step 3 - Data Sources
Primary Research
- Web Analytics
- Survey Reports
- Research Institute
- Latest Research Reports
- Opinion Leaders
Secondary Research
- Annual Reports
- White Paper
- Latest Press Release
- Industry Association
- Paid Database
- Investor Presentations

Step 4 - Data Triangulation
Involves using different sources of information in order to increase the validity of a study
These sources are likely to be stakeholders in a program - participants, other researchers, program staff, other community members, and so on.
Then we put all data in single framework & apply various statistical tools to find out the dynamic on the market.
During the analysis stage, feedback from the stakeholder groups would be compared to determine areas of agreement as well as areas of divergence

