

Key Insights
The global Biological LED Lighting market is poised for substantial growth, driven by increasing adoption across various sectors including plant lighting, livestock lighting, and aquatic lighting. The market, valued at an estimated $88.17 billion in 2024, is projected to expand at a Compound Annual Growth Rate (CAGR) of 7.8% through 2033. This robust expansion is fueled by the inherent benefits of LED technology, such as energy efficiency, precise spectrum control, and extended lifespan, which translate into significant operational cost savings and enhanced productivity for end-users. The demand for specialized LED lighting solutions that cater to the specific needs of biological applications, including optimizing plant growth in controlled environments, improving animal welfare and productivity in agriculture, and supporting marine life in aquariums, is a primary growth catalyst. Innovations in spectrum tuning and smart lighting controls further enhance the appeal of biological LED lighting, enabling tailored solutions for diverse applications.

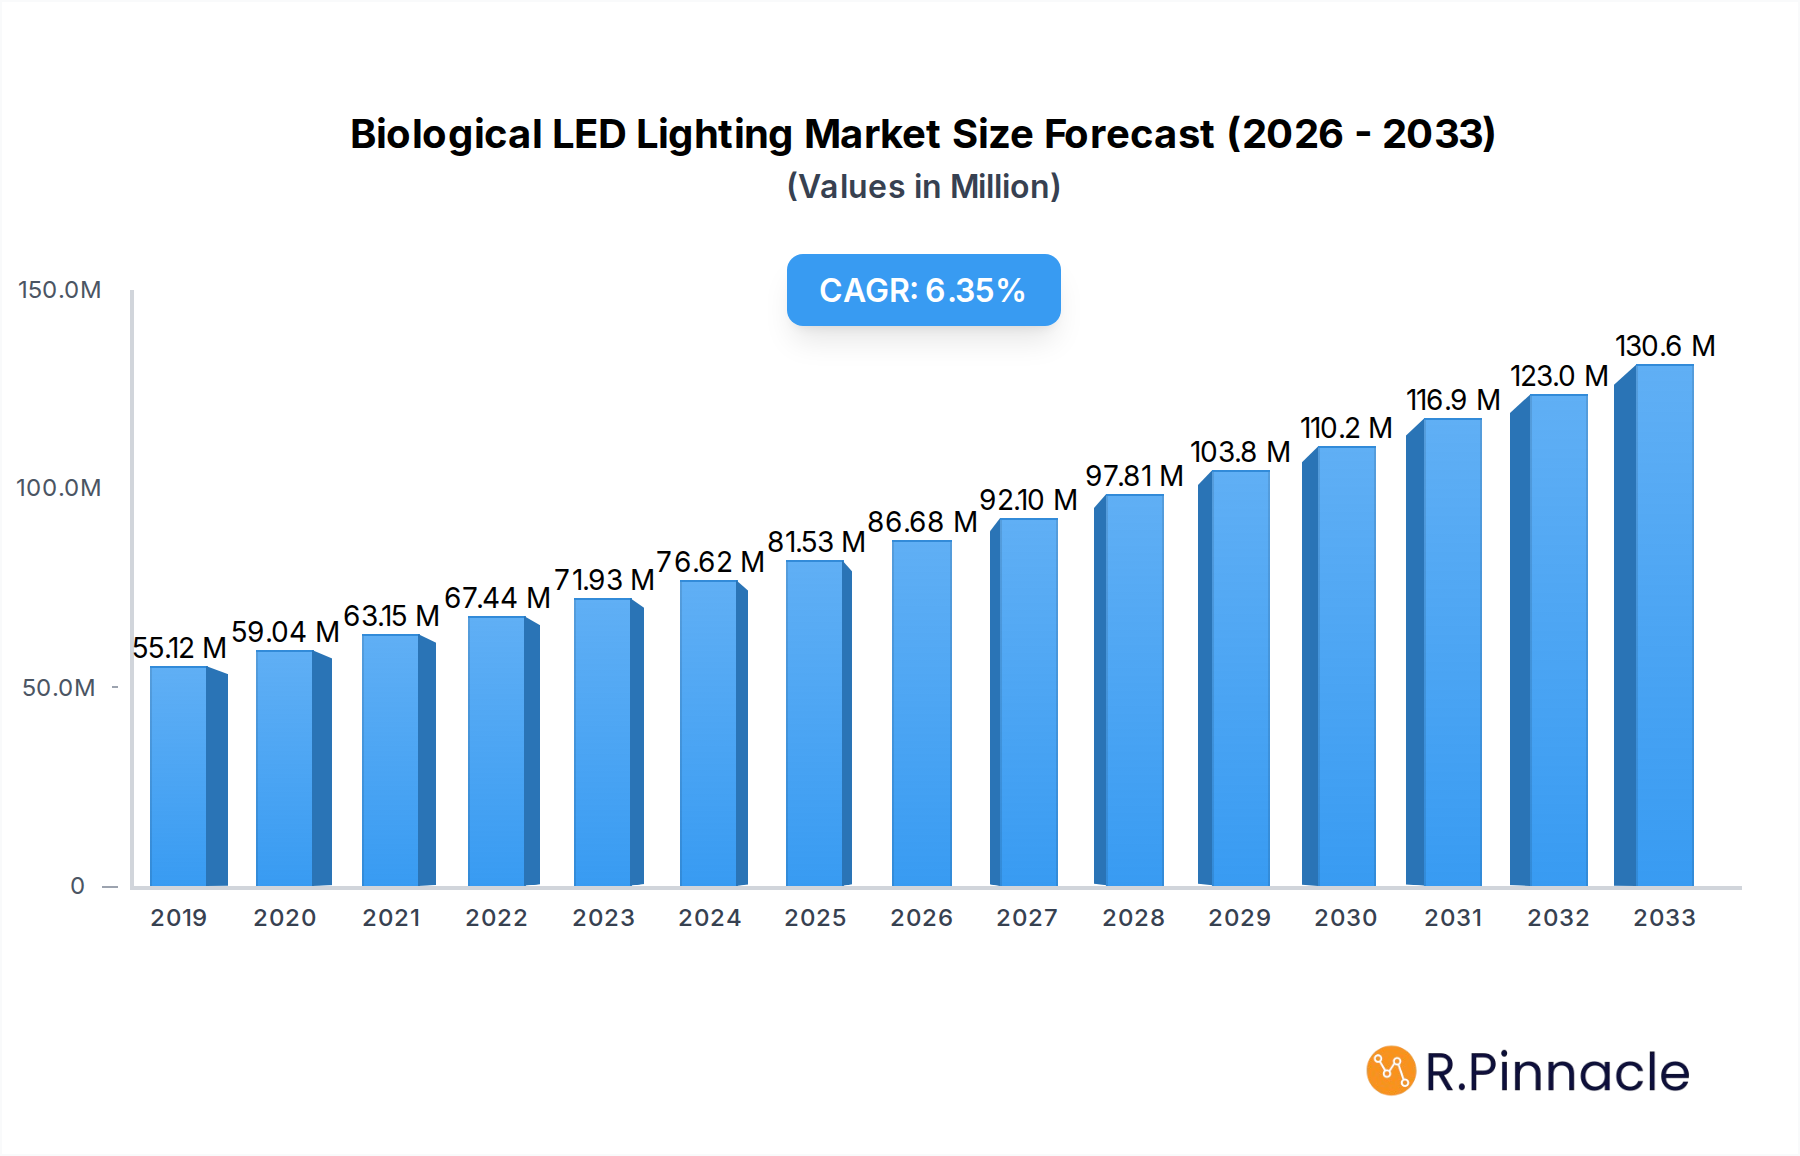
Biological LED Lighting Market Size (In Million)
The market is characterized by a dynamic competitive landscape with key players like General Electric, Osram, and Everlight Electronics investing heavily in research and development to introduce advanced and energy-efficient lighting solutions. The market segmentation reveals a significant presence of lighting solutions below 100W, catering to smaller-scale applications, alongside a growing demand for higher wattage products (100W-300W and above 300W) for large-scale commercial operations in horticulture and aquaculture. Geographically, the Asia Pacific region, particularly China and India, is expected to witness the fastest growth due to rapid industrialization and increasing investments in vertical farming and aquaculture. North America and Europe remain significant markets, driven by stringent energy efficiency regulations and a strong emphasis on sustainable agricultural practices. While the market presents immense opportunities, challenges such as initial high investment costs and the need for greater awareness regarding the benefits of specialized biological LED lighting solutions in certain developing regions may pose some restraints.
Biological LED Lighting Company Market Share
Unlocking the Potential: Biological LED Lighting Market Report 2019-2033
Unlock the future of controlled environment agriculture, livestock welfare, and aquatic ecosystems with our comprehensive Biological LED Lighting Market Report. This in-depth analysis delves into the evolving landscape of specialized LED solutions, projecting a market size of over $100 billion by 2033. Fueled by a CAGR of 22.5% from 2025-2033, this report provides critical insights for investors, manufacturers, and industry stakeholders navigating this rapidly expanding sector.
Biological LED Lighting Market Structure & Innovation Trends
The biological LED lighting market exhibits a dynamic structure, characterized by a blend of established lighting giants and specialized innovators. Market concentration is moderate, with key players such as General Electric, Osram, Everlight Electronics, Gavita, Hubbell Lighting, Kessil, Cree, Illumitex, Ohmax Optoelectronic, CBM Lighting, Aruna Lighting Holding B.V., HATO Agricultural Lighting, Sunbird Lighting Pty Ltd, and Greengage Agritech Ltd holding significant, though fragmented, market shares. Innovation drivers are primarily technological advancements in spectral customization, energy efficiency, and intelligent control systems, critical for optimizing plant growth, animal well-being, and aquatic life support. Regulatory frameworks are gradually evolving, with a growing emphasis on energy efficiency standards and environmental impact assessments. Product substitutes, such as traditional high-intensity discharge (HID) lamps, are steadily being displaced by the superior performance and cost-effectiveness of biological LEDs. End-user demographics span commercial growers, livestock farms, aquaculture operations, and research institutions. Mergers and acquisitions (M&A) activities are anticipated to increase, with an estimated deal value exceeding $15 billion during the forecast period, as larger entities seek to acquire cutting-edge technologies and expand their portfolios.
Biological LED Lighting Market Dynamics & Trends
The biological LED lighting market is experiencing robust growth, driven by an escalating global demand for enhanced agricultural yields, improved livestock welfare, and sustainable aquaculture practices. The core market growth drivers include the burgeoning need for food security to support a growing global population, the increasing adoption of vertical farming and controlled environment agriculture (CEA) technologies, and a heightened awareness regarding the positive impact of specific light spectrums on plant photomorphogenesis and animal behavior. Technological disruptions are at the forefront, with continuous advancements in LED chip technology, spectral engineering, and smart lighting controls enabling precise light delivery tailored to the unique needs of different organisms. This includes innovations in dimming capabilities, programmable light recipes, and integration with IoT platforms for real-time monitoring and optimization. Consumer preferences are shifting towards sustainably produced food and ethically raised livestock, directly influencing the demand for biological LED lighting solutions that offer both efficiency and improved outcomes. Competitive dynamics are intensifying, with companies vying for market share through product differentiation, strategic partnerships, and aggressive research and development. The market penetration of biological LEDs, while still in its growth phase, is rapidly increasing across all application segments. The total market size is projected to reach over $100 billion by 2033, with a Compound Annual Growth Rate (CAGR) of 22.5% from 2025 to 2033, reflecting the significant market potential and ongoing adoption trends. The historical period from 2019 to 2024 has laid the foundation for this rapid expansion, with early adopters and technological pioneers establishing the groundwork for widespread acceptance.
Dominant Regions & Segments in Biological LED Lighting
North America, particularly the United States, is emerging as the dominant region in the biological LED lighting market. This dominance is propelled by significant government investments in agricultural innovation, the widespread adoption of vertical farming and greenhouse cultivation, and robust demand for energy-efficient solutions. The economic policies supporting renewable energy and sustainable agriculture, coupled with advanced infrastructure for technology deployment, further solidify North America's leading position.
- Key Drivers in North America:
- Government incentives for sustainable farming and energy efficiency.
- High prevalence of controlled environment agriculture (CEA) and vertical farms.
- Strong research and development capabilities in lighting technology.
- Growing consumer demand for locally sourced and sustainably grown produce.
In terms of application segments, Plant Lighting commands the largest market share and is projected to maintain its lead throughout the forecast period. The exponential growth of indoor farming, precision agriculture, and the need for year-round crop production in diverse climates are primary contributors. Advanced spectral tuning for specific plant growth stages, from germination to flowering, is a key technological driver.
- Dominance of Plant Lighting:
- Critical for optimizing crop yields, quality, and nutritional content.
- Enables year-round production, reducing reliance on seasonal agriculture.
- Crucial for urban farming and vertical agriculture initiatives.
- Spectral customization for different plant species and growth phases.
Within the Types segmentation, the 100W-300W category is expected to exhibit the fastest growth. This segment offers an optimal balance of power, efficiency, and cost-effectiveness for a wide range of horticultural applications, providing sufficient light intensity for significant plant growth without excessive energy consumption.
- Growth in 100W-300W Type:
- Ideal power range for most greenhouse and vertical farm setups.
- Offers a balance of light intensity and energy efficiency.
- Cost-effective solution for scaling operations.
- Growing adoption in mid-sized and commercial growing facilities.
The study period of 2019–2033, with a base year of 2025, and a forecast period of 2025–2033, highlights the sustained upward trajectory of this market, building upon the historical foundation of 2019–2024.
Biological LED Lighting Product Innovations
Biological LED lighting is witnessing rapid product innovation, focused on delivering tailored light spectrums for specific biological processes. Advancements include the development of high-efficiency LEDs with tunable wavelengths to optimize plant photosynthesis, flowering, and nutrient content, as well as enhance animal welfare and aquatic ecosystem health. Competitive advantages lie in energy savings, reduced heat emission, extended lifespan, and precise control over light recipes, leading to improved yields and resource efficiency in agriculture, livestock, and aquaculture.
Report Scope & Segmentation Analysis
This report provides a comprehensive analysis of the biological LED lighting market segmented by Application and Type.
Application Segmentation:
- Plant Lighting: Expected to dominate the market, driven by the growth of controlled environment agriculture, vertical farming, and the demand for optimized crop production. Projections indicate significant market size and sustained competitive intensity in this segment.
- Livestock Lighting: Growing demand for improved animal welfare, productivity, and reduced stress through carefully controlled light spectrums and photoperiods. Market size is expected to increase as awareness and adoption rise.
- Aquatic Lighting: Essential for aquaculture and marine research, this segment focuses on optimizing the growth and health of aquatic organisms through specific light conditions. Market dynamics are influenced by the expanding aquaculture industry.
Type Segmentation:
- Below 100W: Primarily used in smaller-scale applications, research settings, and specialized supplementary lighting.
- 100W-300W: Expected to be the fastest-growing segment, offering a balanced solution for commercial horticulture and livestock applications.
- Above 300W: Utilized in large-scale industrial agriculture and high-intensity lighting requirements, with substantial market share and growth potential.
Key Drivers of Biological LED Lighting Growth
The significant growth of the biological LED lighting market is propelled by a confluence of technological, economic, and regulatory factors. Technologically, continuous innovation in LED efficiency, spectral control, and smart lighting systems allows for precise light recipes that optimize plant growth, animal behavior, and aquatic life. Economically, the increasing demand for enhanced agricultural yields to ensure food security, coupled with the rising adoption of energy-efficient solutions, drives market expansion. Furthermore, government initiatives and subsidies promoting sustainable agriculture and renewable energy adoption play a crucial role. For instance, the pursuit of higher crop yields in urban environments through vertical farming necessitates specialized LED solutions, while the demand for improved livestock welfare incentivizes the adoption of lighting that mimics natural light cycles.
Challenges in the Biological LED Lighting Sector
Despite its promising trajectory, the biological LED lighting sector faces several challenges. High initial investment costs for advanced LED systems can be a barrier for smaller operations, impacting market penetration. Regulatory hurdles, though evolving, can still present complexities in terms of certifications and standards across different regions. Supply chain issues, including the availability of specialized components and potential disruptions, can affect production timelines and costs. Moreover, the competitive pressure from established lighting technologies, while diminishing, still exists in certain market segments. The need for continuous R&D to keep pace with rapid technological advancements also poses a significant challenge, requiring substantial financial and intellectual resources.
Emerging Opportunities in Biological LED Lighting
The biological LED lighting market presents a wealth of emerging opportunities. The expansion of vertical farming and controlled environment agriculture in urban and peri-urban areas offers a significant growth avenue. Development of AI-powered, adaptive lighting systems that automatically adjust spectrum and intensity based on real-time biological feedback presents a cutting-edge opportunity. Increased focus on sustainability and reduced carbon footprints in food production creates demand for energy-efficient and environmentally friendly lighting solutions. Furthermore, the potential to integrate biological LED lighting with other smart farming technologies, such as sensors and automated irrigation, opens up new avenues for comprehensive farm management solutions.
Leading Players in the Biological LED Lighting Market
- General Electric
- Osram
- Everlight Electronics
- Gavita
- Hubbell Lighting
- Kessil
- Cree
- Illumitex
- Ohmax Optoelectronic
- CBM Lighting
- Aruna Lighting Holding B.V.
- HATO Agricultural Lighting
- Sunbird Lighting Pty Ltd
- Greengage Agritech Ltd
Key Developments in Biological LED Lighting Industry
- 2023: Significant advancements in spectral precision and energy efficiency for horticultural LEDs, enabling tailored light recipes for specific crop varieties.
- 2022: Increased adoption of IoT-enabled smart lighting systems in commercial greenhouses for remote monitoring and automated adjustments.
- 2021: Growing focus on developing LEDs that support animal welfare in livestock farming, mimicking natural light cycles to reduce stress and improve productivity.
- 2020: Expansion of biological LED lighting applications in aquaculture to optimize fish growth and health.
- 2019: Emergence of specialized spectral solutions for emerging crops and niche agricultural applications.
Future Outlook for Biological LED Lighting Market
The future outlook for the biological LED lighting market is exceptionally strong, driven by the persistent global demand for efficient and sustainable solutions in agriculture, livestock, and aquaculture. Continued technological innovation, particularly in spectral customization, energy efficiency, and smart control systems, will further accelerate market adoption. The increasing integration of biological LED lighting with other smart farming technologies and the growing emphasis on data-driven optimization will unlock new levels of productivity and resource efficiency. The market is poised for sustained growth, offering significant strategic opportunities for companies to innovate and expand their presence in this vital sector.
Biological LED Lighting Segmentation
-
1. Application
- 1.1. Plant Lighting
- 1.2. Livestock Lighting
- 1.3. Aquatic Lighting
-
2. Types
- 2.1. Below 100W
- 2.2. 100W-300W
- 2.3. Above 300W
Biological LED Lighting Segmentation By Geography
-
1. North America
- 1.1. United States
- 1.2. Canada
- 1.3. Mexico
-
2. South America
- 2.1. Brazil
- 2.2. Argentina
- 2.3. Rest of South America
-
3. Europe
- 3.1. United Kingdom
- 3.2. Germany
- 3.3. France
- 3.4. Italy
- 3.5. Spain
- 3.6. Russia
- 3.7. Benelux
- 3.8. Nordics
- 3.9. Rest of Europe
-
4. Middle East & Africa
- 4.1. Turkey
- 4.2. Israel
- 4.3. GCC
- 4.4. North Africa
- 4.5. South Africa
- 4.6. Rest of Middle East & Africa
-
5. Asia Pacific
- 5.1. China
- 5.2. India
- 5.3. Japan
- 5.4. South Korea
- 5.5. ASEAN
- 5.6. Oceania
- 5.7. Rest of Asia Pacific
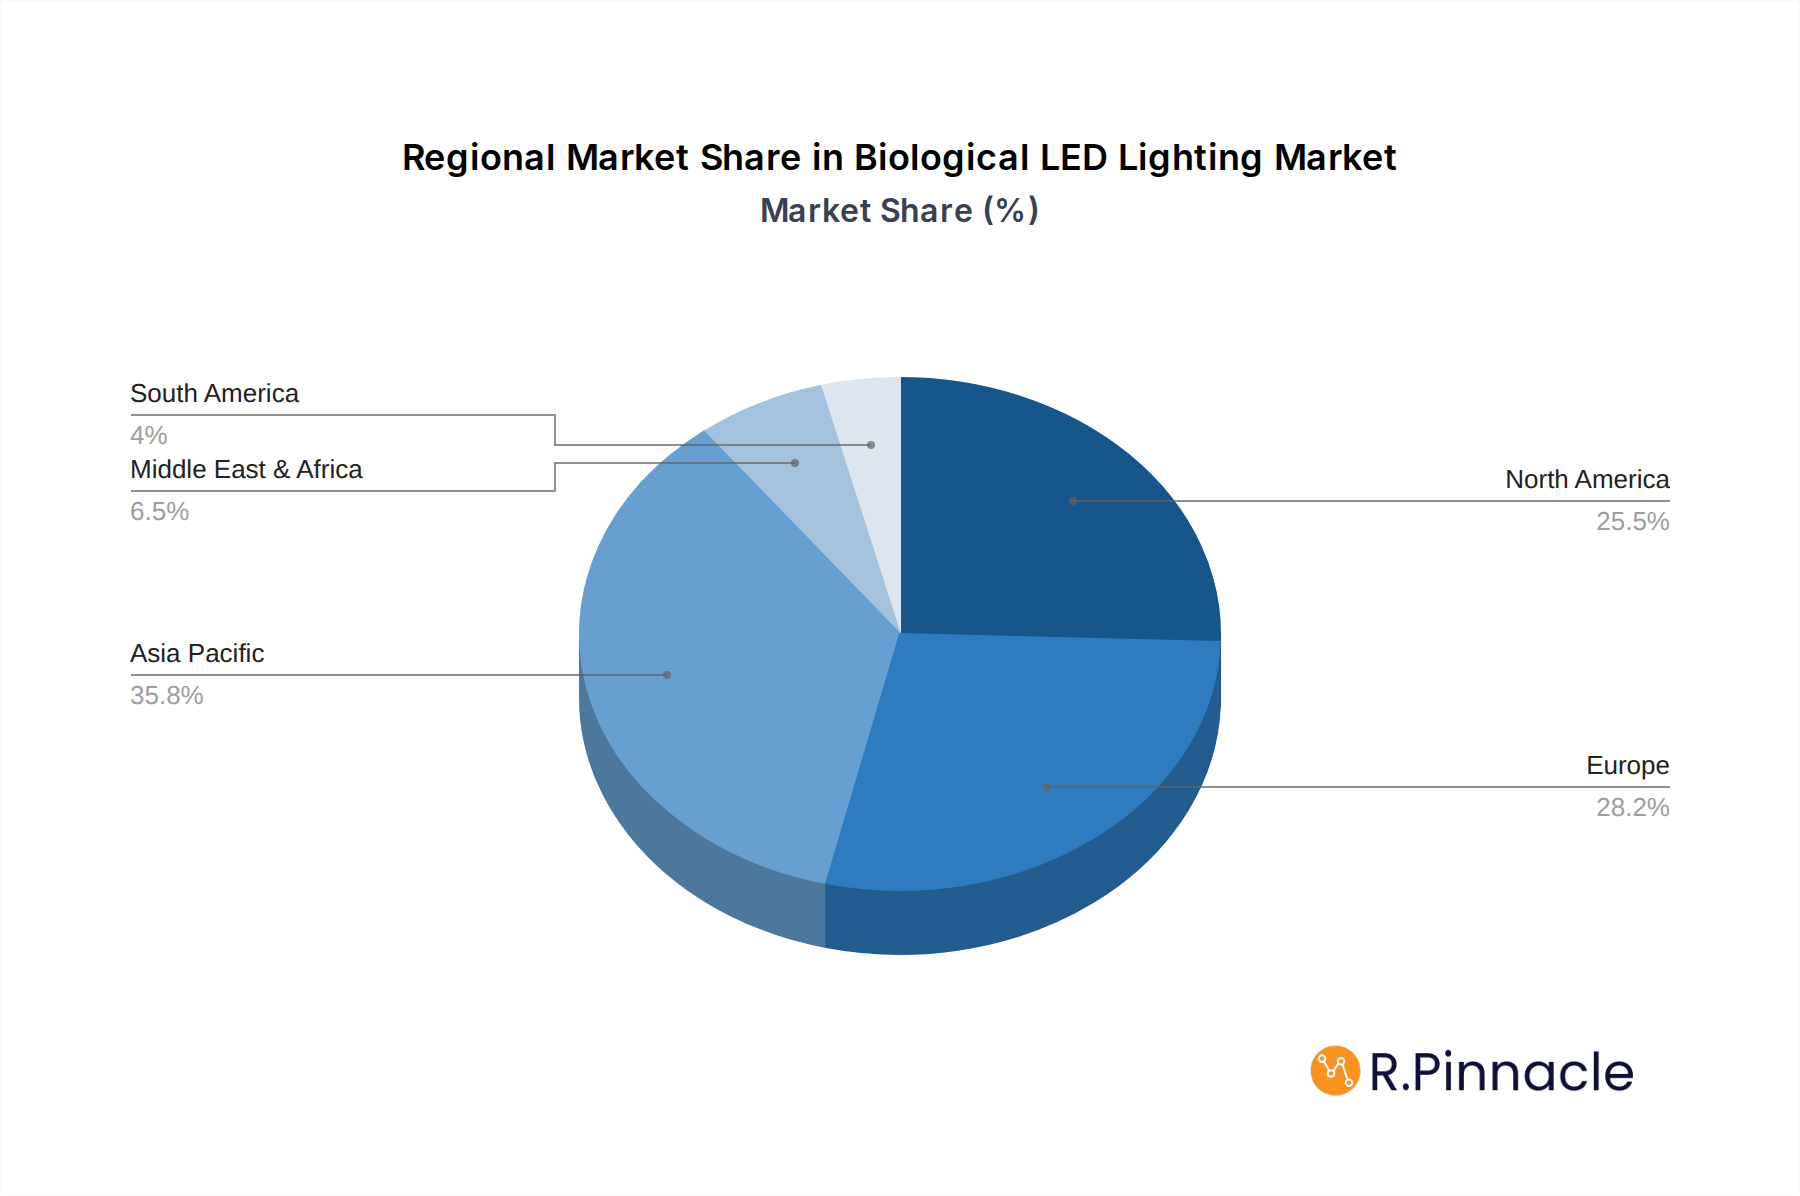
Biological LED Lighting Regional Market Share
Geographic Coverage of Biological LED Lighting
Biological LED Lighting REPORT HIGHLIGHTS
| Aspects | Details |
|---|---|
| Study Period | 2020-2034 |
| Base Year | 2025 |
| Estimated Year | 2026 |
| Forecast Period | 2026-2034 |
| Historical Period | 2020-2025 |
| Growth Rate | CAGR of 7.8% from 2020-2034 |
| Segmentation |
|
Table of Contents
- 1. Introduction
- 1.1. Research Scope
- 1.2. Market Segmentation
- 1.3. Research Methodology
- 1.4. Definitions and Assumptions
- 2. Executive Summary
- 2.1. Introduction
- 3. Market Dynamics
- 3.1. Introduction
- 3.2. Market Drivers
- 3.3. Market Restrains
- 3.4. Market Trends
- 4. Market Factor Analysis
- 4.1. Porters Five Forces
- 4.2. Supply/Value Chain
- 4.3. PESTEL analysis
- 4.4. Market Entropy
- 4.5. Patent/Trademark Analysis
- 5. Global Biological LED Lighting Analysis, Insights and Forecast, 2020-2032
- 5.1. Market Analysis, Insights and Forecast - by Application
- 5.1.1. Plant Lighting
- 5.1.2. Livestock Lighting
- 5.1.3. Aquatic Lighting
- 5.2. Market Analysis, Insights and Forecast - by Types
- 5.2.1. Below 100W
- 5.2.2. 100W-300W
- 5.2.3. Above 300W
- 5.3. Market Analysis, Insights and Forecast - by Region
- 5.3.1. North America
- 5.3.2. South America
- 5.3.3. Europe
- 5.3.4. Middle East & Africa
- 5.3.5. Asia Pacific
- 5.1. Market Analysis, Insights and Forecast - by Application
- 6. North America Biological LED Lighting Analysis, Insights and Forecast, 2020-2032
- 6.1. Market Analysis, Insights and Forecast - by Application
- 6.1.1. Plant Lighting
- 6.1.2. Livestock Lighting
- 6.1.3. Aquatic Lighting
- 6.2. Market Analysis, Insights and Forecast - by Types
- 6.2.1. Below 100W
- 6.2.2. 100W-300W
- 6.2.3. Above 300W
- 6.1. Market Analysis, Insights and Forecast - by Application
- 7. South America Biological LED Lighting Analysis, Insights and Forecast, 2020-2032
- 7.1. Market Analysis, Insights and Forecast - by Application
- 7.1.1. Plant Lighting
- 7.1.2. Livestock Lighting
- 7.1.3. Aquatic Lighting
- 7.2. Market Analysis, Insights and Forecast - by Types
- 7.2.1. Below 100W
- 7.2.2. 100W-300W
- 7.2.3. Above 300W
- 7.1. Market Analysis, Insights and Forecast - by Application
- 8. Europe Biological LED Lighting Analysis, Insights and Forecast, 2020-2032
- 8.1. Market Analysis, Insights and Forecast - by Application
- 8.1.1. Plant Lighting
- 8.1.2. Livestock Lighting
- 8.1.3. Aquatic Lighting
- 8.2. Market Analysis, Insights and Forecast - by Types
- 8.2.1. Below 100W
- 8.2.2. 100W-300W
- 8.2.3. Above 300W
- 8.1. Market Analysis, Insights and Forecast - by Application
- 9. Middle East & Africa Biological LED Lighting Analysis, Insights and Forecast, 2020-2032
- 9.1. Market Analysis, Insights and Forecast - by Application
- 9.1.1. Plant Lighting
- 9.1.2. Livestock Lighting
- 9.1.3. Aquatic Lighting
- 9.2. Market Analysis, Insights and Forecast - by Types
- 9.2.1. Below 100W
- 9.2.2. 100W-300W
- 9.2.3. Above 300W
- 9.1. Market Analysis, Insights and Forecast - by Application
- 10. Asia Pacific Biological LED Lighting Analysis, Insights and Forecast, 2020-2032
- 10.1. Market Analysis, Insights and Forecast - by Application
- 10.1.1. Plant Lighting
- 10.1.2. Livestock Lighting
- 10.1.3. Aquatic Lighting
- 10.2. Market Analysis, Insights and Forecast - by Types
- 10.2.1. Below 100W
- 10.2.2. 100W-300W
- 10.2.3. Above 300W
- 10.1. Market Analysis, Insights and Forecast - by Application
- 11. Competitive Analysis
- 11.1. Global Market Share Analysis 2025
- 11.2. Company Profiles
- 11.2.1 General Electric
- 11.2.1.1. Overview
- 11.2.1.2. Products
- 11.2.1.3. SWOT Analysis
- 11.2.1.4. Recent Developments
- 11.2.1.5. Financials (Based on Availability)
- 11.2.2 Osram
- 11.2.2.1. Overview
- 11.2.2.2. Products
- 11.2.2.3. SWOT Analysis
- 11.2.2.4. Recent Developments
- 11.2.2.5. Financials (Based on Availability)
- 11.2.3 Everlight Electronics
- 11.2.3.1. Overview
- 11.2.3.2. Products
- 11.2.3.3. SWOT Analysis
- 11.2.3.4. Recent Developments
- 11.2.3.5. Financials (Based on Availability)
- 11.2.4 Gavita
- 11.2.4.1. Overview
- 11.2.4.2. Products
- 11.2.4.3. SWOT Analysis
- 11.2.4.4. Recent Developments
- 11.2.4.5. Financials (Based on Availability)
- 11.2.5 Hubbell Lighting
- 11.2.5.1. Overview
- 11.2.5.2. Products
- 11.2.5.3. SWOT Analysis
- 11.2.5.4. Recent Developments
- 11.2.5.5. Financials (Based on Availability)
- 11.2.6 Kessil
- 11.2.6.1. Overview
- 11.2.6.2. Products
- 11.2.6.3. SWOT Analysis
- 11.2.6.4. Recent Developments
- 11.2.6.5. Financials (Based on Availability)
- 11.2.7 Cree
- 11.2.7.1. Overview
- 11.2.7.2. Products
- 11.2.7.3. SWOT Analysis
- 11.2.7.4. Recent Developments
- 11.2.7.5. Financials (Based on Availability)
- 11.2.8 Illumitex
- 11.2.8.1. Overview
- 11.2.8.2. Products
- 11.2.8.3. SWOT Analysis
- 11.2.8.4. Recent Developments
- 11.2.8.5. Financials (Based on Availability)
- 11.2.9 Ohmax Optoelectronic
- 11.2.9.1. Overview
- 11.2.9.2. Products
- 11.2.9.3. SWOT Analysis
- 11.2.9.4. Recent Developments
- 11.2.9.5. Financials (Based on Availability)
- 11.2.10 CBM Lighting
- 11.2.10.1. Overview
- 11.2.10.2. Products
- 11.2.10.3. SWOT Analysis
- 11.2.10.4. Recent Developments
- 11.2.10.5. Financials (Based on Availability)
- 11.2.11 Aruna Lighting Holding B.V.
- 11.2.11.1. Overview
- 11.2.11.2. Products
- 11.2.11.3. SWOT Analysis
- 11.2.11.4. Recent Developments
- 11.2.11.5. Financials (Based on Availability)
- 11.2.12 HATO Agricultural Lighting
- 11.2.12.1. Overview
- 11.2.12.2. Products
- 11.2.12.3. SWOT Analysis
- 11.2.12.4. Recent Developments
- 11.2.12.5. Financials (Based on Availability)
- 11.2.13 Sunbird Lighting Pty Ltd
- 11.2.13.1. Overview
- 11.2.13.2. Products
- 11.2.13.3. SWOT Analysis
- 11.2.13.4. Recent Developments
- 11.2.13.5. Financials (Based on Availability)
- 11.2.14 Greengage Agritech Ltd
- 11.2.14.1. Overview
- 11.2.14.2. Products
- 11.2.14.3. SWOT Analysis
- 11.2.14.4. Recent Developments
- 11.2.14.5. Financials (Based on Availability)
- 11.2.1 General Electric
List of Figures
- Figure 1: Global Biological LED Lighting Revenue Breakdown (billion, %) by Region 2025 & 2033
- Figure 2: Global Biological LED Lighting Volume Breakdown (K, %) by Region 2025 & 2033
- Figure 3: North America Biological LED Lighting Revenue (billion), by Application 2025 & 2033
- Figure 4: North America Biological LED Lighting Volume (K), by Application 2025 & 2033
- Figure 5: North America Biological LED Lighting Revenue Share (%), by Application 2025 & 2033
- Figure 6: North America Biological LED Lighting Volume Share (%), by Application 2025 & 2033
- Figure 7: North America Biological LED Lighting Revenue (billion), by Types 2025 & 2033
- Figure 8: North America Biological LED Lighting Volume (K), by Types 2025 & 2033
- Figure 9: North America Biological LED Lighting Revenue Share (%), by Types 2025 & 2033
- Figure 10: North America Biological LED Lighting Volume Share (%), by Types 2025 & 2033
- Figure 11: North America Biological LED Lighting Revenue (billion), by Country 2025 & 2033
- Figure 12: North America Biological LED Lighting Volume (K), by Country 2025 & 2033
- Figure 13: North America Biological LED Lighting Revenue Share (%), by Country 2025 & 2033
- Figure 14: North America Biological LED Lighting Volume Share (%), by Country 2025 & 2033
- Figure 15: South America Biological LED Lighting Revenue (billion), by Application 2025 & 2033
- Figure 16: South America Biological LED Lighting Volume (K), by Application 2025 & 2033
- Figure 17: South America Biological LED Lighting Revenue Share (%), by Application 2025 & 2033
- Figure 18: South America Biological LED Lighting Volume Share (%), by Application 2025 & 2033
- Figure 19: South America Biological LED Lighting Revenue (billion), by Types 2025 & 2033
- Figure 20: South America Biological LED Lighting Volume (K), by Types 2025 & 2033
- Figure 21: South America Biological LED Lighting Revenue Share (%), by Types 2025 & 2033
- Figure 22: South America Biological LED Lighting Volume Share (%), by Types 2025 & 2033
- Figure 23: South America Biological LED Lighting Revenue (billion), by Country 2025 & 2033
- Figure 24: South America Biological LED Lighting Volume (K), by Country 2025 & 2033
- Figure 25: South America Biological LED Lighting Revenue Share (%), by Country 2025 & 2033
- Figure 26: South America Biological LED Lighting Volume Share (%), by Country 2025 & 2033
- Figure 27: Europe Biological LED Lighting Revenue (billion), by Application 2025 & 2033
- Figure 28: Europe Biological LED Lighting Volume (K), by Application 2025 & 2033
- Figure 29: Europe Biological LED Lighting Revenue Share (%), by Application 2025 & 2033
- Figure 30: Europe Biological LED Lighting Volume Share (%), by Application 2025 & 2033
- Figure 31: Europe Biological LED Lighting Revenue (billion), by Types 2025 & 2033
- Figure 32: Europe Biological LED Lighting Volume (K), by Types 2025 & 2033
- Figure 33: Europe Biological LED Lighting Revenue Share (%), by Types 2025 & 2033
- Figure 34: Europe Biological LED Lighting Volume Share (%), by Types 2025 & 2033
- Figure 35: Europe Biological LED Lighting Revenue (billion), by Country 2025 & 2033
- Figure 36: Europe Biological LED Lighting Volume (K), by Country 2025 & 2033
- Figure 37: Europe Biological LED Lighting Revenue Share (%), by Country 2025 & 2033
- Figure 38: Europe Biological LED Lighting Volume Share (%), by Country 2025 & 2033
- Figure 39: Middle East & Africa Biological LED Lighting Revenue (billion), by Application 2025 & 2033
- Figure 40: Middle East & Africa Biological LED Lighting Volume (K), by Application 2025 & 2033
- Figure 41: Middle East & Africa Biological LED Lighting Revenue Share (%), by Application 2025 & 2033
- Figure 42: Middle East & Africa Biological LED Lighting Volume Share (%), by Application 2025 & 2033
- Figure 43: Middle East & Africa Biological LED Lighting Revenue (billion), by Types 2025 & 2033
- Figure 44: Middle East & Africa Biological LED Lighting Volume (K), by Types 2025 & 2033
- Figure 45: Middle East & Africa Biological LED Lighting Revenue Share (%), by Types 2025 & 2033
- Figure 46: Middle East & Africa Biological LED Lighting Volume Share (%), by Types 2025 & 2033
- Figure 47: Middle East & Africa Biological LED Lighting Revenue (billion), by Country 2025 & 2033
- Figure 48: Middle East & Africa Biological LED Lighting Volume (K), by Country 2025 & 2033
- Figure 49: Middle East & Africa Biological LED Lighting Revenue Share (%), by Country 2025 & 2033
- Figure 50: Middle East & Africa Biological LED Lighting Volume Share (%), by Country 2025 & 2033
- Figure 51: Asia Pacific Biological LED Lighting Revenue (billion), by Application 2025 & 2033
- Figure 52: Asia Pacific Biological LED Lighting Volume (K), by Application 2025 & 2033
- Figure 53: Asia Pacific Biological LED Lighting Revenue Share (%), by Application 2025 & 2033
- Figure 54: Asia Pacific Biological LED Lighting Volume Share (%), by Application 2025 & 2033
- Figure 55: Asia Pacific Biological LED Lighting Revenue (billion), by Types 2025 & 2033
- Figure 56: Asia Pacific Biological LED Lighting Volume (K), by Types 2025 & 2033
- Figure 57: Asia Pacific Biological LED Lighting Revenue Share (%), by Types 2025 & 2033
- Figure 58: Asia Pacific Biological LED Lighting Volume Share (%), by Types 2025 & 2033
- Figure 59: Asia Pacific Biological LED Lighting Revenue (billion), by Country 2025 & 2033
- Figure 60: Asia Pacific Biological LED Lighting Volume (K), by Country 2025 & 2033
- Figure 61: Asia Pacific Biological LED Lighting Revenue Share (%), by Country 2025 & 2033
- Figure 62: Asia Pacific Biological LED Lighting Volume Share (%), by Country 2025 & 2033
List of Tables
- Table 1: Global Biological LED Lighting Revenue billion Forecast, by Application 2020 & 2033
- Table 2: Global Biological LED Lighting Volume K Forecast, by Application 2020 & 2033
- Table 3: Global Biological LED Lighting Revenue billion Forecast, by Types 2020 & 2033
- Table 4: Global Biological LED Lighting Volume K Forecast, by Types 2020 & 2033
- Table 5: Global Biological LED Lighting Revenue billion Forecast, by Region 2020 & 2033
- Table 6: Global Biological LED Lighting Volume K Forecast, by Region 2020 & 2033
- Table 7: Global Biological LED Lighting Revenue billion Forecast, by Application 2020 & 2033
- Table 8: Global Biological LED Lighting Volume K Forecast, by Application 2020 & 2033
- Table 9: Global Biological LED Lighting Revenue billion Forecast, by Types 2020 & 2033
- Table 10: Global Biological LED Lighting Volume K Forecast, by Types 2020 & 2033
- Table 11: Global Biological LED Lighting Revenue billion Forecast, by Country 2020 & 2033
- Table 12: Global Biological LED Lighting Volume K Forecast, by Country 2020 & 2033
- Table 13: United States Biological LED Lighting Revenue (billion) Forecast, by Application 2020 & 2033
- Table 14: United States Biological LED Lighting Volume (K) Forecast, by Application 2020 & 2033
- Table 15: Canada Biological LED Lighting Revenue (billion) Forecast, by Application 2020 & 2033
- Table 16: Canada Biological LED Lighting Volume (K) Forecast, by Application 2020 & 2033
- Table 17: Mexico Biological LED Lighting Revenue (billion) Forecast, by Application 2020 & 2033
- Table 18: Mexico Biological LED Lighting Volume (K) Forecast, by Application 2020 & 2033
- Table 19: Global Biological LED Lighting Revenue billion Forecast, by Application 2020 & 2033
- Table 20: Global Biological LED Lighting Volume K Forecast, by Application 2020 & 2033
- Table 21: Global Biological LED Lighting Revenue billion Forecast, by Types 2020 & 2033
- Table 22: Global Biological LED Lighting Volume K Forecast, by Types 2020 & 2033
- Table 23: Global Biological LED Lighting Revenue billion Forecast, by Country 2020 & 2033
- Table 24: Global Biological LED Lighting Volume K Forecast, by Country 2020 & 2033
- Table 25: Brazil Biological LED Lighting Revenue (billion) Forecast, by Application 2020 & 2033
- Table 26: Brazil Biological LED Lighting Volume (K) Forecast, by Application 2020 & 2033
- Table 27: Argentina Biological LED Lighting Revenue (billion) Forecast, by Application 2020 & 2033
- Table 28: Argentina Biological LED Lighting Volume (K) Forecast, by Application 2020 & 2033
- Table 29: Rest of South America Biological LED Lighting Revenue (billion) Forecast, by Application 2020 & 2033
- Table 30: Rest of South America Biological LED Lighting Volume (K) Forecast, by Application 2020 & 2033
- Table 31: Global Biological LED Lighting Revenue billion Forecast, by Application 2020 & 2033
- Table 32: Global Biological LED Lighting Volume K Forecast, by Application 2020 & 2033
- Table 33: Global Biological LED Lighting Revenue billion Forecast, by Types 2020 & 2033
- Table 34: Global Biological LED Lighting Volume K Forecast, by Types 2020 & 2033
- Table 35: Global Biological LED Lighting Revenue billion Forecast, by Country 2020 & 2033
- Table 36: Global Biological LED Lighting Volume K Forecast, by Country 2020 & 2033
- Table 37: United Kingdom Biological LED Lighting Revenue (billion) Forecast, by Application 2020 & 2033
- Table 38: United Kingdom Biological LED Lighting Volume (K) Forecast, by Application 2020 & 2033
- Table 39: Germany Biological LED Lighting Revenue (billion) Forecast, by Application 2020 & 2033
- Table 40: Germany Biological LED Lighting Volume (K) Forecast, by Application 2020 & 2033
- Table 41: France Biological LED Lighting Revenue (billion) Forecast, by Application 2020 & 2033
- Table 42: France Biological LED Lighting Volume (K) Forecast, by Application 2020 & 2033
- Table 43: Italy Biological LED Lighting Revenue (billion) Forecast, by Application 2020 & 2033
- Table 44: Italy Biological LED Lighting Volume (K) Forecast, by Application 2020 & 2033
- Table 45: Spain Biological LED Lighting Revenue (billion) Forecast, by Application 2020 & 2033
- Table 46: Spain Biological LED Lighting Volume (K) Forecast, by Application 2020 & 2033
- Table 47: Russia Biological LED Lighting Revenue (billion) Forecast, by Application 2020 & 2033
- Table 48: Russia Biological LED Lighting Volume (K) Forecast, by Application 2020 & 2033
- Table 49: Benelux Biological LED Lighting Revenue (billion) Forecast, by Application 2020 & 2033
- Table 50: Benelux Biological LED Lighting Volume (K) Forecast, by Application 2020 & 2033
- Table 51: Nordics Biological LED Lighting Revenue (billion) Forecast, by Application 2020 & 2033
- Table 52: Nordics Biological LED Lighting Volume (K) Forecast, by Application 2020 & 2033
- Table 53: Rest of Europe Biological LED Lighting Revenue (billion) Forecast, by Application 2020 & 2033
- Table 54: Rest of Europe Biological LED Lighting Volume (K) Forecast, by Application 2020 & 2033
- Table 55: Global Biological LED Lighting Revenue billion Forecast, by Application 2020 & 2033
- Table 56: Global Biological LED Lighting Volume K Forecast, by Application 2020 & 2033
- Table 57: Global Biological LED Lighting Revenue billion Forecast, by Types 2020 & 2033
- Table 58: Global Biological LED Lighting Volume K Forecast, by Types 2020 & 2033
- Table 59: Global Biological LED Lighting Revenue billion Forecast, by Country 2020 & 2033
- Table 60: Global Biological LED Lighting Volume K Forecast, by Country 2020 & 2033
- Table 61: Turkey Biological LED Lighting Revenue (billion) Forecast, by Application 2020 & 2033
- Table 62: Turkey Biological LED Lighting Volume (K) Forecast, by Application 2020 & 2033
- Table 63: Israel Biological LED Lighting Revenue (billion) Forecast, by Application 2020 & 2033
- Table 64: Israel Biological LED Lighting Volume (K) Forecast, by Application 2020 & 2033
- Table 65: GCC Biological LED Lighting Revenue (billion) Forecast, by Application 2020 & 2033
- Table 66: GCC Biological LED Lighting Volume (K) Forecast, by Application 2020 & 2033
- Table 67: North Africa Biological LED Lighting Revenue (billion) Forecast, by Application 2020 & 2033
- Table 68: North Africa Biological LED Lighting Volume (K) Forecast, by Application 2020 & 2033
- Table 69: South Africa Biological LED Lighting Revenue (billion) Forecast, by Application 2020 & 2033
- Table 70: South Africa Biological LED Lighting Volume (K) Forecast, by Application 2020 & 2033
- Table 71: Rest of Middle East & Africa Biological LED Lighting Revenue (billion) Forecast, by Application 2020 & 2033
- Table 72: Rest of Middle East & Africa Biological LED Lighting Volume (K) Forecast, by Application 2020 & 2033
- Table 73: Global Biological LED Lighting Revenue billion Forecast, by Application 2020 & 2033
- Table 74: Global Biological LED Lighting Volume K Forecast, by Application 2020 & 2033
- Table 75: Global Biological LED Lighting Revenue billion Forecast, by Types 2020 & 2033
- Table 76: Global Biological LED Lighting Volume K Forecast, by Types 2020 & 2033
- Table 77: Global Biological LED Lighting Revenue billion Forecast, by Country 2020 & 2033
- Table 78: Global Biological LED Lighting Volume K Forecast, by Country 2020 & 2033
- Table 79: China Biological LED Lighting Revenue (billion) Forecast, by Application 2020 & 2033
- Table 80: China Biological LED Lighting Volume (K) Forecast, by Application 2020 & 2033
- Table 81: India Biological LED Lighting Revenue (billion) Forecast, by Application 2020 & 2033
- Table 82: India Biological LED Lighting Volume (K) Forecast, by Application 2020 & 2033
- Table 83: Japan Biological LED Lighting Revenue (billion) Forecast, by Application 2020 & 2033
- Table 84: Japan Biological LED Lighting Volume (K) Forecast, by Application 2020 & 2033
- Table 85: South Korea Biological LED Lighting Revenue (billion) Forecast, by Application 2020 & 2033
- Table 86: South Korea Biological LED Lighting Volume (K) Forecast, by Application 2020 & 2033
- Table 87: ASEAN Biological LED Lighting Revenue (billion) Forecast, by Application 2020 & 2033
- Table 88: ASEAN Biological LED Lighting Volume (K) Forecast, by Application 2020 & 2033
- Table 89: Oceania Biological LED Lighting Revenue (billion) Forecast, by Application 2020 & 2033
- Table 90: Oceania Biological LED Lighting Volume (K) Forecast, by Application 2020 & 2033
- Table 91: Rest of Asia Pacific Biological LED Lighting Revenue (billion) Forecast, by Application 2020 & 2033
- Table 92: Rest of Asia Pacific Biological LED Lighting Volume (K) Forecast, by Application 2020 & 2033
Frequently Asked Questions
1. What is the projected Compound Annual Growth Rate (CAGR) of the Biological LED Lighting?
The projected CAGR is approximately 7.8%.
2. Which companies are prominent players in the Biological LED Lighting?
Key companies in the market include General Electric, Osram, Everlight Electronics, Gavita, Hubbell Lighting, Kessil, Cree, Illumitex, Ohmax Optoelectronic, CBM Lighting, Aruna Lighting Holding B.V., HATO Agricultural Lighting, Sunbird Lighting Pty Ltd, Greengage Agritech Ltd.
3. What are the main segments of the Biological LED Lighting?
The market segments include Application, Types.
4. Can you provide details about the market size?
The market size is estimated to be USD 88.17 billion as of 2022.
5. What are some drivers contributing to market growth?
N/A
6. What are the notable trends driving market growth?
N/A
7. Are there any restraints impacting market growth?
N/A
8. Can you provide examples of recent developments in the market?
N/A
9. What pricing options are available for accessing the report?
Pricing options include single-user, multi-user, and enterprise licenses priced at USD 3350.00, USD 5025.00, and USD 6700.00 respectively.
10. Is the market size provided in terms of value or volume?
The market size is provided in terms of value, measured in billion and volume, measured in K.
11. Are there any specific market keywords associated with the report?
Yes, the market keyword associated with the report is "Biological LED Lighting," which aids in identifying and referencing the specific market segment covered.
12. How do I determine which pricing option suits my needs best?
The pricing options vary based on user requirements and access needs. Individual users may opt for single-user licenses, while businesses requiring broader access may choose multi-user or enterprise licenses for cost-effective access to the report.
13. Are there any additional resources or data provided in the Biological LED Lighting report?
While the report offers comprehensive insights, it's advisable to review the specific contents or supplementary materials provided to ascertain if additional resources or data are available.
14. How can I stay updated on further developments or reports in the Biological LED Lighting?
To stay informed about further developments, trends, and reports in the Biological LED Lighting, consider subscribing to industry newsletters, following relevant companies and organizations, or regularly checking reputable industry news sources and publications.
Methodology
Step 1 - Identification of Relevant Samples Size from Population Database


Step 2 - Approaches for Defining Global Market Size (Value, Volume* & Price*)

Note*: In applicable scenarios
Step 3 - Data Sources
Primary Research
- Web Analytics
- Survey Reports
- Research Institute
- Latest Research Reports
- Opinion Leaders
Secondary Research
- Annual Reports
- White Paper
- Latest Press Release
- Industry Association
- Paid Database
- Investor Presentations

Step 4 - Data Triangulation
Involves using different sources of information in order to increase the validity of a study
These sources are likely to be stakeholders in a program - participants, other researchers, program staff, other community members, and so on.
Then we put all data in single framework & apply various statistical tools to find out the dynamic on the market.
During the analysis stage, feedback from the stakeholder groups would be compared to determine areas of agreement as well as areas of divergence