

Key Insights
The global bottled water market is poised for robust expansion, projected to reach an estimated USD 353.61 billion in 2025. This significant market size underscores the increasing consumer preference for convenient and safe hydration solutions. The market is expected to experience a healthy CAGR of 5.3% during the forecast period, indicating sustained growth driven by a confluence of factors. Rising disposable incomes, coupled with growing health and wellness consciousness among consumers worldwide, are primary catalysts. As urbanization accelerates, the demand for readily available and packaged drinking water is intensifying, especially in emerging economies. Furthermore, the perceived purity and health benefits associated with bottled water, particularly functional and flavored variants, are attracting a broader consumer base, contributing to market penetration across diverse demographics and socioeconomic strata.
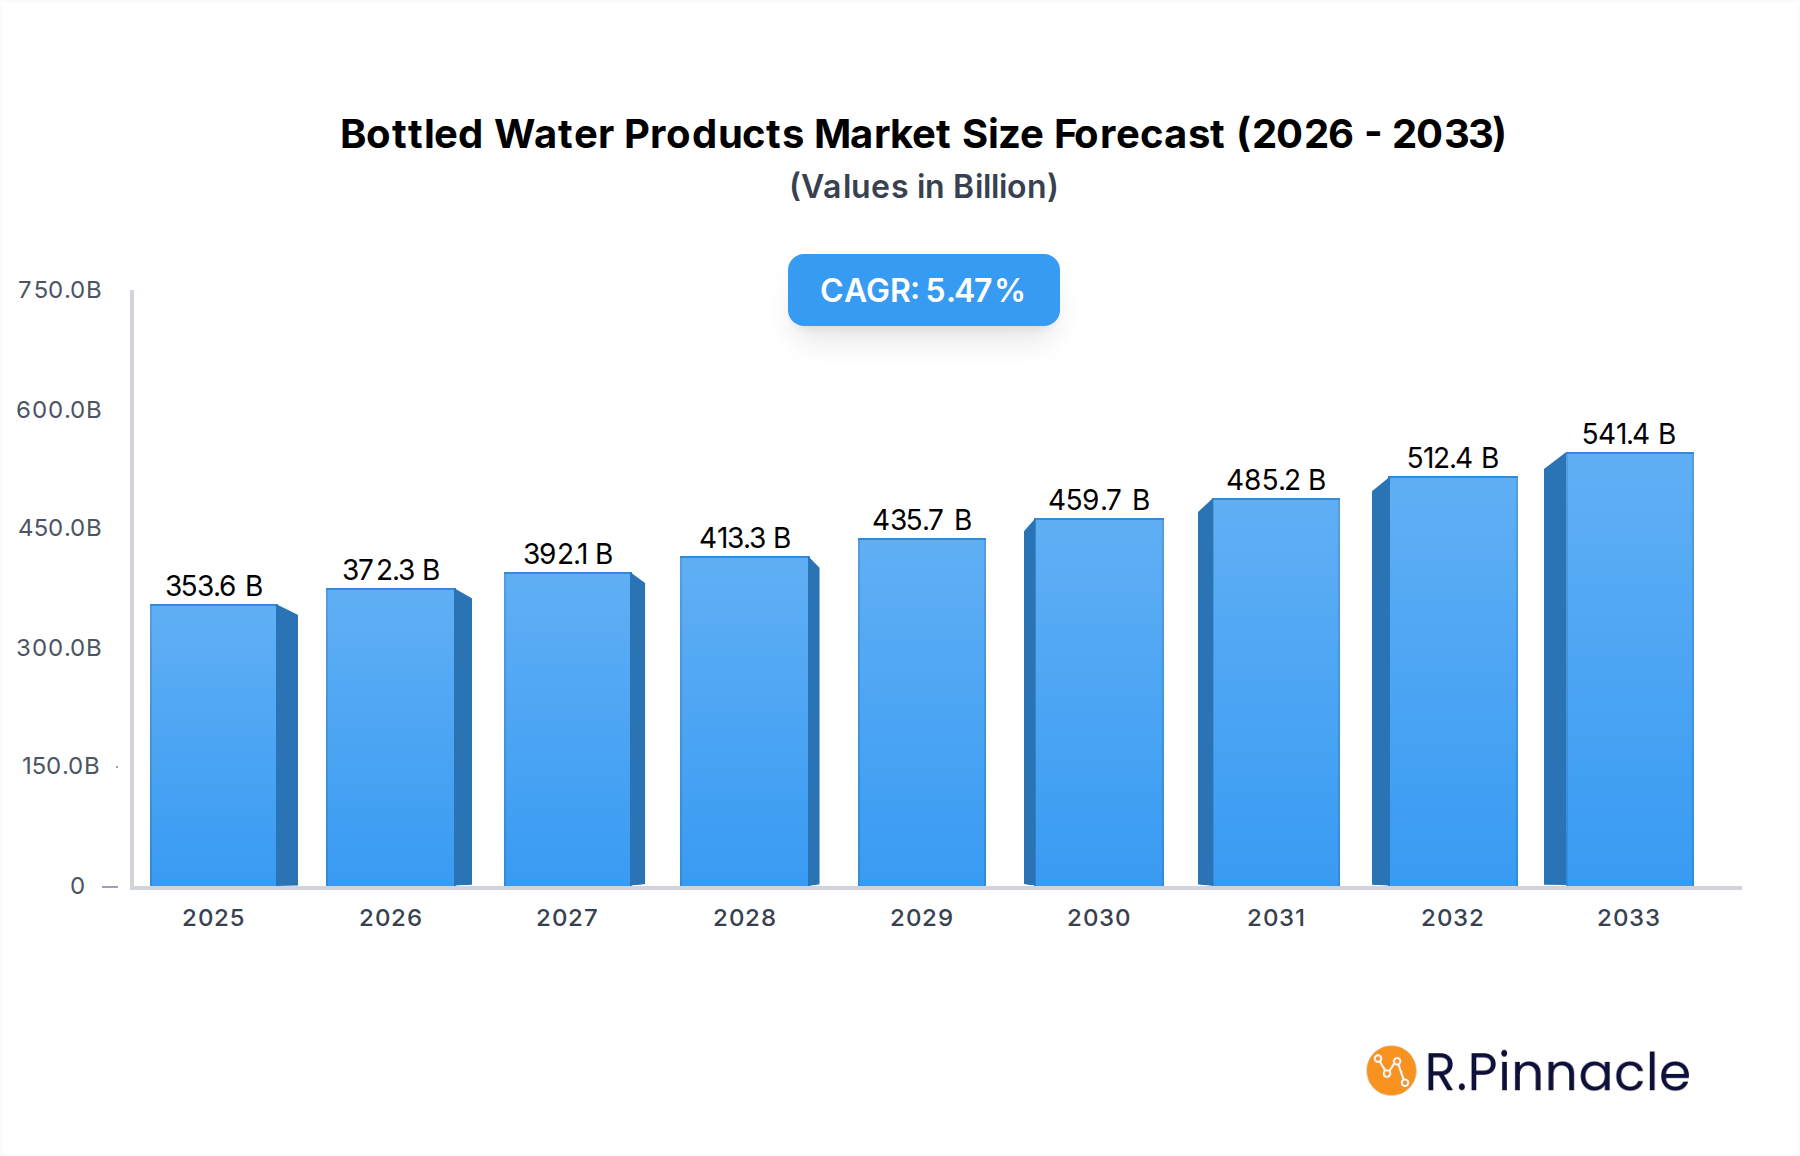
Bottled Water Products Market Size (In Billion)
The bottled water industry's growth trajectory is shaped by evolving consumer preferences and technological advancements. The increasing availability and popularity of online retail platforms are significantly impacting distribution channels, making bottled water more accessible than ever. Innovations in packaging, such as the development of sustainable and eco-friendly materials, are also gaining traction, aligning with a global push towards environmental responsibility. While the market exhibits strong growth, it faces certain restraints, including increasing concerns over plastic waste and the availability of cheaper tap water alternatives in developed regions. However, the strategic focus on product differentiation through functional enhancements, novel flavors, and premium branding by key players like PepsiCo, Danone, and Nestle is expected to mitigate these challenges and sustain the market's upward momentum. The market is segmented into various applications, including hypermarkets & supermarkets, convenience stores, grocery stores, online retailers, and others, catering to a wide spectrum of consumer purchasing habits.

Bottled Water Products Company Market Share
Unleash Market Dominance: The Bottled Water Products Industry Report
This comprehensive report provides an in-depth analysis of the global Bottled Water Products market, spanning from 2019 to 2033, with a base year of 2025 and an estimated year also of 2025. Covering a crucial forecast period of 2025–2033 and a detailed historical period of 2019–2024, this study is essential for industry professionals seeking to navigate evolving consumer demands, technological advancements, and strategic growth opportunities. Discover actionable insights into market structure, dynamics, regional leadership, product innovations, and competitive landscapes, empowering your business to thrive in this multi-billion dollar industry.
Bottled Water Products Market Structure & Innovation Trends
The global bottled water market exhibits a moderately concentrated structure, driven by innovation in product formulation and sustainable packaging solutions. Key players like PepsiCo, Danone, Nestle, Coca-Cola, Bisleri International, Suntory Water Group, Master Kong, Nongfu Spring, Wahaha, Ganten, Cestbon, Kunlun Mountain, Al Ain Water, and NEVIOT hold significant market share, influencing pricing and distribution strategies. Innovation is largely propelled by increasing consumer demand for healthier beverage options and the growing awareness of hydration. Regulatory frameworks, while generally supportive of product safety and labeling, can present varying hurdles across different regions, impacting market entry and expansion. Product substitutes, such as tap water filtration systems and other ready-to-drink beverages, exert continuous pressure, necessitating differentiation through unique product offerings and branding. End-user demographics are increasingly diverse, with a strong focus on health-conscious millennials and Gen Z, as well as an aging population seeking convenient hydration solutions. Mergers and acquisitions (M&A) activities, valued in the billions, are strategic moves to consolidate market position, acquire innovative technologies, or expand geographical reach. For instance, recent M&A deals have centered around companies with strong capabilities in functional beverages and sustainable packaging, demonstrating a clear trend towards value-added products. The market is experiencing an upward trend in M&A, with an estimated deal value of $XX billion in the historical period, projected to reach $XX billion by 2033.
Bottled Water Products Market Dynamics & Trends
The bottled water products market is poised for substantial growth, projected to expand at a Compound Annual Growth Rate (CAGR) of approximately XX% during the forecast period. This robust expansion is fueled by a confluence of potent market growth drivers, including rising global disposable incomes, increasing urbanization, and a pervasive shift towards healthier lifestyle choices. Consumers are actively seeking alternatives to sugary drinks, positioning bottled water as a preferred hydration solution. Technological disruptions are playing a pivotal role, with advancements in filtration technologies, innovative packaging materials (such as lightweight plastics and biodegradable options), and smart bottling solutions enhancing product appeal and sustainability. The market penetration of bottled water is steadily increasing across both developed and emerging economies, driven by improved accessibility and sophisticated marketing campaigns that highlight the perceived purity and health benefits of various water types. Consumer preferences are evolving rapidly, with a growing demand for specialized water categories, including flavored, functional, and mineral-rich variants. This trend is compelling manufacturers to diversify their product portfolios and invest in research and development to cater to niche markets. Competitive dynamics are characterized by intense rivalry among established global giants and agile regional players, all vying for market share through product differentiation, aggressive pricing, and extensive distribution networks. The online retail segment, in particular, is witnessing remarkable growth, transforming traditional purchasing habits and opening new avenues for market reach. The overall market size is estimated to exceed $XXX billion in the base year, driven by these dynamic forces.
Dominant Regions & Segments in Bottled Water Products
Asia Pacific is emerging as the dominant region in the global bottled water products market, driven by a burgeoning population, increasing disposable incomes, and a growing health consciousness. Countries like China and India are at the forefront of this growth, with significant market penetration across all key segments.
Application Dominance:
- Hypermarkets & Supermarkets: This channel continues to be a primary driver of sales, offering a wide variety of brands and types of bottled water to a broad consumer base. Factors contributing to this dominance include strategic product placement, promotional activities, and the convenience of one-stop shopping. The economic policies supporting retail expansion and infrastructure development further bolster this segment.
- Online Retailers: Experiencing exponential growth, online retailers are revolutionizing bottled water accessibility. This surge is attributed to the ease of home delivery, competitive pricing, and the ability for consumers to compare products effortlessly. Technological advancements in e-commerce platforms and logistics networks are key enablers. The projected market share for this segment is expected to reach $XX billion by 2033.
- Convenience Stores and Grocery Stores: These segments cater to immediate consumption needs and impulse purchases, playing a crucial role in urban areas. Their accessibility and localized presence contribute to consistent sales.
Type Dominance:
- Still Bottle Water: This segment holds the largest market share due to its broad appeal and versatility. Its dominance is underpinned by its perceived health benefits and its use in everyday hydration.
- Functional Bottle Water: Witnessing significant growth, functional bottled water, enriched with vitamins, minerals, or other health-promoting ingredients, is increasingly capturing consumer attention. This rise is driven by a proactive approach to health and wellness, with consumers seeking added benefits beyond basic hydration. The CAGR for this segment is projected at XX%.
- Carbonated Bottle Water: While established, this segment's growth is influenced by evolving taste preferences and a growing demand for healthier alternatives to sodas.
- Flavored Bottle Water: This segment is gaining traction, particularly among younger demographics, offering a healthier and more appealing alternative to sugary beverages.
The dominance in Asia Pacific is further solidified by government initiatives promoting healthy living and the presence of major domestic players like Master Kong, Nongfu Spring, Wahaha, Ganten, Cestbon, and Kunlun Mountain, alongside international giants.
Bottled Water Products Product Innovations
Product innovations in the bottled water sector are increasingly focused on enhancing health benefits and sustainability. The development of functional bottled water, fortified with electrolytes, vitamins, and natural extracts, is a significant trend, catering to the wellness-conscious consumer. Innovations in packaging, including biodegradable materials, recycled plastics, and lightweight designs, are addressing environmental concerns and enhancing brand appeal. Companies are also exploring unique flavor profiles and mineral compositions to differentiate their offerings. These advancements allow for a competitive advantage by tapping into niche markets and meeting evolving consumer demands for healthier and more environmentally friendly hydration choices.
Report Scope & Segmentation Analysis
This report comprehensively segments the bottled water products market across key dimensions to provide granular insights. The Application segmentation includes Hypermarkets & Supermarkets, Convenience Stores, Grocery Stores, Online Retailers, and Others. Growth in the Online Retailers segment is projected to be substantial, with an estimated market size of $XX billion by 2033, driven by e-commerce expansion. The Type segmentation encompasses Carbonated Bottle Water, Flavored Bottle Water, Still Bottle Water, Functional Bottle Water, and Others. Functional Bottle Water is expected to exhibit a robust CAGR of XX%, reflecting growing consumer interest in health-enhancing beverages. Competitive dynamics within each segment are influenced by brand loyalty, distribution reach, and product innovation.
Key Drivers of Bottled Water Products Growth
The bottled water products market is propelled by several key drivers. A primary driver is the escalating global health consciousness, leading consumers to opt for perceived healthier alternatives to sugary beverages. Increased disposable incomes in emerging economies are also a significant factor, enabling wider access to premium bottled water products. Technological advancements in water purification and filtration systems are enhancing product quality and consumer trust. Furthermore, a growing emphasis on hydration for physical and mental well-being further fuels demand. The convenience and portability of bottled water, particularly for on-the-go lifestyles, continue to be a strong influencing factor.
Challenges in the Bottled Water Products Sector
Despite its robust growth, the bottled water products sector faces several challenges. Environmental concerns surrounding plastic waste and sustainability are a significant restraint, prompting increased scrutiny and regulatory pressure for more eco-friendly packaging solutions. Intense market competition and price sensitivity among consumers can impact profit margins, particularly for smaller players. Fluctuations in raw material costs, such as PET resin prices, can also affect production expenses. Additionally, the availability of affordable and safe tap water in developed regions can act as a substitute, limiting market penetration in certain areas. Regulatory complexities related to water sourcing and quality standards across different regions can also pose challenges for global market players.
Emerging Opportunities in Bottled Water Products
Emerging opportunities within the bottled water products market are abundant and driven by evolving consumer trends and technological innovation. The demand for functional beverages, such as electrolyte-infused waters, probiotic waters, and those with added vitamins, presents a significant growth avenue. Sustainable packaging solutions, including plant-based plastics and reusable containers, are gaining traction and offer differentiation. Expansion into developing markets with rising middle classes and increasing awareness of hydration benefits represents a vast untapped potential. Furthermore, the growth of e-commerce and direct-to-consumer (DTC) models opens new channels for reaching a wider customer base and building stronger brand engagement. Innovations in water sources and unique mineral compositions also offer opportunities for premiumization.
Leading Players in the Bottled Water Products Market
- PepsiCo
- Danone
- Nestle
- Coca-Cola
- Bisleri International
- Suntory Water Group
- Gerolsteiner
- Ferrarelle
- Hildon
- Tynant
- Master Kong
- Nongfu Spring
- Wahaha
- Ganten
- Cestbon
- Kunlun Mountain
- Blue Sword
- Laoshan Water
- Al Ain Water
- NEVIOT
- Rayyan Mineral Water Co
Key Developments in Bottled Water Products Industry
- 2023/08: Nestle Waters launches new range of recycled PET bottles, aiming for XX% recycled content by 2025.
- 2023/05: Danone invests $XX million in innovative water purification technology to enhance product quality.
- 2022/11: Coca-Cola expands its functional bottled water portfolio with a new vitamin-infused line.
- 2022/07: Bisleri International announces strategic partnerships to expand its distribution network in rural India.
- 2021/09: PepsiCo introduces biodegradable packaging options for its bottled water brands.
- 2020/04: Suntory Water Group acquires a leading regional player in Southeast Asia to strengthen its market presence.
Future Outlook for Bottled Water Products Market
The future outlook for the bottled water products market is exceptionally bright, characterized by sustained growth driven by increasing health awareness and rising disposable incomes globally. The market is expected to witness further expansion of the functional and flavored water segments, catering to evolving consumer preferences for added benefits and diverse taste profiles. Innovations in sustainable packaging will continue to be a critical focus, shaping brand perception and regulatory compliance. The expansion of online retail channels will further enhance accessibility and market reach. Strategic mergers and acquisitions are anticipated to continue as companies seek to consolidate their positions and acquire innovative technologies. Overall, the market is poised for a future where convenience, health, and sustainability will be paramount for success, with an estimated market valuation exceeding $XXX billion by 2033.
Bottled Water Products Segmentation
-
1. Application
- 1.1. Hypermarkets & Supermarkets
- 1.2. Convenience Stores
- 1.3. Grocery Stores
- 1.4. Online Retailers
- 1.5. Others
-
2. Types
- 2.1. Carbonated Bottle Water
- 2.2. Flavored Bottle Water
- 2.3. Still Bottle Water
- 2.4. Functional Bottle Water
- 2.5. Others
Bottled Water Products Segmentation By Geography
-
1. North America
- 1.1. United States
- 1.2. Canada
- 1.3. Mexico
-
2. South America
- 2.1. Brazil
- 2.2. Argentina
- 2.3. Rest of South America
-
3. Europe
- 3.1. United Kingdom
- 3.2. Germany
- 3.3. France
- 3.4. Italy
- 3.5. Spain
- 3.6. Russia
- 3.7. Benelux
- 3.8. Nordics
- 3.9. Rest of Europe
-
4. Middle East & Africa
- 4.1. Turkey
- 4.2. Israel
- 4.3. GCC
- 4.4. North Africa
- 4.5. South Africa
- 4.6. Rest of Middle East & Africa
-
5. Asia Pacific
- 5.1. China
- 5.2. India
- 5.3. Japan
- 5.4. South Korea
- 5.5. ASEAN
- 5.6. Oceania
- 5.7. Rest of Asia Pacific
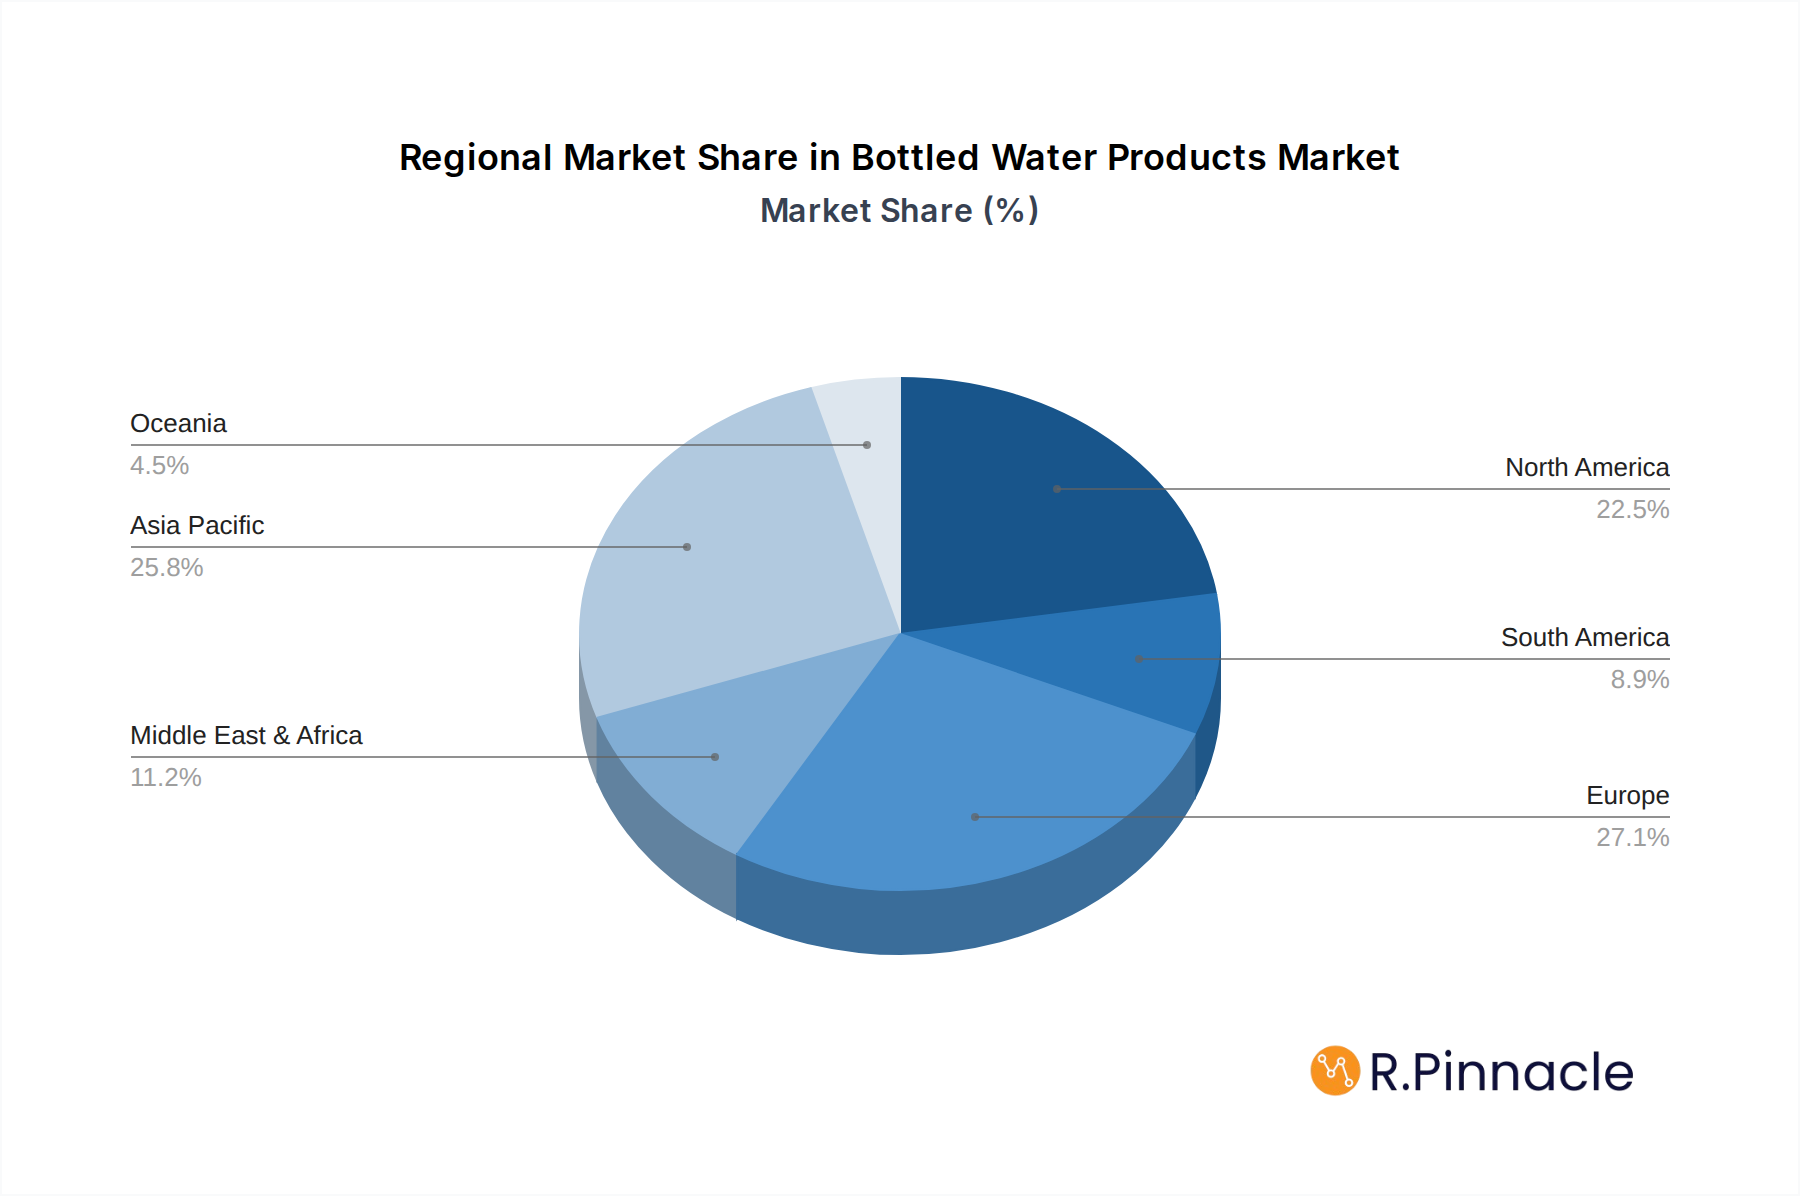
Bottled Water Products Regional Market Share
Geographic Coverage of Bottled Water Products
Bottled Water Products REPORT HIGHLIGHTS
| Aspects | Details |
|---|---|
| Study Period | 2020-2034 |
| Base Year | 2025 |
| Estimated Year | 2026 |
| Forecast Period | 2026-2034 |
| Historical Period | 2020-2025 |
| Growth Rate | CAGR of 6.8% from 2020-2034 |
| Segmentation |
|
Table of Contents
- 1. Introduction
- 1.1. Research Scope
- 1.2. Market Segmentation
- 1.3. Research Methodology
- 1.4. Definitions and Assumptions
- 2. Executive Summary
- 2.1. Introduction
- 3. Market Dynamics
- 3.1. Introduction
- 3.2. Market Drivers
- 3.3. Market Restrains
- 3.4. Market Trends
- 4. Market Factor Analysis
- 4.1. Porters Five Forces
- 4.2. Supply/Value Chain
- 4.3. PESTEL analysis
- 4.4. Market Entropy
- 4.5. Patent/Trademark Analysis
- 5. Global Bottled Water Products Analysis, Insights and Forecast, 2020-2032
- 5.1. Market Analysis, Insights and Forecast - by Application
- 5.1.1. Hypermarkets & Supermarkets
- 5.1.2. Convenience Stores
- 5.1.3. Grocery Stores
- 5.1.4. Online Retailers
- 5.1.5. Others
- 5.2. Market Analysis, Insights and Forecast - by Types
- 5.2.1. Carbonated Bottle Water
- 5.2.2. Flavored Bottle Water
- 5.2.3. Still Bottle Water
- 5.2.4. Functional Bottle Water
- 5.2.5. Others
- 5.3. Market Analysis, Insights and Forecast - by Region
- 5.3.1. North America
- 5.3.2. South America
- 5.3.3. Europe
- 5.3.4. Middle East & Africa
- 5.3.5. Asia Pacific
- 5.1. Market Analysis, Insights and Forecast - by Application
- 6. North America Bottled Water Products Analysis, Insights and Forecast, 2020-2032
- 6.1. Market Analysis, Insights and Forecast - by Application
- 6.1.1. Hypermarkets & Supermarkets
- 6.1.2. Convenience Stores
- 6.1.3. Grocery Stores
- 6.1.4. Online Retailers
- 6.1.5. Others
- 6.2. Market Analysis, Insights and Forecast - by Types
- 6.2.1. Carbonated Bottle Water
- 6.2.2. Flavored Bottle Water
- 6.2.3. Still Bottle Water
- 6.2.4. Functional Bottle Water
- 6.2.5. Others
- 6.1. Market Analysis, Insights and Forecast - by Application
- 7. South America Bottled Water Products Analysis, Insights and Forecast, 2020-2032
- 7.1. Market Analysis, Insights and Forecast - by Application
- 7.1.1. Hypermarkets & Supermarkets
- 7.1.2. Convenience Stores
- 7.1.3. Grocery Stores
- 7.1.4. Online Retailers
- 7.1.5. Others
- 7.2. Market Analysis, Insights and Forecast - by Types
- 7.2.1. Carbonated Bottle Water
- 7.2.2. Flavored Bottle Water
- 7.2.3. Still Bottle Water
- 7.2.4. Functional Bottle Water
- 7.2.5. Others
- 7.1. Market Analysis, Insights and Forecast - by Application
- 8. Europe Bottled Water Products Analysis, Insights and Forecast, 2020-2032
- 8.1. Market Analysis, Insights and Forecast - by Application
- 8.1.1. Hypermarkets & Supermarkets
- 8.1.2. Convenience Stores
- 8.1.3. Grocery Stores
- 8.1.4. Online Retailers
- 8.1.5. Others
- 8.2. Market Analysis, Insights and Forecast - by Types
- 8.2.1. Carbonated Bottle Water
- 8.2.2. Flavored Bottle Water
- 8.2.3. Still Bottle Water
- 8.2.4. Functional Bottle Water
- 8.2.5. Others
- 8.1. Market Analysis, Insights and Forecast - by Application
- 9. Middle East & Africa Bottled Water Products Analysis, Insights and Forecast, 2020-2032
- 9.1. Market Analysis, Insights and Forecast - by Application
- 9.1.1. Hypermarkets & Supermarkets
- 9.1.2. Convenience Stores
- 9.1.3. Grocery Stores
- 9.1.4. Online Retailers
- 9.1.5. Others
- 9.2. Market Analysis, Insights and Forecast - by Types
- 9.2.1. Carbonated Bottle Water
- 9.2.2. Flavored Bottle Water
- 9.2.3. Still Bottle Water
- 9.2.4. Functional Bottle Water
- 9.2.5. Others
- 9.1. Market Analysis, Insights and Forecast - by Application
- 10. Asia Pacific Bottled Water Products Analysis, Insights and Forecast, 2020-2032
- 10.1. Market Analysis, Insights and Forecast - by Application
- 10.1.1. Hypermarkets & Supermarkets
- 10.1.2. Convenience Stores
- 10.1.3. Grocery Stores
- 10.1.4. Online Retailers
- 10.1.5. Others
- 10.2. Market Analysis, Insights and Forecast - by Types
- 10.2.1. Carbonated Bottle Water
- 10.2.2. Flavored Bottle Water
- 10.2.3. Still Bottle Water
- 10.2.4. Functional Bottle Water
- 10.2.5. Others
- 10.1. Market Analysis, Insights and Forecast - by Application
- 11. Competitive Analysis
- 11.1. Global Market Share Analysis 2025
- 11.2. Company Profiles
- 11.2.1 PepsiCo
- 11.2.1.1. Overview
- 11.2.1.2. Products
- 11.2.1.3. SWOT Analysis
- 11.2.1.4. Recent Developments
- 11.2.1.5. Financials (Based on Availability)
- 11.2.2 Danone
- 11.2.2.1. Overview
- 11.2.2.2. Products
- 11.2.2.3. SWOT Analysis
- 11.2.2.4. Recent Developments
- 11.2.2.5. Financials (Based on Availability)
- 11.2.3 Nestle
- 11.2.3.1. Overview
- 11.2.3.2. Products
- 11.2.3.3. SWOT Analysis
- 11.2.3.4. Recent Developments
- 11.2.3.5. Financials (Based on Availability)
- 11.2.4 Coca-Cola
- 11.2.4.1. Overview
- 11.2.4.2. Products
- 11.2.4.3. SWOT Analysis
- 11.2.4.4. Recent Developments
- 11.2.4.5. Financials (Based on Availability)
- 11.2.5 Bisleri International
- 11.2.5.1. Overview
- 11.2.5.2. Products
- 11.2.5.3. SWOT Analysis
- 11.2.5.4. Recent Developments
- 11.2.5.5. Financials (Based on Availability)
- 11.2.6 Suntory Water Group
- 11.2.6.1. Overview
- 11.2.6.2. Products
- 11.2.6.3. SWOT Analysis
- 11.2.6.4. Recent Developments
- 11.2.6.5. Financials (Based on Availability)
- 11.2.7 Gerolsteiner
- 11.2.7.1. Overview
- 11.2.7.2. Products
- 11.2.7.3. SWOT Analysis
- 11.2.7.4. Recent Developments
- 11.2.7.5. Financials (Based on Availability)
- 11.2.8 Ferrarelle
- 11.2.8.1. Overview
- 11.2.8.2. Products
- 11.2.8.3. SWOT Analysis
- 11.2.8.4. Recent Developments
- 11.2.8.5. Financials (Based on Availability)
- 11.2.9 Hildon
- 11.2.9.1. Overview
- 11.2.9.2. Products
- 11.2.9.3. SWOT Analysis
- 11.2.9.4. Recent Developments
- 11.2.9.5. Financials (Based on Availability)
- 11.2.10 Tynant
- 11.2.10.1. Overview
- 11.2.10.2. Products
- 11.2.10.3. SWOT Analysis
- 11.2.10.4. Recent Developments
- 11.2.10.5. Financials (Based on Availability)
- 11.2.11 Master Kong
- 11.2.11.1. Overview
- 11.2.11.2. Products
- 11.2.11.3. SWOT Analysis
- 11.2.11.4. Recent Developments
- 11.2.11.5. Financials (Based on Availability)
- 11.2.12 Nongfu Spring
- 11.2.12.1. Overview
- 11.2.12.2. Products
- 11.2.12.3. SWOT Analysis
- 11.2.12.4. Recent Developments
- 11.2.12.5. Financials (Based on Availability)
- 11.2.13 Wahaha
- 11.2.13.1. Overview
- 11.2.13.2. Products
- 11.2.13.3. SWOT Analysis
- 11.2.13.4. Recent Developments
- 11.2.13.5. Financials (Based on Availability)
- 11.2.14 Ganten
- 11.2.14.1. Overview
- 11.2.14.2. Products
- 11.2.14.3. SWOT Analysis
- 11.2.14.4. Recent Developments
- 11.2.14.5. Financials (Based on Availability)
- 11.2.15 Cestbon
- 11.2.15.1. Overview
- 11.2.15.2. Products
- 11.2.15.3. SWOT Analysis
- 11.2.15.4. Recent Developments
- 11.2.15.5. Financials (Based on Availability)
- 11.2.16 Kunlun Mountain
- 11.2.16.1. Overview
- 11.2.16.2. Products
- 11.2.16.3. SWOT Analysis
- 11.2.16.4. Recent Developments
- 11.2.16.5. Financials (Based on Availability)
- 11.2.17 Blue Sword
- 11.2.17.1. Overview
- 11.2.17.2. Products
- 11.2.17.3. SWOT Analysis
- 11.2.17.4. Recent Developments
- 11.2.17.5. Financials (Based on Availability)
- 11.2.18 Laoshan Water
- 11.2.18.1. Overview
- 11.2.18.2. Products
- 11.2.18.3. SWOT Analysis
- 11.2.18.4. Recent Developments
- 11.2.18.5. Financials (Based on Availability)
- 11.2.19 Al Ain Water
- 11.2.19.1. Overview
- 11.2.19.2. Products
- 11.2.19.3. SWOT Analysis
- 11.2.19.4. Recent Developments
- 11.2.19.5. Financials (Based on Availability)
- 11.2.20 NEVIOT
- 11.2.20.1. Overview
- 11.2.20.2. Products
- 11.2.20.3. SWOT Analysis
- 11.2.20.4. Recent Developments
- 11.2.20.5. Financials (Based on Availability)
- 11.2.21 Rayyan Mineral Water Co
- 11.2.21.1. Overview
- 11.2.21.2. Products
- 11.2.21.3. SWOT Analysis
- 11.2.21.4. Recent Developments
- 11.2.21.5. Financials (Based on Availability)
- 11.2.1 PepsiCo
List of Figures
- Figure 1: Global Bottled Water Products Revenue Breakdown (undefined, %) by Region 2025 & 2033
- Figure 2: North America Bottled Water Products Revenue (undefined), by Application 2025 & 2033
- Figure 3: North America Bottled Water Products Revenue Share (%), by Application 2025 & 2033
- Figure 4: North America Bottled Water Products Revenue (undefined), by Types 2025 & 2033
- Figure 5: North America Bottled Water Products Revenue Share (%), by Types 2025 & 2033
- Figure 6: North America Bottled Water Products Revenue (undefined), by Country 2025 & 2033
- Figure 7: North America Bottled Water Products Revenue Share (%), by Country 2025 & 2033
- Figure 8: South America Bottled Water Products Revenue (undefined), by Application 2025 & 2033
- Figure 9: South America Bottled Water Products Revenue Share (%), by Application 2025 & 2033
- Figure 10: South America Bottled Water Products Revenue (undefined), by Types 2025 & 2033
- Figure 11: South America Bottled Water Products Revenue Share (%), by Types 2025 & 2033
- Figure 12: South America Bottled Water Products Revenue (undefined), by Country 2025 & 2033
- Figure 13: South America Bottled Water Products Revenue Share (%), by Country 2025 & 2033
- Figure 14: Europe Bottled Water Products Revenue (undefined), by Application 2025 & 2033
- Figure 15: Europe Bottled Water Products Revenue Share (%), by Application 2025 & 2033
- Figure 16: Europe Bottled Water Products Revenue (undefined), by Types 2025 & 2033
- Figure 17: Europe Bottled Water Products Revenue Share (%), by Types 2025 & 2033
- Figure 18: Europe Bottled Water Products Revenue (undefined), by Country 2025 & 2033
- Figure 19: Europe Bottled Water Products Revenue Share (%), by Country 2025 & 2033
- Figure 20: Middle East & Africa Bottled Water Products Revenue (undefined), by Application 2025 & 2033
- Figure 21: Middle East & Africa Bottled Water Products Revenue Share (%), by Application 2025 & 2033
- Figure 22: Middle East & Africa Bottled Water Products Revenue (undefined), by Types 2025 & 2033
- Figure 23: Middle East & Africa Bottled Water Products Revenue Share (%), by Types 2025 & 2033
- Figure 24: Middle East & Africa Bottled Water Products Revenue (undefined), by Country 2025 & 2033
- Figure 25: Middle East & Africa Bottled Water Products Revenue Share (%), by Country 2025 & 2033
- Figure 26: Asia Pacific Bottled Water Products Revenue (undefined), by Application 2025 & 2033
- Figure 27: Asia Pacific Bottled Water Products Revenue Share (%), by Application 2025 & 2033
- Figure 28: Asia Pacific Bottled Water Products Revenue (undefined), by Types 2025 & 2033
- Figure 29: Asia Pacific Bottled Water Products Revenue Share (%), by Types 2025 & 2033
- Figure 30: Asia Pacific Bottled Water Products Revenue (undefined), by Country 2025 & 2033
- Figure 31: Asia Pacific Bottled Water Products Revenue Share (%), by Country 2025 & 2033
List of Tables
- Table 1: Global Bottled Water Products Revenue undefined Forecast, by Application 2020 & 2033
- Table 2: Global Bottled Water Products Revenue undefined Forecast, by Types 2020 & 2033
- Table 3: Global Bottled Water Products Revenue undefined Forecast, by Region 2020 & 2033
- Table 4: Global Bottled Water Products Revenue undefined Forecast, by Application 2020 & 2033
- Table 5: Global Bottled Water Products Revenue undefined Forecast, by Types 2020 & 2033
- Table 6: Global Bottled Water Products Revenue undefined Forecast, by Country 2020 & 2033
- Table 7: United States Bottled Water Products Revenue (undefined) Forecast, by Application 2020 & 2033
- Table 8: Canada Bottled Water Products Revenue (undefined) Forecast, by Application 2020 & 2033
- Table 9: Mexico Bottled Water Products Revenue (undefined) Forecast, by Application 2020 & 2033
- Table 10: Global Bottled Water Products Revenue undefined Forecast, by Application 2020 & 2033
- Table 11: Global Bottled Water Products Revenue undefined Forecast, by Types 2020 & 2033
- Table 12: Global Bottled Water Products Revenue undefined Forecast, by Country 2020 & 2033
- Table 13: Brazil Bottled Water Products Revenue (undefined) Forecast, by Application 2020 & 2033
- Table 14: Argentina Bottled Water Products Revenue (undefined) Forecast, by Application 2020 & 2033
- Table 15: Rest of South America Bottled Water Products Revenue (undefined) Forecast, by Application 2020 & 2033
- Table 16: Global Bottled Water Products Revenue undefined Forecast, by Application 2020 & 2033
- Table 17: Global Bottled Water Products Revenue undefined Forecast, by Types 2020 & 2033
- Table 18: Global Bottled Water Products Revenue undefined Forecast, by Country 2020 & 2033
- Table 19: United Kingdom Bottled Water Products Revenue (undefined) Forecast, by Application 2020 & 2033
- Table 20: Germany Bottled Water Products Revenue (undefined) Forecast, by Application 2020 & 2033
- Table 21: France Bottled Water Products Revenue (undefined) Forecast, by Application 2020 & 2033
- Table 22: Italy Bottled Water Products Revenue (undefined) Forecast, by Application 2020 & 2033
- Table 23: Spain Bottled Water Products Revenue (undefined) Forecast, by Application 2020 & 2033
- Table 24: Russia Bottled Water Products Revenue (undefined) Forecast, by Application 2020 & 2033
- Table 25: Benelux Bottled Water Products Revenue (undefined) Forecast, by Application 2020 & 2033
- Table 26: Nordics Bottled Water Products Revenue (undefined) Forecast, by Application 2020 & 2033
- Table 27: Rest of Europe Bottled Water Products Revenue (undefined) Forecast, by Application 2020 & 2033
- Table 28: Global Bottled Water Products Revenue undefined Forecast, by Application 2020 & 2033
- Table 29: Global Bottled Water Products Revenue undefined Forecast, by Types 2020 & 2033
- Table 30: Global Bottled Water Products Revenue undefined Forecast, by Country 2020 & 2033
- Table 31: Turkey Bottled Water Products Revenue (undefined) Forecast, by Application 2020 & 2033
- Table 32: Israel Bottled Water Products Revenue (undefined) Forecast, by Application 2020 & 2033
- Table 33: GCC Bottled Water Products Revenue (undefined) Forecast, by Application 2020 & 2033
- Table 34: North Africa Bottled Water Products Revenue (undefined) Forecast, by Application 2020 & 2033
- Table 35: South Africa Bottled Water Products Revenue (undefined) Forecast, by Application 2020 & 2033
- Table 36: Rest of Middle East & Africa Bottled Water Products Revenue (undefined) Forecast, by Application 2020 & 2033
- Table 37: Global Bottled Water Products Revenue undefined Forecast, by Application 2020 & 2033
- Table 38: Global Bottled Water Products Revenue undefined Forecast, by Types 2020 & 2033
- Table 39: Global Bottled Water Products Revenue undefined Forecast, by Country 2020 & 2033
- Table 40: China Bottled Water Products Revenue (undefined) Forecast, by Application 2020 & 2033
- Table 41: India Bottled Water Products Revenue (undefined) Forecast, by Application 2020 & 2033
- Table 42: Japan Bottled Water Products Revenue (undefined) Forecast, by Application 2020 & 2033
- Table 43: South Korea Bottled Water Products Revenue (undefined) Forecast, by Application 2020 & 2033
- Table 44: ASEAN Bottled Water Products Revenue (undefined) Forecast, by Application 2020 & 2033
- Table 45: Oceania Bottled Water Products Revenue (undefined) Forecast, by Application 2020 & 2033
- Table 46: Rest of Asia Pacific Bottled Water Products Revenue (undefined) Forecast, by Application 2020 & 2033
Frequently Asked Questions
1. What is the projected Compound Annual Growth Rate (CAGR) of the Bottled Water Products?
The projected CAGR is approximately 6.8%.
2. Which companies are prominent players in the Bottled Water Products?
Key companies in the market include PepsiCo, Danone, Nestle, Coca-Cola, Bisleri International, Suntory Water Group, Gerolsteiner, Ferrarelle, Hildon, Tynant, Master Kong, Nongfu Spring, Wahaha, Ganten, Cestbon, Kunlun Mountain, Blue Sword, Laoshan Water, Al Ain Water, NEVIOT, Rayyan Mineral Water Co.
3. What are the main segments of the Bottled Water Products?
The market segments include Application, Types.
4. Can you provide details about the market size?
The market size is estimated to be USD XXX N/A as of 2022.
5. What are some drivers contributing to market growth?
N/A
6. What are the notable trends driving market growth?
N/A
7. Are there any restraints impacting market growth?
N/A
8. Can you provide examples of recent developments in the market?
N/A
9. What pricing options are available for accessing the report?
Pricing options include single-user, multi-user, and enterprise licenses priced at USD 2900.00, USD 4350.00, and USD 5800.00 respectively.
10. Is the market size provided in terms of value or volume?
The market size is provided in terms of value, measured in N/A.
11. Are there any specific market keywords associated with the report?
Yes, the market keyword associated with the report is "Bottled Water Products," which aids in identifying and referencing the specific market segment covered.
12. How do I determine which pricing option suits my needs best?
The pricing options vary based on user requirements and access needs. Individual users may opt for single-user licenses, while businesses requiring broader access may choose multi-user or enterprise licenses for cost-effective access to the report.
13. Are there any additional resources or data provided in the Bottled Water Products report?
While the report offers comprehensive insights, it's advisable to review the specific contents or supplementary materials provided to ascertain if additional resources or data are available.
14. How can I stay updated on further developments or reports in the Bottled Water Products?
To stay informed about further developments, trends, and reports in the Bottled Water Products, consider subscribing to industry newsletters, following relevant companies and organizations, or regularly checking reputable industry news sources and publications.
Methodology
Step 1 - Identification of Relevant Samples Size from Population Database


Step 2 - Approaches for Defining Global Market Size (Value, Volume* & Price*)

Note*: In applicable scenarios
Step 3 - Data Sources
Primary Research
- Web Analytics
- Survey Reports
- Research Institute
- Latest Research Reports
- Opinion Leaders
Secondary Research
- Annual Reports
- White Paper
- Latest Press Release
- Industry Association
- Paid Database
- Investor Presentations

Step 4 - Data Triangulation
Involves using different sources of information in order to increase the validity of a study
These sources are likely to be stakeholders in a program - participants, other researchers, program staff, other community members, and so on.
Then we put all data in single framework & apply various statistical tools to find out the dynamic on the market.
During the analysis stage, feedback from the stakeholder groups would be compared to determine areas of agreement as well as areas of divergence