

Key Insights
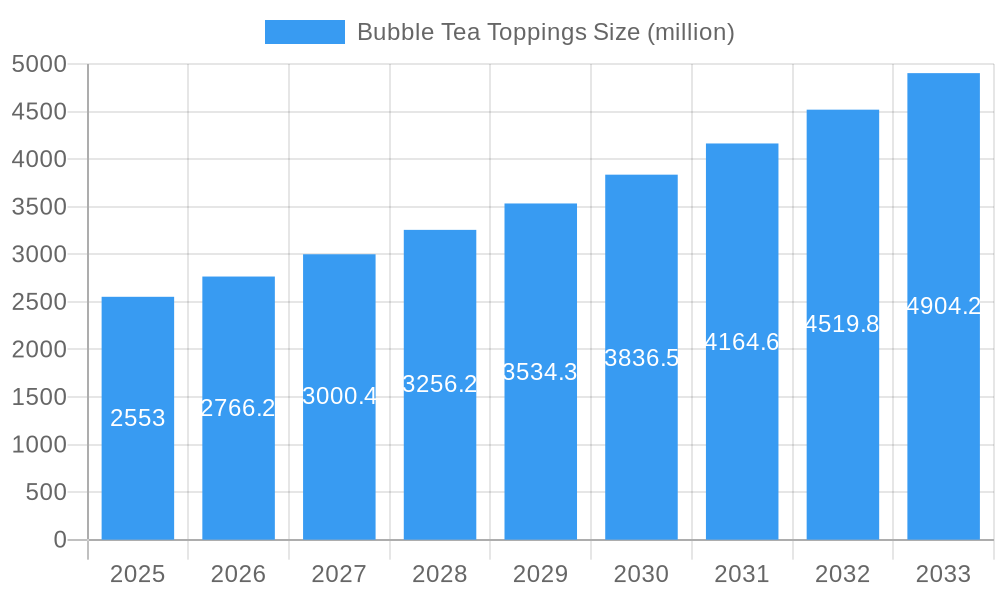
The global bubble tea toppings market, valued at $2553 million in 2025, is projected to experience robust growth, driven by the soaring popularity of bubble tea itself. This growth is fueled by several key factors. Firstly, the increasing demand for customizable and innovative beverage options among younger demographics is a significant driver. Secondly, the expansion of bubble tea shops into new markets and the rise of online ordering and delivery services are broadening market reach and accessibility. The market is witnessing a trend towards healthier and more natural toppings, with consumers increasingly seeking options that align with wellness trends. This is leading to the introduction of fruit-based, low-sugar, and organic toppings. However, price fluctuations in raw materials and potential regulatory changes concerning food additives could pose challenges to market growth. Competition among established players and emerging brands is also intensifying, requiring companies to continuously innovate and offer unique product propositions. Successful players are likely to leverage strategic partnerships, expand their product lines, and effectively target niche consumer segments.
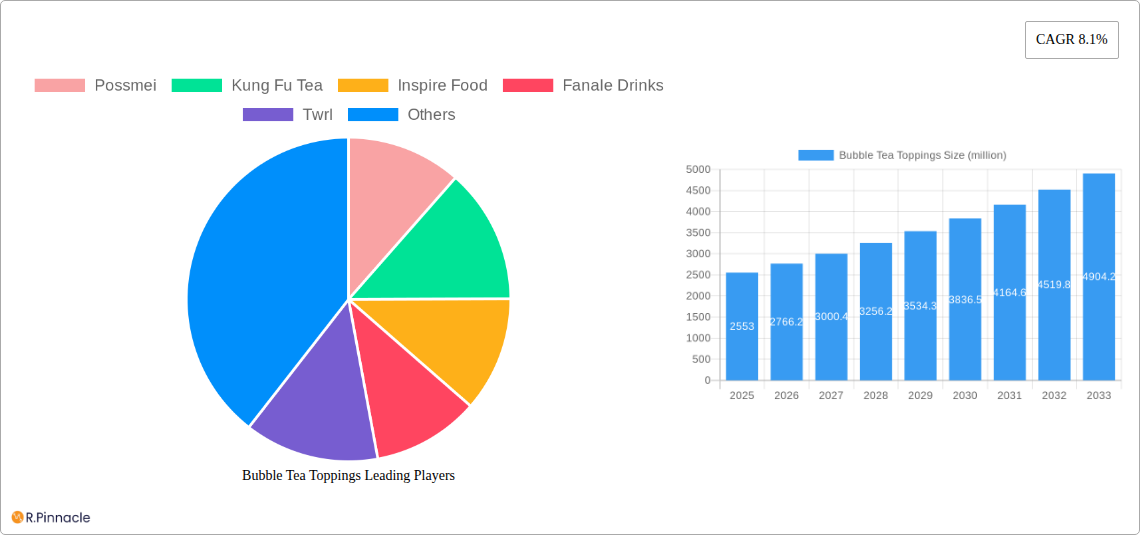
Bubble Tea Toppings Market Size (In Billion)
The CAGR of 8.1% suggests a steady and predictable expansion of the market throughout the forecast period (2025-2033). This consistent growth is expected to be driven by both volume and value increases. The increasing preference for premium and specialized toppings, such as artisanal jellies and unique flavored pearls, is contributing to a higher average selling price. The segmentation of the market likely reflects various types of toppings (e.g., tapioca pearls, popping boba, jellies, pudding), each with its own growth trajectory and consumer preferences. Geographical expansion into underpenetrated markets, especially in developing economies, presents a significant growth opportunity. Companies like Possmei, Kung Fu Tea, and Sharetea are well-positioned to capitalize on this expansion given their established brand presence and existing distribution networks. However, maintaining consistent quality and navigating fluctuating ingredient costs will be crucial for sustained success.
Bubble Tea Toppings Company Market Share
Bubble Tea Toppings Market Report: 2019-2033 - A Comprehensive Analysis
This comprehensive report provides an in-depth analysis of the global bubble tea toppings market, offering invaluable insights for industry professionals, investors, and strategic decision-makers. With a study period spanning 2019-2033, a base year of 2025, and an estimated and forecast period of 2025-2033, this report leverages extensive data to illuminate market trends, growth drivers, and future opportunities. The market size is projected to reach millions of dollars by 2033, showcasing significant growth potential.
Bubble Tea Toppings Market Structure & Innovation Trends
This section analyzes the competitive landscape, highlighting market concentration, key players' market share, and the role of innovation in shaping the market. We examine mergers and acquisitions (M&A) activity, including deal values (xx million USD), regulatory frameworks impacting product development, and the influence of substitute products on market dynamics. End-user demographics are also explored to understand consumer preferences and driving forces behind market growth. The analysis includes a detailed evaluation of the strategies employed by leading companies like Possmei, Kung Fu Tea, Inspire Food, and others, shedding light on their market positioning and competitive advantages.
Bubble Tea Toppings Market Dynamics & Trends
This section delves into the dynamic forces shaping the bubble tea toppings market. We examine market growth drivers, including rising consumer demand for unique flavors and textures, and the expansion of the bubble tea industry itself. Technological disruptions, such as advancements in food processing and packaging, are also analyzed for their impact on production efficiency and product quality. Consumer preferences, including evolving taste profiles and health consciousness, are thoroughly explored. The analysis includes a detailed assessment of the competitive dynamics, including pricing strategies, marketing campaigns, and product differentiation, ultimately projecting a Compound Annual Growth Rate (CAGR) of xx% and market penetration of xx% during the forecast period.
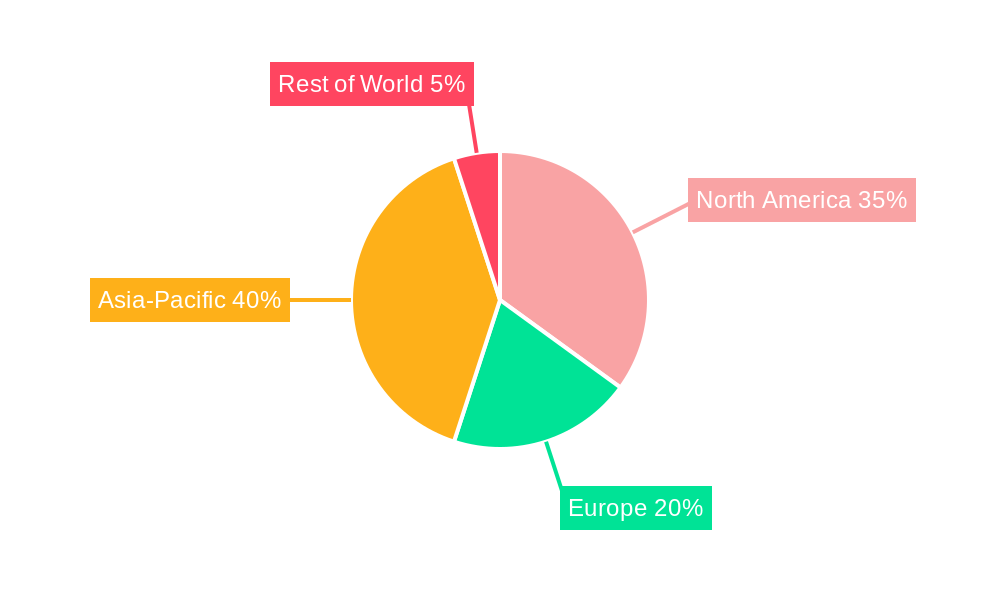
Dominant Regions & Segments in Bubble Tea Toppings
This section identifies the leading regions and segments within the bubble tea toppings market. A detailed dominance analysis is presented, pinpointing key factors driving market growth in these areas.
- Key Drivers in Dominant Regions:
- Economic factors (e.g., disposable income, consumer spending)
- Infrastructure development (e.g., retail networks, logistics)
- Government policies and regulations
- Cultural preferences and trends
Bubble Tea Toppings Product Innovations
This section summarizes the latest product developments in the bubble tea toppings market. We highlight innovative product applications, competitive advantages derived from technological advancements, and the overall market fit of these new offerings. Emphasis is placed on emerging technologies and their role in enhancing product quality, shelf life, and consumer appeal.
Report Scope & Segmentation Analysis
This report provides a comprehensive segmentation analysis, encompassing various categories within the bubble tea toppings market. Each segment is analyzed individually, with a detailed examination of its growth projections, market size, and competitive dynamics. The segmentation will include [Specific segmentations will be listed here, for example: by type of topping (e.g., tapioca pearls, popping boba, jellies), by flavor profile, by distribution channel].
Key Drivers of Bubble Tea Toppings Growth
This section outlines the key factors propelling the growth of the bubble tea toppings market. We examine technological advancements that enhance production efficiency and product quality, economic factors that impact consumer spending and demand, and regulatory influences that shape the market landscape. Examples of specific drivers are provided, including advancements in flavor creation, improved manufacturing processes, and supportive government policies promoting the food and beverage industry.
Challenges in the Bubble Tea Toppings Sector
This section identifies and analyzes the challenges hindering growth within the bubble tea toppings market. We discuss regulatory hurdles, potential supply chain disruptions, and competitive pressures, providing quantifiable impacts wherever possible (e.g., xx% increase in raw material costs impacting profitability).
Emerging Opportunities in Bubble Tea Toppings
This section highlights emerging trends and opportunities for growth within the bubble tea toppings market. We identify new market segments, such as potential expansion into underpenetrated regions, and technological opportunities, such as the application of novel ingredients or sustainable packaging solutions. We also consider shifts in consumer preferences, highlighting emerging health-conscious options.
Leading Players in the Bubble Tea Toppings Market
This section profiles the key players in the bubble tea toppings market.
- Possmei
- Kung Fu Tea
- Inspire Food
- Fanale Drinks
- Twrl
- Empire Eagle
- Bossen
- Lollicup
- Sunwide
- BobaBox
- Sunnysyrup Food
- Zawaa Foods
- Fine Things
- Leamaxx International
- Yen Chuan
- Grand Chainly
- Funtea
- Chen En Foods
- Sharetea
Key Developments in Bubble Tea Toppings Industry
This section provides a chronological overview of key developments in the bubble tea toppings industry, including product launches, mergers, and acquisitions, highlighting their impact on market dynamics. (Specific developments with dates will be included here).
Future Outlook for Bubble Tea Tea Toppings Market
This section summarizes the key growth accelerators expected to shape the future of the bubble tea toppings market. We explore the market's long-term potential and highlight strategic opportunities for businesses to capitalize on emerging trends and consumer preferences. The forecast highlights continued market expansion driven by sustained demand and ongoing product innovation.
Bubble Tea Toppings Segmentation
-
1. Application
- 1.1. Household
- 1.2. Commercial
-
2. Types
- 2.1. Tapioca-Based Toppings
- 2.2. Jelly-Based Toppings
- 2.3. Pudding-Based Toppings
- 2.4. Others
Bubble Tea Toppings Segmentation By Geography
-
1. North America
- 1.1. United States
- 1.2. Canada
- 1.3. Mexico
-
2. South America
- 2.1. Brazil
- 2.2. Argentina
- 2.3. Rest of South America
-
3. Europe
- 3.1. United Kingdom
- 3.2. Germany
- 3.3. France
- 3.4. Italy
- 3.5. Spain
- 3.6. Russia
- 3.7. Benelux
- 3.8. Nordics
- 3.9. Rest of Europe
-
4. Middle East & Africa
- 4.1. Turkey
- 4.2. Israel
- 4.3. GCC
- 4.4. North Africa
- 4.5. South Africa
- 4.6. Rest of Middle East & Africa
-
5. Asia Pacific
- 5.1. China
- 5.2. India
- 5.3. Japan
- 5.4. South Korea
- 5.5. ASEAN
- 5.6. Oceania
- 5.7. Rest of Asia Pacific
Bubble Tea Toppings Regional Market Share
Geographic Coverage of Bubble Tea Toppings
Bubble Tea Toppings REPORT HIGHLIGHTS
| Aspects | Details |
|---|---|
| Study Period | 2020-2034 |
| Base Year | 2025 |
| Estimated Year | 2026 |
| Forecast Period | 2026-2034 |
| Historical Period | 2020-2025 |
| Growth Rate | CAGR of 8.1% from 2020-2034 |
| Segmentation |
|
Table of Contents
- 1. Introduction
- 1.1. Research Scope
- 1.2. Market Segmentation
- 1.3. Research Methodology
- 1.4. Definitions and Assumptions
- 2. Executive Summary
- 2.1. Introduction
- 3. Market Dynamics
- 3.1. Introduction
- 3.2. Market Drivers
- 3.3. Market Restrains
- 3.4. Market Trends
- 4. Market Factor Analysis
- 4.1. Porters Five Forces
- 4.2. Supply/Value Chain
- 4.3. PESTEL analysis
- 4.4. Market Entropy
- 4.5. Patent/Trademark Analysis
- 5. Global Bubble Tea Toppings Analysis, Insights and Forecast, 2020-2032
- 5.1. Market Analysis, Insights and Forecast - by Application
- 5.1.1. Household
- 5.1.2. Commercial
- 5.2. Market Analysis, Insights and Forecast - by Types
- 5.2.1. Tapioca-Based Toppings
- 5.2.2. Jelly-Based Toppings
- 5.2.3. Pudding-Based Toppings
- 5.2.4. Others
- 5.3. Market Analysis, Insights and Forecast - by Region
- 5.3.1. North America
- 5.3.2. South America
- 5.3.3. Europe
- 5.3.4. Middle East & Africa
- 5.3.5. Asia Pacific
- 5.1. Market Analysis, Insights and Forecast - by Application
- 6. North America Bubble Tea Toppings Analysis, Insights and Forecast, 2020-2032
- 6.1. Market Analysis, Insights and Forecast - by Application
- 6.1.1. Household
- 6.1.2. Commercial
- 6.2. Market Analysis, Insights and Forecast - by Types
- 6.2.1. Tapioca-Based Toppings
- 6.2.2. Jelly-Based Toppings
- 6.2.3. Pudding-Based Toppings
- 6.2.4. Others
- 6.1. Market Analysis, Insights and Forecast - by Application
- 7. South America Bubble Tea Toppings Analysis, Insights and Forecast, 2020-2032
- 7.1. Market Analysis, Insights and Forecast - by Application
- 7.1.1. Household
- 7.1.2. Commercial
- 7.2. Market Analysis, Insights and Forecast - by Types
- 7.2.1. Tapioca-Based Toppings
- 7.2.2. Jelly-Based Toppings
- 7.2.3. Pudding-Based Toppings
- 7.2.4. Others
- 7.1. Market Analysis, Insights and Forecast - by Application
- 8. Europe Bubble Tea Toppings Analysis, Insights and Forecast, 2020-2032
- 8.1. Market Analysis, Insights and Forecast - by Application
- 8.1.1. Household
- 8.1.2. Commercial
- 8.2. Market Analysis, Insights and Forecast - by Types
- 8.2.1. Tapioca-Based Toppings
- 8.2.2. Jelly-Based Toppings
- 8.2.3. Pudding-Based Toppings
- 8.2.4. Others
- 8.1. Market Analysis, Insights and Forecast - by Application
- 9. Middle East & Africa Bubble Tea Toppings Analysis, Insights and Forecast, 2020-2032
- 9.1. Market Analysis, Insights and Forecast - by Application
- 9.1.1. Household
- 9.1.2. Commercial
- 9.2. Market Analysis, Insights and Forecast - by Types
- 9.2.1. Tapioca-Based Toppings
- 9.2.2. Jelly-Based Toppings
- 9.2.3. Pudding-Based Toppings
- 9.2.4. Others
- 9.1. Market Analysis, Insights and Forecast - by Application
- 10. Asia Pacific Bubble Tea Toppings Analysis, Insights and Forecast, 2020-2032
- 10.1. Market Analysis, Insights and Forecast - by Application
- 10.1.1. Household
- 10.1.2. Commercial
- 10.2. Market Analysis, Insights and Forecast - by Types
- 10.2.1. Tapioca-Based Toppings
- 10.2.2. Jelly-Based Toppings
- 10.2.3. Pudding-Based Toppings
- 10.2.4. Others
- 10.1. Market Analysis, Insights and Forecast - by Application
- 11. Competitive Analysis
- 11.1. Global Market Share Analysis 2025
- 11.2. Company Profiles
- 11.2.1 Possmei
- 11.2.1.1. Overview
- 11.2.1.2. Products
- 11.2.1.3. SWOT Analysis
- 11.2.1.4. Recent Developments
- 11.2.1.5. Financials (Based on Availability)
- 11.2.2 Kung Fu Tea
- 11.2.2.1. Overview
- 11.2.2.2. Products
- 11.2.2.3. SWOT Analysis
- 11.2.2.4. Recent Developments
- 11.2.2.5. Financials (Based on Availability)
- 11.2.3 Inspire Food
- 11.2.3.1. Overview
- 11.2.3.2. Products
- 11.2.3.3. SWOT Analysis
- 11.2.3.4. Recent Developments
- 11.2.3.5. Financials (Based on Availability)
- 11.2.4 Fanale Drinks
- 11.2.4.1. Overview
- 11.2.4.2. Products
- 11.2.4.3. SWOT Analysis
- 11.2.4.4. Recent Developments
- 11.2.4.5. Financials (Based on Availability)
- 11.2.5 Twrl
- 11.2.5.1. Overview
- 11.2.5.2. Products
- 11.2.5.3. SWOT Analysis
- 11.2.5.4. Recent Developments
- 11.2.5.5. Financials (Based on Availability)
- 11.2.6 Empire Eagle
- 11.2.6.1. Overview
- 11.2.6.2. Products
- 11.2.6.3. SWOT Analysis
- 11.2.6.4. Recent Developments
- 11.2.6.5. Financials (Based on Availability)
- 11.2.7 Bossen
- 11.2.7.1. Overview
- 11.2.7.2. Products
- 11.2.7.3. SWOT Analysis
- 11.2.7.4. Recent Developments
- 11.2.7.5. Financials (Based on Availability)
- 11.2.8 Lollicup
- 11.2.8.1. Overview
- 11.2.8.2. Products
- 11.2.8.3. SWOT Analysis
- 11.2.8.4. Recent Developments
- 11.2.8.5. Financials (Based on Availability)
- 11.2.9 Sunwide
- 11.2.9.1. Overview
- 11.2.9.2. Products
- 11.2.9.3. SWOT Analysis
- 11.2.9.4. Recent Developments
- 11.2.9.5. Financials (Based on Availability)
- 11.2.10 BobaBox
- 11.2.10.1. Overview
- 11.2.10.2. Products
- 11.2.10.3. SWOT Analysis
- 11.2.10.4. Recent Developments
- 11.2.10.5. Financials (Based on Availability)
- 11.2.11 Sunnysyrup Food
- 11.2.11.1. Overview
- 11.2.11.2. Products
- 11.2.11.3. SWOT Analysis
- 11.2.11.4. Recent Developments
- 11.2.11.5. Financials (Based on Availability)
- 11.2.12 Zawaa Foods
- 11.2.12.1. Overview
- 11.2.12.2. Products
- 11.2.12.3. SWOT Analysis
- 11.2.12.4. Recent Developments
- 11.2.12.5. Financials (Based on Availability)
- 11.2.13 Fine Things
- 11.2.13.1. Overview
- 11.2.13.2. Products
- 11.2.13.3. SWOT Analysis
- 11.2.13.4. Recent Developments
- 11.2.13.5. Financials (Based on Availability)
- 11.2.14 Leamaxx International
- 11.2.14.1. Overview
- 11.2.14.2. Products
- 11.2.14.3. SWOT Analysis
- 11.2.14.4. Recent Developments
- 11.2.14.5. Financials (Based on Availability)
- 11.2.15 Yen Chuan
- 11.2.15.1. Overview
- 11.2.15.2. Products
- 11.2.15.3. SWOT Analysis
- 11.2.15.4. Recent Developments
- 11.2.15.5. Financials (Based on Availability)
- 11.2.16 Grand Chainly
- 11.2.16.1. Overview
- 11.2.16.2. Products
- 11.2.16.3. SWOT Analysis
- 11.2.16.4. Recent Developments
- 11.2.16.5. Financials (Based on Availability)
- 11.2.17 Funtea
- 11.2.17.1. Overview
- 11.2.17.2. Products
- 11.2.17.3. SWOT Analysis
- 11.2.17.4. Recent Developments
- 11.2.17.5. Financials (Based on Availability)
- 11.2.18 Chen En Foods
- 11.2.18.1. Overview
- 11.2.18.2. Products
- 11.2.18.3. SWOT Analysis
- 11.2.18.4. Recent Developments
- 11.2.18.5. Financials (Based on Availability)
- 11.2.19 Sharetea
- 11.2.19.1. Overview
- 11.2.19.2. Products
- 11.2.19.3. SWOT Analysis
- 11.2.19.4. Recent Developments
- 11.2.19.5. Financials (Based on Availability)
- 11.2.1 Possmei
List of Figures
- Figure 1: Global Bubble Tea Toppings Revenue Breakdown (million, %) by Region 2025 & 2033
- Figure 2: North America Bubble Tea Toppings Revenue (million), by Application 2025 & 2033
- Figure 3: North America Bubble Tea Toppings Revenue Share (%), by Application 2025 & 2033
- Figure 4: North America Bubble Tea Toppings Revenue (million), by Types 2025 & 2033
- Figure 5: North America Bubble Tea Toppings Revenue Share (%), by Types 2025 & 2033
- Figure 6: North America Bubble Tea Toppings Revenue (million), by Country 2025 & 2033
- Figure 7: North America Bubble Tea Toppings Revenue Share (%), by Country 2025 & 2033
- Figure 8: South America Bubble Tea Toppings Revenue (million), by Application 2025 & 2033
- Figure 9: South America Bubble Tea Toppings Revenue Share (%), by Application 2025 & 2033
- Figure 10: South America Bubble Tea Toppings Revenue (million), by Types 2025 & 2033
- Figure 11: South America Bubble Tea Toppings Revenue Share (%), by Types 2025 & 2033
- Figure 12: South America Bubble Tea Toppings Revenue (million), by Country 2025 & 2033
- Figure 13: South America Bubble Tea Toppings Revenue Share (%), by Country 2025 & 2033
- Figure 14: Europe Bubble Tea Toppings Revenue (million), by Application 2025 & 2033
- Figure 15: Europe Bubble Tea Toppings Revenue Share (%), by Application 2025 & 2033
- Figure 16: Europe Bubble Tea Toppings Revenue (million), by Types 2025 & 2033
- Figure 17: Europe Bubble Tea Toppings Revenue Share (%), by Types 2025 & 2033
- Figure 18: Europe Bubble Tea Toppings Revenue (million), by Country 2025 & 2033
- Figure 19: Europe Bubble Tea Toppings Revenue Share (%), by Country 2025 & 2033
- Figure 20: Middle East & Africa Bubble Tea Toppings Revenue (million), by Application 2025 & 2033
- Figure 21: Middle East & Africa Bubble Tea Toppings Revenue Share (%), by Application 2025 & 2033
- Figure 22: Middle East & Africa Bubble Tea Toppings Revenue (million), by Types 2025 & 2033
- Figure 23: Middle East & Africa Bubble Tea Toppings Revenue Share (%), by Types 2025 & 2033
- Figure 24: Middle East & Africa Bubble Tea Toppings Revenue (million), by Country 2025 & 2033
- Figure 25: Middle East & Africa Bubble Tea Toppings Revenue Share (%), by Country 2025 & 2033
- Figure 26: Asia Pacific Bubble Tea Toppings Revenue (million), by Application 2025 & 2033
- Figure 27: Asia Pacific Bubble Tea Toppings Revenue Share (%), by Application 2025 & 2033
- Figure 28: Asia Pacific Bubble Tea Toppings Revenue (million), by Types 2025 & 2033
- Figure 29: Asia Pacific Bubble Tea Toppings Revenue Share (%), by Types 2025 & 2033
- Figure 30: Asia Pacific Bubble Tea Toppings Revenue (million), by Country 2025 & 2033
- Figure 31: Asia Pacific Bubble Tea Toppings Revenue Share (%), by Country 2025 & 2033
List of Tables
- Table 1: Global Bubble Tea Toppings Revenue million Forecast, by Application 2020 & 2033
- Table 2: Global Bubble Tea Toppings Revenue million Forecast, by Types 2020 & 2033
- Table 3: Global Bubble Tea Toppings Revenue million Forecast, by Region 2020 & 2033
- Table 4: Global Bubble Tea Toppings Revenue million Forecast, by Application 2020 & 2033
- Table 5: Global Bubble Tea Toppings Revenue million Forecast, by Types 2020 & 2033
- Table 6: Global Bubble Tea Toppings Revenue million Forecast, by Country 2020 & 2033
- Table 7: United States Bubble Tea Toppings Revenue (million) Forecast, by Application 2020 & 2033
- Table 8: Canada Bubble Tea Toppings Revenue (million) Forecast, by Application 2020 & 2033
- Table 9: Mexico Bubble Tea Toppings Revenue (million) Forecast, by Application 2020 & 2033
- Table 10: Global Bubble Tea Toppings Revenue million Forecast, by Application 2020 & 2033
- Table 11: Global Bubble Tea Toppings Revenue million Forecast, by Types 2020 & 2033
- Table 12: Global Bubble Tea Toppings Revenue million Forecast, by Country 2020 & 2033
- Table 13: Brazil Bubble Tea Toppings Revenue (million) Forecast, by Application 2020 & 2033
- Table 14: Argentina Bubble Tea Toppings Revenue (million) Forecast, by Application 2020 & 2033
- Table 15: Rest of South America Bubble Tea Toppings Revenue (million) Forecast, by Application 2020 & 2033
- Table 16: Global Bubble Tea Toppings Revenue million Forecast, by Application 2020 & 2033
- Table 17: Global Bubble Tea Toppings Revenue million Forecast, by Types 2020 & 2033
- Table 18: Global Bubble Tea Toppings Revenue million Forecast, by Country 2020 & 2033
- Table 19: United Kingdom Bubble Tea Toppings Revenue (million) Forecast, by Application 2020 & 2033
- Table 20: Germany Bubble Tea Toppings Revenue (million) Forecast, by Application 2020 & 2033
- Table 21: France Bubble Tea Toppings Revenue (million) Forecast, by Application 2020 & 2033
- Table 22: Italy Bubble Tea Toppings Revenue (million) Forecast, by Application 2020 & 2033
- Table 23: Spain Bubble Tea Toppings Revenue (million) Forecast, by Application 2020 & 2033
- Table 24: Russia Bubble Tea Toppings Revenue (million) Forecast, by Application 2020 & 2033
- Table 25: Benelux Bubble Tea Toppings Revenue (million) Forecast, by Application 2020 & 2033
- Table 26: Nordics Bubble Tea Toppings Revenue (million) Forecast, by Application 2020 & 2033
- Table 27: Rest of Europe Bubble Tea Toppings Revenue (million) Forecast, by Application 2020 & 2033
- Table 28: Global Bubble Tea Toppings Revenue million Forecast, by Application 2020 & 2033
- Table 29: Global Bubble Tea Toppings Revenue million Forecast, by Types 2020 & 2033
- Table 30: Global Bubble Tea Toppings Revenue million Forecast, by Country 2020 & 2033
- Table 31: Turkey Bubble Tea Toppings Revenue (million) Forecast, by Application 2020 & 2033
- Table 32: Israel Bubble Tea Toppings Revenue (million) Forecast, by Application 2020 & 2033
- Table 33: GCC Bubble Tea Toppings Revenue (million) Forecast, by Application 2020 & 2033
- Table 34: North Africa Bubble Tea Toppings Revenue (million) Forecast, by Application 2020 & 2033
- Table 35: South Africa Bubble Tea Toppings Revenue (million) Forecast, by Application 2020 & 2033
- Table 36: Rest of Middle East & Africa Bubble Tea Toppings Revenue (million) Forecast, by Application 2020 & 2033
- Table 37: Global Bubble Tea Toppings Revenue million Forecast, by Application 2020 & 2033
- Table 38: Global Bubble Tea Toppings Revenue million Forecast, by Types 2020 & 2033
- Table 39: Global Bubble Tea Toppings Revenue million Forecast, by Country 2020 & 2033
- Table 40: China Bubble Tea Toppings Revenue (million) Forecast, by Application 2020 & 2033
- Table 41: India Bubble Tea Toppings Revenue (million) Forecast, by Application 2020 & 2033
- Table 42: Japan Bubble Tea Toppings Revenue (million) Forecast, by Application 2020 & 2033
- Table 43: South Korea Bubble Tea Toppings Revenue (million) Forecast, by Application 2020 & 2033
- Table 44: ASEAN Bubble Tea Toppings Revenue (million) Forecast, by Application 2020 & 2033
- Table 45: Oceania Bubble Tea Toppings Revenue (million) Forecast, by Application 2020 & 2033
- Table 46: Rest of Asia Pacific Bubble Tea Toppings Revenue (million) Forecast, by Application 2020 & 2033
Frequently Asked Questions
1. What is the projected Compound Annual Growth Rate (CAGR) of the Bubble Tea Toppings?
The projected CAGR is approximately 8.1%.
2. Which companies are prominent players in the Bubble Tea Toppings?
Key companies in the market include Possmei, Kung Fu Tea, Inspire Food, Fanale Drinks, Twrl, Empire Eagle, Bossen, Lollicup, Sunwide, BobaBox, Sunnysyrup Food, Zawaa Foods, Fine Things, Leamaxx International, Yen Chuan, Grand Chainly, Funtea, Chen En Foods, Sharetea.
3. What are the main segments of the Bubble Tea Toppings?
The market segments include Application, Types.
4. Can you provide details about the market size?
The market size is estimated to be USD 2553 million as of 2022.
5. What are some drivers contributing to market growth?
N/A
6. What are the notable trends driving market growth?
N/A
7. Are there any restraints impacting market growth?
N/A
8. Can you provide examples of recent developments in the market?
N/A
9. What pricing options are available for accessing the report?
Pricing options include single-user, multi-user, and enterprise licenses priced at USD 4900.00, USD 7350.00, and USD 9800.00 respectively.
10. Is the market size provided in terms of value or volume?
The market size is provided in terms of value, measured in million.
11. Are there any specific market keywords associated with the report?
Yes, the market keyword associated with the report is "Bubble Tea Toppings," which aids in identifying and referencing the specific market segment covered.
12. How do I determine which pricing option suits my needs best?
The pricing options vary based on user requirements and access needs. Individual users may opt for single-user licenses, while businesses requiring broader access may choose multi-user or enterprise licenses for cost-effective access to the report.
13. Are there any additional resources or data provided in the Bubble Tea Toppings report?
While the report offers comprehensive insights, it's advisable to review the specific contents or supplementary materials provided to ascertain if additional resources or data are available.
14. How can I stay updated on further developments or reports in the Bubble Tea Toppings?
To stay informed about further developments, trends, and reports in the Bubble Tea Toppings, consider subscribing to industry newsletters, following relevant companies and organizations, or regularly checking reputable industry news sources and publications.
Methodology
Step 1 - Identification of Relevant Samples Size from Population Database


Step 2 - Approaches for Defining Global Market Size (Value, Volume* & Price*)

Note*: In applicable scenarios
Step 3 - Data Sources
Primary Research
- Web Analytics
- Survey Reports
- Research Institute
- Latest Research Reports
- Opinion Leaders
Secondary Research
- Annual Reports
- White Paper
- Latest Press Release
- Industry Association
- Paid Database
- Investor Presentations

Step 4 - Data Triangulation
Involves using different sources of information in order to increase the validity of a study
These sources are likely to be stakeholders in a program - participants, other researchers, program staff, other community members, and so on.
Then we put all data in single framework & apply various statistical tools to find out the dynamic on the market.
During the analysis stage, feedback from the stakeholder groups would be compared to determine areas of agreement as well as areas of divergence