

Key Insights
The global bulletproof glass market is poised for substantial expansion, projected to achieve a Compound Annual Growth Rate (CAGR) of 11.78%. This robust growth is underpinned by escalating security imperatives across the automotive, construction, and defense sectors. Increased concerns over crime and terrorism are driving the adoption of advanced protective glazing in both public and private environments. Technological innovations in material science are yielding lighter, stronger, and more transparent bulletproof glass solutions, further fueling market development. The automotive sector's emphasis on integrated safety features, including bullet-resistant glass in premium and security-focused vehicles, represents a key growth catalyst. The market is segmented by product type, including Solid Acrylic, Traditional Laminated, Polycarbonate, Glass-clad Polycarbonate, and other variants, and by end-user industries such as Automotive, Buildings and Construction, Defense, and other sectors. The Asia Pacific region, notably China and India, exhibits significant growth potential driven by rapid urbanization and infrastructure development. However, high manufacturing and installation costs present a notable market restraint.
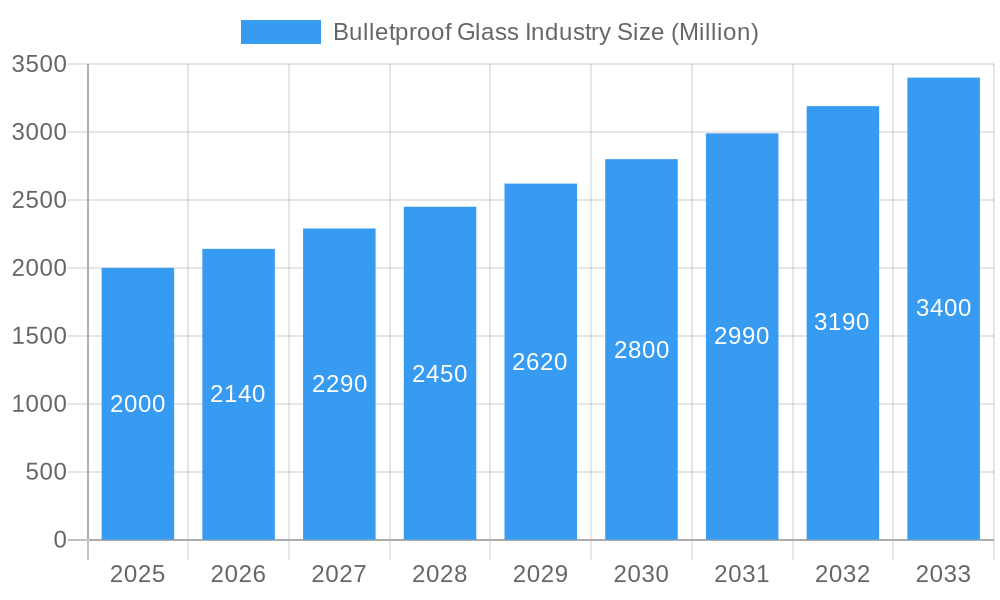
Bulletproof Glass Industry Market Size (In Billion)
The competitive landscape features established leaders like Saint-Gobain, Guardian Industries Holdings, and Asahi India Glass Limited, alongside specialized security firms such as Centigon Security Group and Armortex. Strategic initiatives focus on innovation, partnerships, and global expansion to secure market positions. The market size in 2025 is estimated at $10.83 billion. Future market trajectory will be shaped by continuous technological advancements, persistent global security concerns, and regulatory frameworks encouraging the use of bulletproof glass in critical infrastructure. Regional market dynamics will be influenced by economic performance, security challenges, and infrastructure investment.
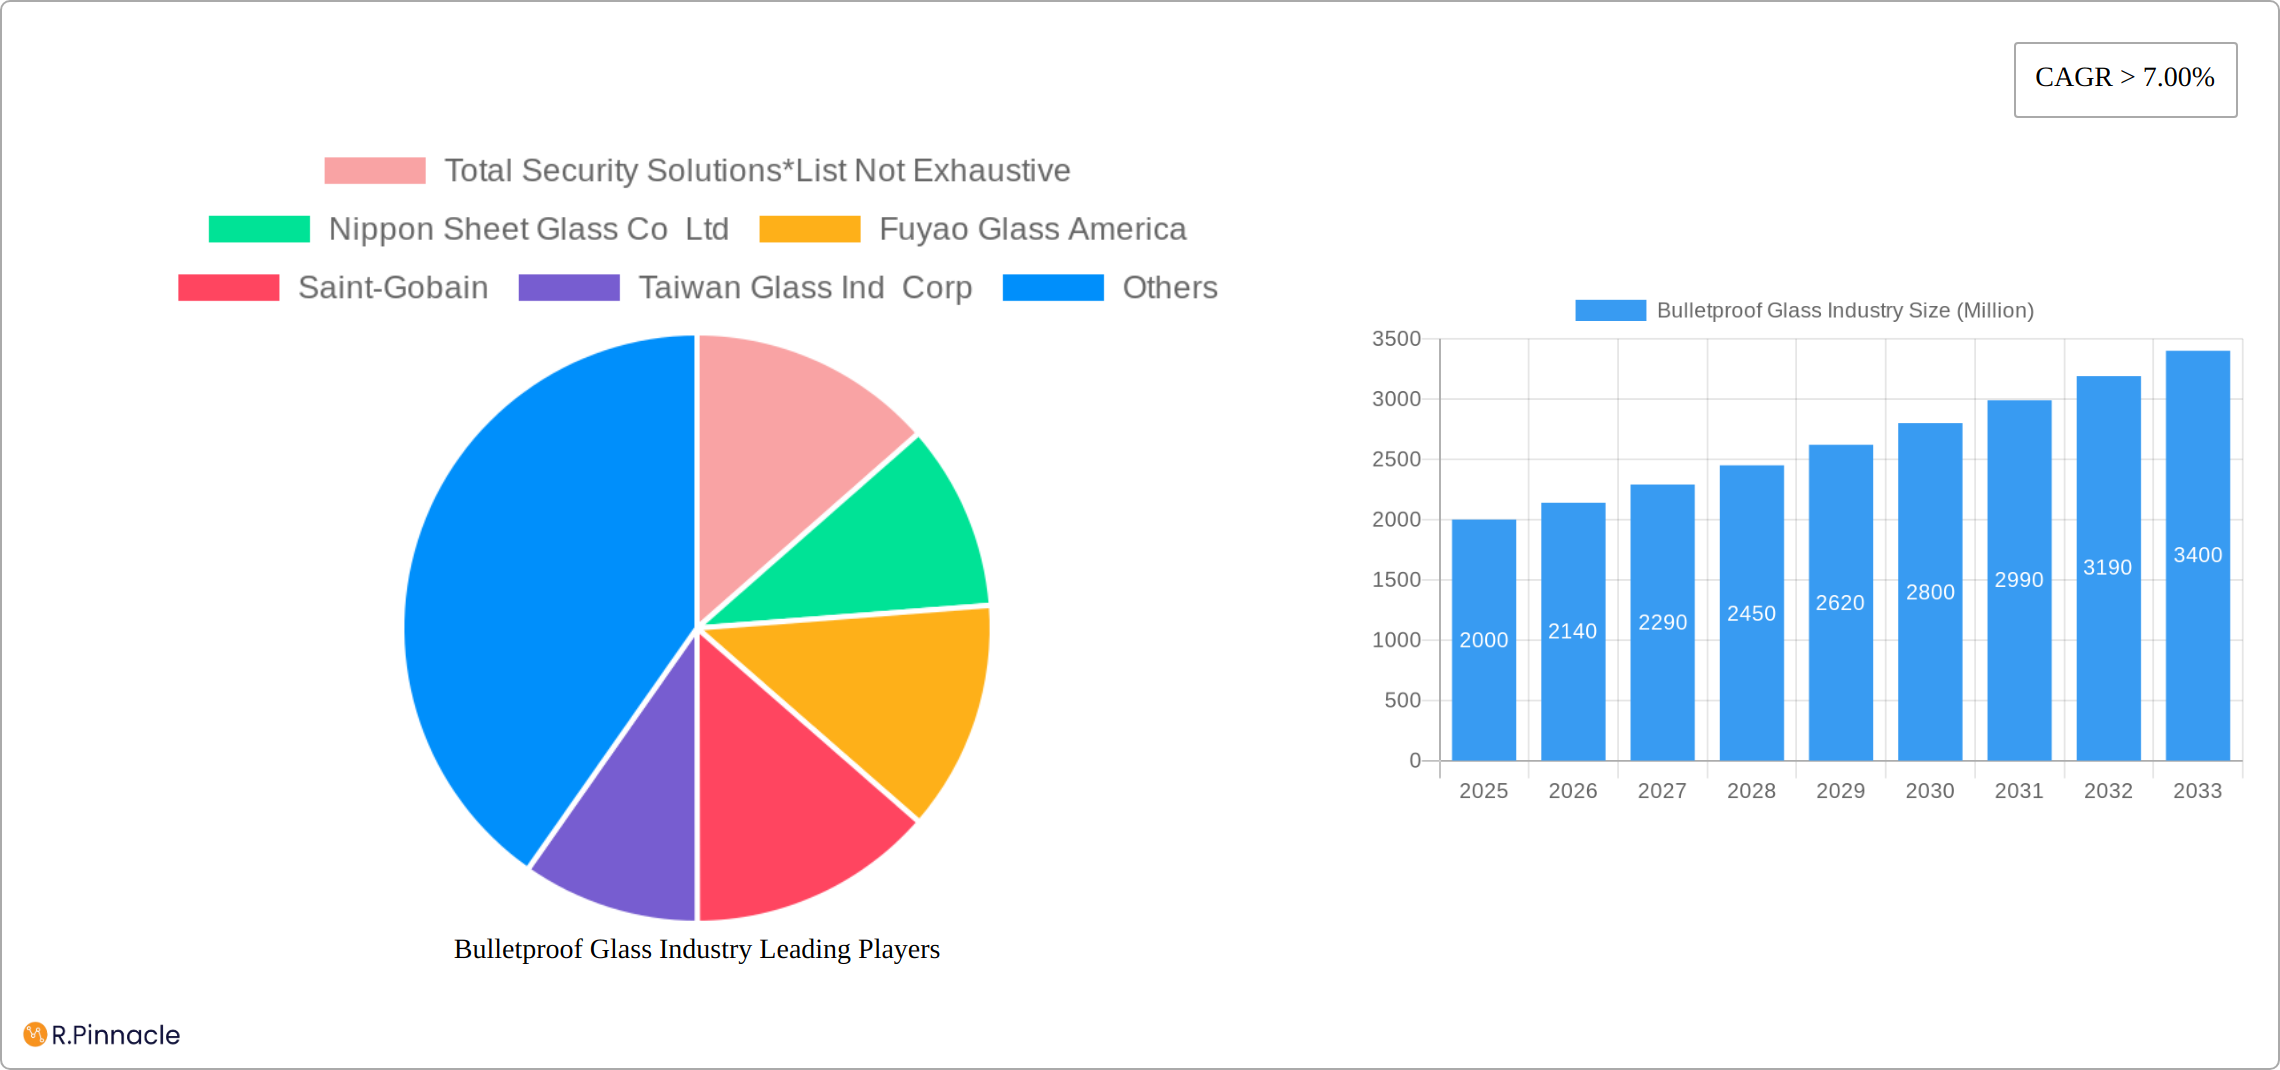
Bulletproof Glass Industry Company Market Share
Bulletproof Glass Industry Market Report: 2019-2033
This comprehensive report provides an in-depth analysis of the global bulletproof glass industry, offering valuable insights for industry professionals, investors, and strategic decision-makers. With a study period spanning 2019-2033, a base year of 2025, and a forecast period of 2025-2033, this report delivers a precise outlook on market dynamics, segmentation, and future trends. The global market is estimated to be worth xx Million in 2025.
Bulletproof Glass Industry Market Structure & Innovation Trends
This section analyzes the competitive landscape, innovation drivers, and regulatory environment shaping the bulletproof glass market. The industry exhibits a moderately consolidated structure with key players such as Total Security Solutions, Nippon Sheet Glass Co Ltd, Fuyao Glass America, Saint-Gobain, and others holding significant market share. The exact market share distribution for each company is unavailable, but estimations suggest a few major players command a substantial percentage of the total market. Innovation is driven by advancements in materials science, leading to the development of lighter, stronger, and more transparent bulletproof glass solutions. Regulatory frameworks, varying by region, play a crucial role in product standards and adoption. The market also sees the impact of product substitutes, particularly in specific applications, and ongoing M&A activity further shapes the industry dynamics. Recent M&A deal values are unavailable but are predicted to be in the range of xx Million annually.
Bulletproof Glass Industry Market Dynamics & Trends
The bulletproof glass market is experiencing robust growth, fueled by rising security concerns across various sectors. The Compound Annual Growth Rate (CAGR) during the forecast period (2025-2033) is projected to be xx%, driven by factors including increasing demand from the automotive, construction, and defense industries. Technological disruptions, such as the introduction of new materials and manufacturing techniques, are continuously enhancing product performance and reducing costs. Consumer preferences are shifting towards more aesthetically pleasing and versatile bulletproof glass solutions, impacting product design and market penetration. Competitive dynamics are characterized by intense rivalry among established players and emerging entrants, leading to continuous innovation and price competition. Market penetration varies significantly across regions, with developed nations exhibiting higher adoption rates.
Dominant Regions & Segments in Bulletproof Glass Industry
The bulletproof glass market is currently dominated by North America and Europe, fueled by robust infrastructure development, stringent security regulations, and high disposable incomes. These regions benefit from established security protocols and a higher demand for protective solutions. However, the Asia-Pacific region is poised for substantial growth, driven by rapid urbanization, rising investments in infrastructure projects, and a burgeoning middle class with increased purchasing power. This growth signifies a shift towards a more globally distributed market for bulletproof glass solutions.
Leading Segments:
- Type: Traditional laminated glass remains a market leader due to its established technology and cost-effectiveness. However, polycarbonate and glass-clad polycarbonate are gaining significant traction, owing to their superior impact resistance and lightweight properties, making them increasingly attractive for various applications. Advancements in materials science continue to drive innovation in this segment, leading to the development of lighter, stronger, and more transparent solutions.
- End-user Industry: The buildings and construction sector continues to be the largest consumer of bulletproof glass, driven by increased investments in commercial and residential high-security structures. The automotive industry, with its focus on enhancing vehicle safety features, represents a substantial and consistently growing segment. The defense and security sectors also contribute significantly, particularly in governmental and military applications requiring high levels of protection.
Key Drivers:
- Stringent government regulations and substantial investments in security infrastructure, particularly in developed and rapidly developing nations, are crucial drivers. This includes initiatives to enhance public safety and protect critical infrastructure.
- The rising awareness of safety and security concerns in both public and private spaces is fueling increased demand for bulletproof glass solutions. This demand is further amplified by global events and heightened security anxieties.
- The automotive industry's continuous efforts to improve vehicle safety features, particularly in high-risk regions and for high-value vehicles, significantly boosts demand.
- Increased global spending on defense and homeland security initiatives, driven by geopolitical uncertainties and the need to protect critical assets, consistently fuels market growth.
Bulletproof Glass Industry Product Innovations
Recent advancements in bulletproof glass technology focus on improving transparency, weight reduction, and impact resistance. The integration of advanced materials, such as specialized polymers and ceramics, is enhancing product performance and expanding application possibilities. These innovations are improving the overall aesthetics and functionality of bulletproof glass, leading to increased market acceptance.
Report Scope & Segmentation Analysis
This report provides a comprehensive segmentation analysis of the bulletproof glass market, considering various parameters. The market is segmented by type (Solid Acrylic, Traditional Laminated, Polycarbonate, Glass-clad Polycarbonate, Other Types) and end-user industry (Automotive, Buildings and Construction, Defense, Other End-user Industries). Each segment's growth projections, market size, and competitive dynamics are detailed within the full report. Detailed growth projections for each segment are available within the full report.
Key Drivers of Bulletproof Glass Industry Growth
The bulletproof glass industry's growth is propelled by several key factors: increasing urbanization and infrastructure development, stricter safety regulations, rising demand from the automotive and construction sectors, and heightened security concerns worldwide. Technological advancements leading to lighter, stronger, and more transparent products further stimulate market expansion.
Challenges in the Bulletproof Glass Industry Sector
The bulletproof glass industry faces challenges such as high manufacturing costs, stringent regulatory compliance requirements, and fluctuating raw material prices. Supply chain disruptions can impact production, and intense competition among existing players exerts pressure on profit margins. The industry also faces challenges in balancing cost and performance, particularly for specific applications.
Emerging Opportunities in Bulletproof Glass Industry
Significant opportunities exist for the bulletproof glass industry in emerging markets, particularly in developing countries experiencing rapid urbanization and industrialization. Advancements in materials science, particularly in lighter and more transparent materials, offer prospects for enhanced product development. The increasing demand for customized solutions in niche applications presents significant potential for growth.
Leading Players in the Bulletproof Glass Industry Market
- Total Security Solutions *List Not Exhaustive
- Nippon Sheet Glass Co Ltd
- Fuyao Glass America
- Saint-Gobain
- Taiwan Glass Ind Corp
- Armortex
- Centigon Security Group
- Guardian Industries Holdings
- Asahi India Glass Limited
- Armass glass
- STEC ARMOUR GLASS
- Consolidated Glass Holdings Inc
- Binswanger Glass
- Guangdong Golden Glass Technologies Limited
- SCHOTT AG
Key Developments in Bulletproof Glass Industry Industry
- January 2023: Asahi India Glass Limited announced its collaboration with Enormous Brands for brand films, aiming for a larger market impact in doors and windows.
- January 2023: Guardian Glass acquired Vortex Glass, expanding its offerings in tempered glass packages for residential and commercial construction.
Future Outlook for Bulletproof Glass Industry Market
The future of the bulletproof glass industry looks promising, driven by ongoing technological advancements, increasing security needs globally, and substantial infrastructure investments worldwide. Strategic partnerships and collaborations will play a key role in shaping the market landscape. The focus on sustainable and eco-friendly production methods will become increasingly important in the years to come.
Bulletproof Glass Industry Segmentation
-
1. Type
- 1.1. Solid Acrylic
- 1.2. Traditional Laminated
- 1.3. Polycarbonate
- 1.4. Glass-clad Polycarbonate
- 1.5. Other Types
-
2. End-user Industry
- 2.1. Automotive
- 2.2. Buildings and Construction
- 2.3. Defense
- 2.4. Other End-user Industries
Bulletproof Glass Industry Segmentation By Geography
-
1. Asia Pacific
- 1.1. China
- 1.2. India
- 1.3. Japan
- 1.4. South Korea
- 1.5. Rest of Asia Pacific
-
2. North America
- 2.1. United States
- 2.2. Canada
- 2.3. Mexico
-
3. Europe
- 3.1. Germany
- 3.2. United Kingdom
- 3.3. France
- 3.4. Italy
- 3.5. Rest of Europe
-
4. South America
- 4.1. Brazil
- 4.2. Argentina
- 4.3. Rest of South America
- 5. Middle East
-
6. Saudi Arabia
- 6.1. South Africa
- 6.2. Rest of Middle East
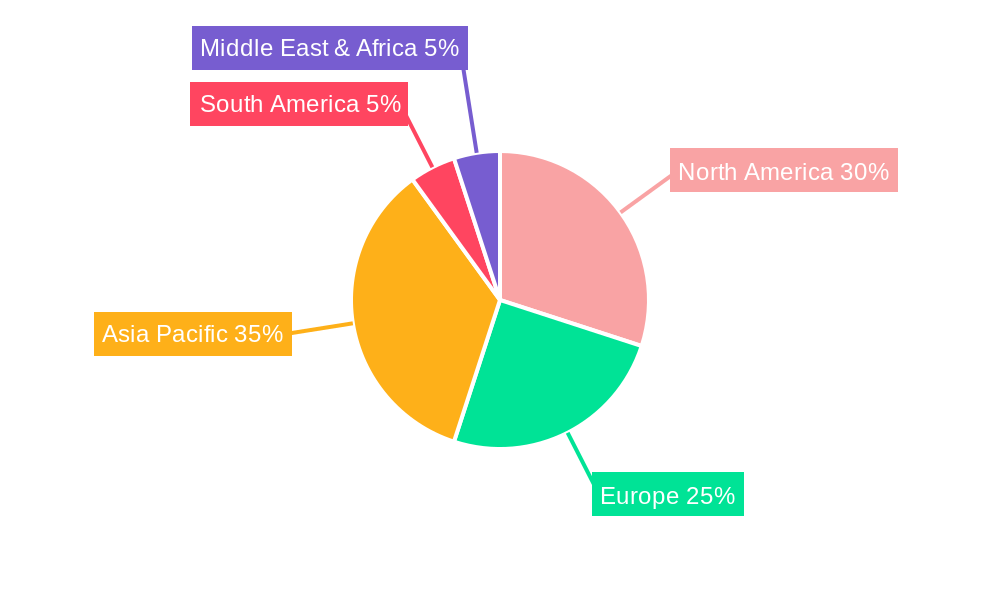
Bulletproof Glass Industry Regional Market Share
Geographic Coverage of Bulletproof Glass Industry
Bulletproof Glass Industry REPORT HIGHLIGHTS
| Aspects | Details |
|---|---|
| Study Period | 2020-2034 |
| Base Year | 2025 |
| Estimated Year | 2026 |
| Forecast Period | 2026-2034 |
| Historical Period | 2020-2025 |
| Growth Rate | CAGR of 11.78% from 2020-2034 |
| Segmentation |
|
Table of Contents
- 1. Introduction
- 1.1. Research Scope
- 1.2. Market Segmentation
- 1.3. Research Objective
- 1.4. Definitions and Assumptions
- 2. Executive Summary
- 2.1. Market Snapshot
- 3. Market Dynamics
- 3.1. Market Drivers
- 3.2. Market Restrains
- 3.3. Market Trends
- 3.4. Market Opportunities
- 4. Market Factor Analysis
- 4.1. Porters Five Forces
- 4.1.1. Bargaining Power of Suppliers
- 4.1.2. Bargaining Power of Buyers
- 4.1.3. Threat of New Entrants
- 4.1.4. Threat of Substitutes
- 4.1.5. Competitive Rivalry
- 4.2. PESTEL analysis
- 4.3. BCG Analysis
- 4.3.1. Stars (High Growth, High Market Share)
- 4.3.2. Cash Cows (Low Growth, High Market Share)
- 4.3.3. Question Mark (High Growth, Low Market Share)
- 4.3.4. Dogs (Low Growth, Low Market Share)
- 4.4. Ansoff Matrix Analysis
- 4.5. Supply Chain Analysis
- 4.6. Regulatory Landscape
- 4.7. Current Market Potential and Opportunity Assessment (TAM–SAM–SOM Framework)
- 4.8. PRI Analyst Note
- 4.1. Porters Five Forces
- 5. Market Analysis, Insights and Forecast 2021-2033
- 5.1. Market Analysis, Insights and Forecast - by Type
- 5.1.1. Solid Acrylic
- 5.1.2. Traditional Laminated
- 5.1.3. Polycarbonate
- 5.1.4. Glass-clad Polycarbonate
- 5.1.5. Other Types
- 5.2. Market Analysis, Insights and Forecast - by End-user Industry
- 5.2.1. Automotive
- 5.2.2. Buildings and Construction
- 5.2.3. Defense
- 5.2.4. Other End-user Industries
- 5.3. Market Analysis, Insights and Forecast - by Region
- 5.3.1. Asia Pacific
- 5.3.2. North America
- 5.3.3. Europe
- 5.3.4. South America
- 5.3.5. Middle East
- 5.3.6. Saudi Arabia
- 5.1. Market Analysis, Insights and Forecast - by Type
- 6. Global Bulletproof Glass Industry Analysis, Insights and Forecast, 2021-2033
- 6.1. Market Analysis, Insights and Forecast - by Type
- 6.1.1. Solid Acrylic
- 6.1.2. Traditional Laminated
- 6.1.3. Polycarbonate
- 6.1.4. Glass-clad Polycarbonate
- 6.1.5. Other Types
- 6.2. Market Analysis, Insights and Forecast - by End-user Industry
- 6.2.1. Automotive
- 6.2.2. Buildings and Construction
- 6.2.3. Defense
- 6.2.4. Other End-user Industries
- 6.1. Market Analysis, Insights and Forecast - by Type
- 7. Asia Pacific Bulletproof Glass Industry Analysis, Insights and Forecast, 2020-2032
- 7.1. Market Analysis, Insights and Forecast - by Type
- 7.1.1. Solid Acrylic
- 7.1.2. Traditional Laminated
- 7.1.3. Polycarbonate
- 7.1.4. Glass-clad Polycarbonate
- 7.1.5. Other Types
- 7.2. Market Analysis, Insights and Forecast - by End-user Industry
- 7.2.1. Automotive
- 7.2.2. Buildings and Construction
- 7.2.3. Defense
- 7.2.4. Other End-user Industries
- 7.1. Market Analysis, Insights and Forecast - by Type
- 8. North America Bulletproof Glass Industry Analysis, Insights and Forecast, 2020-2032
- 8.1. Market Analysis, Insights and Forecast - by Type
- 8.1.1. Solid Acrylic
- 8.1.2. Traditional Laminated
- 8.1.3. Polycarbonate
- 8.1.4. Glass-clad Polycarbonate
- 8.1.5. Other Types
- 8.2. Market Analysis, Insights and Forecast - by End-user Industry
- 8.2.1. Automotive
- 8.2.2. Buildings and Construction
- 8.2.3. Defense
- 8.2.4. Other End-user Industries
- 8.1. Market Analysis, Insights and Forecast - by Type
- 9. Europe Bulletproof Glass Industry Analysis, Insights and Forecast, 2020-2032
- 9.1. Market Analysis, Insights and Forecast - by Type
- 9.1.1. Solid Acrylic
- 9.1.2. Traditional Laminated
- 9.1.3. Polycarbonate
- 9.1.4. Glass-clad Polycarbonate
- 9.1.5. Other Types
- 9.2. Market Analysis, Insights and Forecast - by End-user Industry
- 9.2.1. Automotive
- 9.2.2. Buildings and Construction
- 9.2.3. Defense
- 9.2.4. Other End-user Industries
- 9.1. Market Analysis, Insights and Forecast - by Type
- 10. South America Bulletproof Glass Industry Analysis, Insights and Forecast, 2020-2032
- 10.1. Market Analysis, Insights and Forecast - by Type
- 10.1.1. Solid Acrylic
- 10.1.2. Traditional Laminated
- 10.1.3. Polycarbonate
- 10.1.4. Glass-clad Polycarbonate
- 10.1.5. Other Types
- 10.2. Market Analysis, Insights and Forecast - by End-user Industry
- 10.2.1. Automotive
- 10.2.2. Buildings and Construction
- 10.2.3. Defense
- 10.2.4. Other End-user Industries
- 10.1. Market Analysis, Insights and Forecast - by Type
- 11. Middle East Bulletproof Glass Industry Analysis, Insights and Forecast, 2020-2032
- 11.1. Market Analysis, Insights and Forecast - by Type
- 11.1.1. Solid Acrylic
- 11.1.2. Traditional Laminated
- 11.1.3. Polycarbonate
- 11.1.4. Glass-clad Polycarbonate
- 11.1.5. Other Types
- 11.2. Market Analysis, Insights and Forecast - by End-user Industry
- 11.2.1. Automotive
- 11.2.2. Buildings and Construction
- 11.2.3. Defense
- 11.2.4. Other End-user Industries
- 11.1. Market Analysis, Insights and Forecast - by Type
- 12. Saudi Arabia Bulletproof Glass Industry Analysis, Insights and Forecast, 2020-2032
- 12.1. Market Analysis, Insights and Forecast - by Type
- 12.1.1. Solid Acrylic
- 12.1.2. Traditional Laminated
- 12.1.3. Polycarbonate
- 12.1.4. Glass-clad Polycarbonate
- 12.1.5. Other Types
- 12.2. Market Analysis, Insights and Forecast - by End-user Industry
- 12.2.1. Automotive
- 12.2.2. Buildings and Construction
- 12.2.3. Defense
- 12.2.4. Other End-user Industries
- 12.1. Market Analysis, Insights and Forecast - by Type
- 13. Competitive Analysis
- 13.1. Company Profiles
- 13.1.1 Total Security Solutions*List Not Exhaustive
- 13.1.1.1. Company Overview
- 13.1.1.2. Products
- 13.1.1.3. Company Financials
- 13.1.1.4. SWOT Analysis
- 13.1.2 Nippon Sheet Glass Co Ltd
- 13.1.2.1. Company Overview
- 13.1.2.2. Products
- 13.1.2.3. Company Financials
- 13.1.2.4. SWOT Analysis
- 13.1.3 Fuyao Glass America
- 13.1.3.1. Company Overview
- 13.1.3.2. Products
- 13.1.3.3. Company Financials
- 13.1.3.4. SWOT Analysis
- 13.1.4 Saint-Gobain
- 13.1.4.1. Company Overview
- 13.1.4.2. Products
- 13.1.4.3. Company Financials
- 13.1.4.4. SWOT Analysis
- 13.1.5 Taiwan Glass Ind Corp
- 13.1.5.1. Company Overview
- 13.1.5.2. Products
- 13.1.5.3. Company Financials
- 13.1.5.4. SWOT Analysis
- 13.1.6 Armortex
- 13.1.6.1. Company Overview
- 13.1.6.2. Products
- 13.1.6.3. Company Financials
- 13.1.6.4. SWOT Analysis
- 13.1.7 Centigon Security Group
- 13.1.7.1. Company Overview
- 13.1.7.2. Products
- 13.1.7.3. Company Financials
- 13.1.7.4. SWOT Analysis
- 13.1.8 Guardian Industries Holdings
- 13.1.8.1. Company Overview
- 13.1.8.2. Products
- 13.1.8.3. Company Financials
- 13.1.8.4. SWOT Analysis
- 13.1.9 Asahi India Glass Limited
- 13.1.9.1. Company Overview
- 13.1.9.2. Products
- 13.1.9.3. Company Financials
- 13.1.9.4. SWOT Analysis
- 13.1.10 Armass glass
- 13.1.10.1. Company Overview
- 13.1.10.2. Products
- 13.1.10.3. Company Financials
- 13.1.10.4. SWOT Analysis
- 13.1.11 STEC ARMOUR GLASS
- 13.1.11.1. Company Overview
- 13.1.11.2. Products
- 13.1.11.3. Company Financials
- 13.1.11.4. SWOT Analysis
- 13.1.12 Consolidated Glass Holdings Inc
- 13.1.12.1. Company Overview
- 13.1.12.2. Products
- 13.1.12.3. Company Financials
- 13.1.12.4. SWOT Analysis
- 13.1.13 Binswanger Glass
- 13.1.13.1. Company Overview
- 13.1.13.2. Products
- 13.1.13.3. Company Financials
- 13.1.13.4. SWOT Analysis
- 13.1.14 Guangdong Golden Glass Technologies Limited
- 13.1.14.1. Company Overview
- 13.1.14.2. Products
- 13.1.14.3. Company Financials
- 13.1.14.4. SWOT Analysis
- 13.1.15 SCHOTT AG
- 13.1.15.1. Company Overview
- 13.1.15.2. Products
- 13.1.15.3. Company Financials
- 13.1.15.4. SWOT Analysis
- 13.1.1 Total Security Solutions*List Not Exhaustive
- 13.2. Market Entropy
- 13.2.1 Company's Key Areas Served
- 13.2.2 Recent Developments
- 13.3. Company Market Share Analysis 2025
- 13.3.1 Top 5 Companies Market Share Analysis
- 13.3.2 Top 3 Companies Market Share Analysis
- 13.4. List of Potential Customers
- 14. Research Methodology
List of Figures
- Figure 1: Global Bulletproof Glass Industry Revenue Breakdown (billion, %) by Region 2025 & 2033
- Figure 2: Asia Pacific Bulletproof Glass Industry Revenue (billion), by Type 2025 & 2033
- Figure 3: Asia Pacific Bulletproof Glass Industry Revenue Share (%), by Type 2025 & 2033
- Figure 4: Asia Pacific Bulletproof Glass Industry Revenue (billion), by End-user Industry 2025 & 2033
- Figure 5: Asia Pacific Bulletproof Glass Industry Revenue Share (%), by End-user Industry 2025 & 2033
- Figure 6: Asia Pacific Bulletproof Glass Industry Revenue (billion), by Country 2025 & 2033
- Figure 7: Asia Pacific Bulletproof Glass Industry Revenue Share (%), by Country 2025 & 2033
- Figure 8: North America Bulletproof Glass Industry Revenue (billion), by Type 2025 & 2033
- Figure 9: North America Bulletproof Glass Industry Revenue Share (%), by Type 2025 & 2033
- Figure 10: North America Bulletproof Glass Industry Revenue (billion), by End-user Industry 2025 & 2033
- Figure 11: North America Bulletproof Glass Industry Revenue Share (%), by End-user Industry 2025 & 2033
- Figure 12: North America Bulletproof Glass Industry Revenue (billion), by Country 2025 & 2033
- Figure 13: North America Bulletproof Glass Industry Revenue Share (%), by Country 2025 & 2033
- Figure 14: Europe Bulletproof Glass Industry Revenue (billion), by Type 2025 & 2033
- Figure 15: Europe Bulletproof Glass Industry Revenue Share (%), by Type 2025 & 2033
- Figure 16: Europe Bulletproof Glass Industry Revenue (billion), by End-user Industry 2025 & 2033
- Figure 17: Europe Bulletproof Glass Industry Revenue Share (%), by End-user Industry 2025 & 2033
- Figure 18: Europe Bulletproof Glass Industry Revenue (billion), by Country 2025 & 2033
- Figure 19: Europe Bulletproof Glass Industry Revenue Share (%), by Country 2025 & 2033
- Figure 20: South America Bulletproof Glass Industry Revenue (billion), by Type 2025 & 2033
- Figure 21: South America Bulletproof Glass Industry Revenue Share (%), by Type 2025 & 2033
- Figure 22: South America Bulletproof Glass Industry Revenue (billion), by End-user Industry 2025 & 2033
- Figure 23: South America Bulletproof Glass Industry Revenue Share (%), by End-user Industry 2025 & 2033
- Figure 24: South America Bulletproof Glass Industry Revenue (billion), by Country 2025 & 2033
- Figure 25: South America Bulletproof Glass Industry Revenue Share (%), by Country 2025 & 2033
- Figure 26: Middle East Bulletproof Glass Industry Revenue (billion), by Type 2025 & 2033
- Figure 27: Middle East Bulletproof Glass Industry Revenue Share (%), by Type 2025 & 2033
- Figure 28: Middle East Bulletproof Glass Industry Revenue (billion), by End-user Industry 2025 & 2033
- Figure 29: Middle East Bulletproof Glass Industry Revenue Share (%), by End-user Industry 2025 & 2033
- Figure 30: Middle East Bulletproof Glass Industry Revenue (billion), by Country 2025 & 2033
- Figure 31: Middle East Bulletproof Glass Industry Revenue Share (%), by Country 2025 & 2033
- Figure 32: Saudi Arabia Bulletproof Glass Industry Revenue (billion), by Type 2025 & 2033
- Figure 33: Saudi Arabia Bulletproof Glass Industry Revenue Share (%), by Type 2025 & 2033
- Figure 34: Saudi Arabia Bulletproof Glass Industry Revenue (billion), by End-user Industry 2025 & 2033
- Figure 35: Saudi Arabia Bulletproof Glass Industry Revenue Share (%), by End-user Industry 2025 & 2033
- Figure 36: Saudi Arabia Bulletproof Glass Industry Revenue (billion), by Country 2025 & 2033
- Figure 37: Saudi Arabia Bulletproof Glass Industry Revenue Share (%), by Country 2025 & 2033
List of Tables
- Table 1: Global Bulletproof Glass Industry Revenue billion Forecast, by Type 2020 & 2033
- Table 2: Global Bulletproof Glass Industry Revenue billion Forecast, by End-user Industry 2020 & 2033
- Table 3: Global Bulletproof Glass Industry Revenue billion Forecast, by Region 2020 & 2033
- Table 4: Global Bulletproof Glass Industry Revenue billion Forecast, by Type 2020 & 2033
- Table 5: Global Bulletproof Glass Industry Revenue billion Forecast, by End-user Industry 2020 & 2033
- Table 6: Global Bulletproof Glass Industry Revenue billion Forecast, by Country 2020 & 2033
- Table 7: China Bulletproof Glass Industry Revenue (billion) Forecast, by Application 2020 & 2033
- Table 8: India Bulletproof Glass Industry Revenue (billion) Forecast, by Application 2020 & 2033
- Table 9: Japan Bulletproof Glass Industry Revenue (billion) Forecast, by Application 2020 & 2033
- Table 10: South Korea Bulletproof Glass Industry Revenue (billion) Forecast, by Application 2020 & 2033
- Table 11: Rest of Asia Pacific Bulletproof Glass Industry Revenue (billion) Forecast, by Application 2020 & 2033
- Table 12: Global Bulletproof Glass Industry Revenue billion Forecast, by Type 2020 & 2033
- Table 13: Global Bulletproof Glass Industry Revenue billion Forecast, by End-user Industry 2020 & 2033
- Table 14: Global Bulletproof Glass Industry Revenue billion Forecast, by Country 2020 & 2033
- Table 15: United States Bulletproof Glass Industry Revenue (billion) Forecast, by Application 2020 & 2033
- Table 16: Canada Bulletproof Glass Industry Revenue (billion) Forecast, by Application 2020 & 2033
- Table 17: Mexico Bulletproof Glass Industry Revenue (billion) Forecast, by Application 2020 & 2033
- Table 18: Global Bulletproof Glass Industry Revenue billion Forecast, by Type 2020 & 2033
- Table 19: Global Bulletproof Glass Industry Revenue billion Forecast, by End-user Industry 2020 & 2033
- Table 20: Global Bulletproof Glass Industry Revenue billion Forecast, by Country 2020 & 2033
- Table 21: Germany Bulletproof Glass Industry Revenue (billion) Forecast, by Application 2020 & 2033
- Table 22: United Kingdom Bulletproof Glass Industry Revenue (billion) Forecast, by Application 2020 & 2033
- Table 23: France Bulletproof Glass Industry Revenue (billion) Forecast, by Application 2020 & 2033
- Table 24: Italy Bulletproof Glass Industry Revenue (billion) Forecast, by Application 2020 & 2033
- Table 25: Rest of Europe Bulletproof Glass Industry Revenue (billion) Forecast, by Application 2020 & 2033
- Table 26: Global Bulletproof Glass Industry Revenue billion Forecast, by Type 2020 & 2033
- Table 27: Global Bulletproof Glass Industry Revenue billion Forecast, by End-user Industry 2020 & 2033
- Table 28: Global Bulletproof Glass Industry Revenue billion Forecast, by Country 2020 & 2033
- Table 29: Brazil Bulletproof Glass Industry Revenue (billion) Forecast, by Application 2020 & 2033
- Table 30: Argentina Bulletproof Glass Industry Revenue (billion) Forecast, by Application 2020 & 2033
- Table 31: Rest of South America Bulletproof Glass Industry Revenue (billion) Forecast, by Application 2020 & 2033
- Table 32: Global Bulletproof Glass Industry Revenue billion Forecast, by Type 2020 & 2033
- Table 33: Global Bulletproof Glass Industry Revenue billion Forecast, by End-user Industry 2020 & 2033
- Table 34: Global Bulletproof Glass Industry Revenue billion Forecast, by Country 2020 & 2033
- Table 35: Global Bulletproof Glass Industry Revenue billion Forecast, by Type 2020 & 2033
- Table 36: Global Bulletproof Glass Industry Revenue billion Forecast, by End-user Industry 2020 & 2033
- Table 37: Global Bulletproof Glass Industry Revenue billion Forecast, by Country 2020 & 2033
- Table 38: South Africa Bulletproof Glass Industry Revenue (billion) Forecast, by Application 2020 & 2033
- Table 39: Rest of Middle East Bulletproof Glass Industry Revenue (billion) Forecast, by Application 2020 & 2033
Frequently Asked Questions
1. What is the projected Compound Annual Growth Rate (CAGR) of the Bulletproof Glass Industry?
The projected CAGR is approximately 11.78%.
2. Which companies are prominent players in the Bulletproof Glass Industry?
Key companies in the market include Total Security Solutions*List Not Exhaustive, Nippon Sheet Glass Co Ltd, Fuyao Glass America, Saint-Gobain, Taiwan Glass Ind Corp, Armortex, Centigon Security Group, Guardian Industries Holdings, Asahi India Glass Limited, Armass glass, STEC ARMOUR GLASS, Consolidated Glass Holdings Inc, Binswanger Glass, Guangdong Golden Glass Technologies Limited, SCHOTT AG.
3. What are the main segments of the Bulletproof Glass Industry?
The market segments include Type, End-user Industry.
4. Can you provide details about the market size?
The market size is estimated to be USD 10.83 billion as of 2022.
5. What are some drivers contributing to market growth?
High Military Spending; Increased Development and Construction Activity.
6. What are the notable trends driving market growth?
Increasing Demand from Defense Sector to Dominate the Market.
7. Are there any restraints impacting market growth?
High-end pricing of Raw Materials.
8. Can you provide examples of recent developments in the market?
January 2023: Asahi India Glass Limited announced its collaboration with Enormous Brands to create brand films for its complete doors and windows solutions brand, AIS Windows. With this collaboration, AIS Windows is aiming to make a large impact in the doors and windows segment.
9. What pricing options are available for accessing the report?
Pricing options include single-user, multi-user, and enterprise licenses priced at USD 4750, USD 5250, and USD 8750 respectively.
10. Is the market size provided in terms of value or volume?
The market size is provided in terms of value, measured in billion.
11. Are there any specific market keywords associated with the report?
Yes, the market keyword associated with the report is "Bulletproof Glass Industry," which aids in identifying and referencing the specific market segment covered.
12. How do I determine which pricing option suits my needs best?
The pricing options vary based on user requirements and access needs. Individual users may opt for single-user licenses, while businesses requiring broader access may choose multi-user or enterprise licenses for cost-effective access to the report.
13. Are there any additional resources or data provided in the Bulletproof Glass Industry report?
While the report offers comprehensive insights, it's advisable to review the specific contents or supplementary materials provided to ascertain if additional resources or data are available.
14. How can I stay updated on further developments or reports in the Bulletproof Glass Industry?
To stay informed about further developments, trends, and reports in the Bulletproof Glass Industry, consider subscribing to industry newsletters, following relevant companies and organizations, or regularly checking reputable industry news sources and publications.
Methodology
Step 1 - Identification of Relevant Samples Size from Population Database


Step 2 - Approaches for Defining Global Market Size (Value, Volume* & Price*)

Note*: In applicable scenarios
Step 3 - Data Sources
Primary Research
- Web Analytics
- Survey Reports
- Research Institute
- Latest Research Reports
- Opinion Leaders
Secondary Research
- Annual Reports
- White Paper
- Latest Press Release
- Industry Association
- Paid Database
- Investor Presentations

Step 4 - Data Triangulation
Involves using different sources of information in order to increase the validity of a study
These sources are likely to be stakeholders in a program - participants, other researchers, program staff, other community members, and so on.
Then we put all data in single framework & apply various statistical tools to find out the dynamic on the market.
During the analysis stage, feedback from the stakeholder groups would be compared to determine areas of agreement as well as areas of divergence