

Key Insights
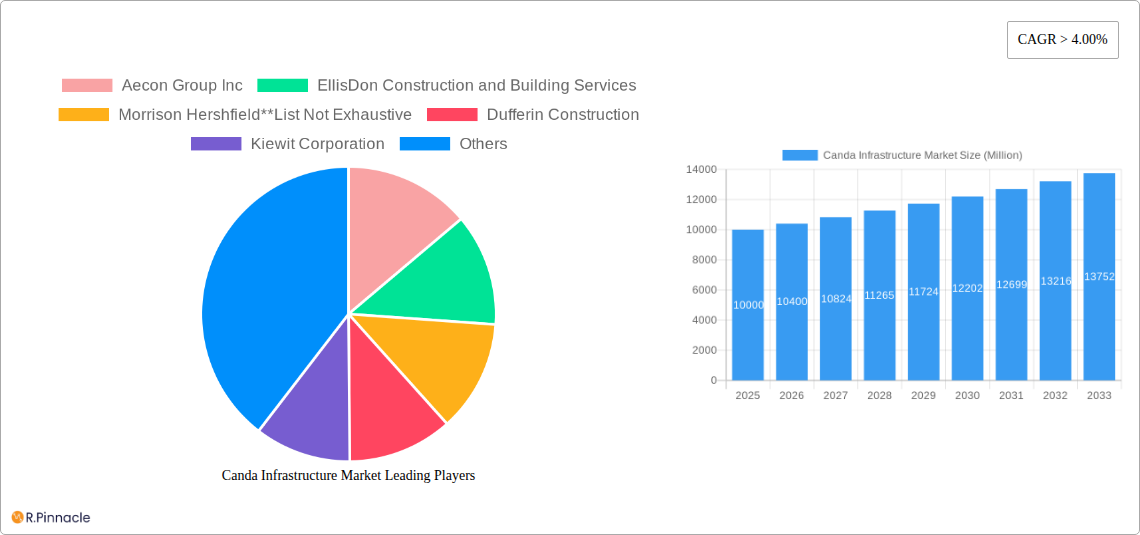
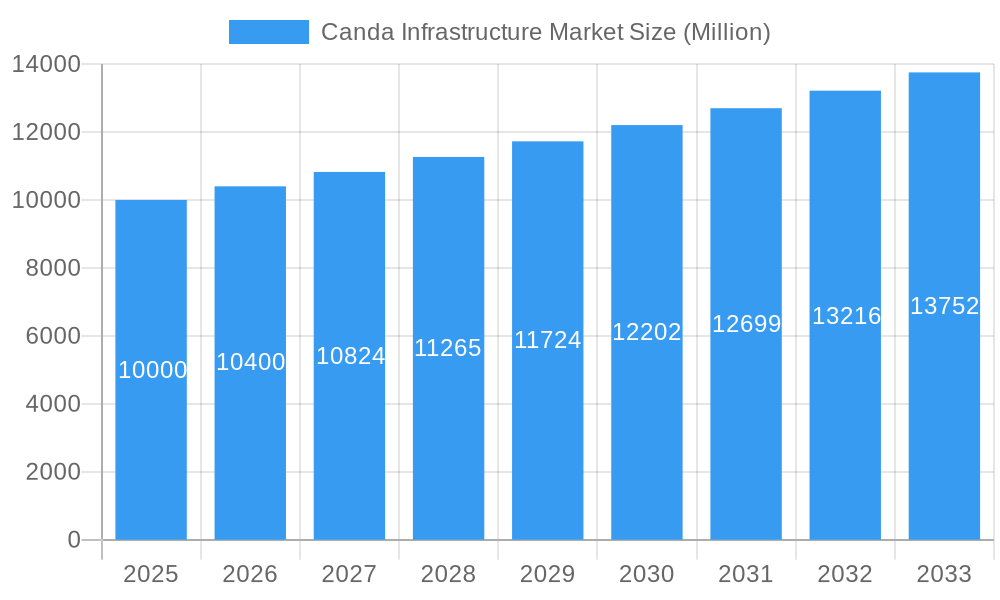
The Canadian infrastructure market is poised for substantial expansion, with a projected Compound Annual Growth Rate (CAGR) of 3.9% from 2025 to 2033. This growth is underpinned by strategic government investments in modernizing aging infrastructure, coupled with increasing urbanization and population density. Key drivers include the demand for enhanced transportation networks, such as roads, bridges, and public transit, aimed at improving connectivity and alleviating congestion in urban areas. The social infrastructure segment, encompassing healthcare facilities, educational institutions, and community centers, also shows consistent upward momentum due to demographic shifts and the imperative for upgraded public services. Furthermore, the water infrastructure sector presents significant investment opportunities driven by the pressing challenges of climate change and evolving water management needs, necessitating the adoption of sustainable solutions.
Canda Infrastructure Market Market Size (In Billion)
Key industry players, including Aecon Group Inc., EllisDon, and PCL Construction, are instrumental in steering market development through their extensive project portfolios and technical expertise. Competitive dynamics are intensifying, emphasizing the adoption of innovative construction methodologies and materials. The market's segmentation reveals its broad scope, with sub-sectors like telecommunications and extraction infrastructure contributing to its overall value. Technological advancements, such as Building Information Modeling (BIM) and the integration of sustainable construction practices, are expected to shape the industry's future. The Canadian government's promotion of public-private partnerships is anticipated to further catalyze market growth. By 2033, the Canadian infrastructure market is forecast to reach 222.11 billion, based on our analysis of current trends and growth trajectories.
Canda Infrastructure Market Company Market Share
Canada Infrastructure Market Report: 2019-2033
This comprehensive report provides an in-depth analysis of the Canada Infrastructure Market, offering invaluable insights for industry professionals, investors, and strategic planners. Covering the period from 2019 to 2033, with a focus on 2025, this report meticulously examines market dynamics, key players, and future growth potential. The report leverages extensive data and analysis to provide actionable intelligence, enabling informed decision-making within this dynamic sector.
Canada Infrastructure Market Structure & Innovation Trends
The Canadian infrastructure market exhibits a moderately concentrated structure, with several large players dominating specific segments. Market share data indicates that Aecon Group Inc, PCL Construction, and EllisDon Construction and Building Services hold significant portions of the market, although precise figures require further proprietary research. However, a considerable number of smaller, specialized firms also contribute significantly to the overall market.
Innovation within the sector is driven primarily by government initiatives promoting sustainable infrastructure and technological advancements in construction materials and project management. Stringent regulatory frameworks, such as environmental regulations and building codes, influence both innovation and market entry. The market witnesses ongoing M&A activity, with deal values fluctuating yearly. For example, the acquisition of Green Power Provider Tri Global by Enbridge in September 2022 for 270 Million dollars exemplifies the ongoing consolidation within the sector. Other notable M&A activities during the study period involve smaller firms seeking synergy and increased market share. Substitute products in the infrastructure space are limited, primarily impacting specific segments (e.g., alternative materials in construction). End-user demographics are broad, encompassing both public and private entities, with government spending significantly impacting market demand.
- Market Concentration: Moderately Concentrated
- Innovation Drivers: Government initiatives, technological advancements
- Regulatory Frameworks: Stringent environmental and building codes
- M&A Activity: Significant, with deal values varying annually (e.g., Enbridge acquisition in 2022 for 270 Million dollars)
- End-User Demographics: Public and private entities
Canada Infrastructure Market Dynamics & Trends
The Canadian infrastructure market exhibits robust growth, driven by significant government investments in transportation, water management, and social infrastructure projects. The compound annual growth rate (CAGR) during the historical period (2019-2024) is estimated at xx%, while the projected CAGR for the forecast period (2025-2033) is xx%. Technological disruptions, such as Building Information Modeling (BIM) and advanced construction techniques, are improving efficiency and reducing project timelines. However, challenges remain in successfully integrating new technologies across the sector. Consumer preferences are increasingly focused on sustainable and resilient infrastructure, demanding eco-friendly materials and innovative designs. Competitive dynamics are shaped by intense bidding processes, with firms focusing on project specialization, cost-effectiveness, and innovative solutions to secure contracts. Market penetration of new technologies varies depending on the specific infrastructure segment and project scale.
Dominant Regions & Segments in Canada Infrastructure Market
While precise data requires proprietary research, the Transportation Infrastructure segment is anticipated to be the most dominant sector within the Canadian infrastructure market. This is driven by significant government spending on road, rail, and airport projects across diverse regions. Ontario and British Columbia are likely to remain the leading provinces due to their large populations and ongoing infrastructural development needs. Provinces like Alberta might show substantial growth driven by energy infrastructure developments.
Key Drivers of Transportation Infrastructure Dominance:
- Large-scale government investments in road, rail, and airport projects
- Growing population and urbanization in major cities
- Increased demand for efficient transportation networks
Other Segments: Social Infrastructure (including healthcare and education), Waterways, and Extraction Infrastructure sectors also contribute significantly but are projected to experience a comparatively slower growth than transportation infrastructure. The Telecom and Manufacturing infrastructure segments are expected to exhibit moderate growth.
Canada Infrastructure Market Product Innovations
Recent product developments include the increased adoption of prefabricated construction methods, advanced materials like high-performance concrete and sustainable building materials. These innovations aim to enhance project efficiency, durability, and environmental sustainability. The competitive advantage often stems from the ability to integrate and deploy these innovative products effectively, ensuring cost-efficiency and project completion within the stipulated timeline. The market fit for these innovations depends on both client demand for sustainable solutions and the technical capabilities of individual firms.
Report Scope & Segmentation Analysis
This report segments the Canada Infrastructure Market by infrastructure type:
Social Infrastructure: This segment encompasses projects relating to healthcare facilities, educational institutions, and other social infrastructure assets. Growth is projected to be driven by increasing population and government investment in social programs. Market size is estimated to be xx Million in 2025, with xx% growth projected for the forecast period. Competition is expected to remain robust.
Transportation Infrastructure: This includes roads, railways, bridges, airports, and seaports. This segment is expected to experience the highest growth, primarily driven by significant government spending. The 2025 market size is estimated at xx Million with a projected growth of xx% for the forecast period. Competitive pressures are intense.
Waterways Infrastructure: This segment focuses on water management and treatment facilities. Growth will be moderate, influenced by climate change considerations and environmental regulations. Market size for 2025 is predicted at xx Million, with a projected growth of xx% for the forecast period.
Extraction Infrastructure: This segment encompasses projects related to oil and gas, mining, and other resource extraction activities. Growth will depend on the broader energy market and resource demand. The 2025 market size is estimated to be xx Million, with a projected growth rate of xx% during the forecast period.
Telecom Infrastructure: This segment includes cellular towers, fiber optic cables, and other communication infrastructure. Market growth will largely depend on technological advancements and communication network expansion. The 2025 market size is estimated at xx Million, with a xx% growth projection during the forecast period.
Manufacturing Infrastructure: This encompasses factories, plants, and industrial facilities. Market growth is anticipated to be driven by industrial expansion and automation. The 2025 market size is estimated at xx Million with a projected growth of xx% for the forecast period.
Key Drivers of Canada Infrastructure Market Growth
Government investments in infrastructure projects, both at the federal and provincial levels, are a key driver of market growth. Population growth and urbanization necessitate the expansion of transportation networks and social infrastructure. Technological advancements, such as BIM and prefabricated construction, improve efficiency and reduce project timelines. Furthermore, increasing emphasis on sustainable infrastructure and environmental regulations stimulate innovation and market expansion.
Challenges in the Canada Infrastructure Market Sector
Significant challenges include funding limitations, supply chain disruptions, and skilled labor shortages. These factors can lead to project delays and cost overruns. Strict environmental regulations and permitting processes can also create hurdles for project implementation. Competitive bidding can reduce profit margins, affecting the financial viability of projects.
Emerging Opportunities in Canada Infrastructure Market
The growing emphasis on sustainable infrastructure offers significant opportunities for companies offering eco-friendly solutions. Smart city initiatives and the adoption of digital technologies create opportunities for integrating technology in infrastructure projects. Furthermore, an aging population is driving a demand for improved healthcare and senior care infrastructure. The expansion of renewable energy infrastructure, spurred by climate change concerns, opens up new market avenues.
Leading Players in the Canada Infrastructure Market Market
- Aecon Group Inc
- EllisDon Construction and Building Services
- Morrison Hershfield
- Dufferin Construction
- Kiewit Corporation
- Pomerleau
- Chandos Construction
- Bantrel
- Bird Construction
- PCL Construction
Key Developments in Canada Infrastructure Market Industry
September 2022: Enbridge acquired U.S.-based renewable energy developer Tri Global for 270 Million dollars, strengthening its renewables portfolio and expanding into the renewable energy sector.
September 2022: WSP completed the acquisition of John Wood Group plc's environmental and infrastructure business, expanding its services in the ecological and water sectors.
Future Outlook for Canada Infrastructure Market Market
The Canadian infrastructure market is poised for continued growth, driven by ongoing government investments, population growth, and the increasing adoption of sustainable and smart technologies. Strategic opportunities lie in focusing on sustainable infrastructure solutions, leveraging digital technologies for project management, and specializing in niche areas within the broader infrastructure sector. The market is expected to witness increased consolidation, with larger firms acquiring smaller players to enhance their market share and service offerings.
Canda Infrastructure Market Segmentation
-
1. Infrastructure Segment
-
1.1. Social Infrastructure
- 1.1.1. Schools
- 1.1.2. Hospitals
- 1.1.3. Defense
- 1.1.4. Other Social Infrastructures
-
1.2. Transportation Infrastructure
- 1.2.1. Railways
- 1.2.2. Roadways
- 1.2.3. Airport
- 1.2.4. Waterways
-
1.3. Extraction Infrastructure
- 1.3.1. Power Generation
- 1.3.2. Electricity Transmission and Distribution
- 1.3.3. Gas
- 1.3.4. Telecom
-
1.4. Manufacturing Infrastructure
- 1.4.1. Metal and Ore Production
- 1.4.2. Petroleum Refining
- 1.4.3. Chemical Manufacturing
- 1.4.4. Industrial Parks and clusters
- 1.4.5. Other Manufacturing Infrastructures
-
1.1. Social Infrastructure
Canda Infrastructure Market Segmentation By Geography
-
1. North America
- 1.1. United States
- 1.2. Canada
- 1.3. Mexico
-
2. South America
- 2.1. Brazil
- 2.2. Argentina
- 2.3. Rest of South America
-
3. Europe
- 3.1. United Kingdom
- 3.2. Germany
- 3.3. France
- 3.4. Italy
- 3.5. Spain
- 3.6. Russia
- 3.7. Benelux
- 3.8. Nordics
- 3.9. Rest of Europe
-
4. Middle East & Africa
- 4.1. Turkey
- 4.2. Israel
- 4.3. GCC
- 4.4. North Africa
- 4.5. South Africa
- 4.6. Rest of Middle East & Africa
-
5. Asia Pacific
- 5.1. China
- 5.2. India
- 5.3. Japan
- 5.4. South Korea
- 5.5. ASEAN
- 5.6. Oceania
- 5.7. Rest of Asia Pacific
Canda Infrastructure Market Regional Market Share
Geographic Coverage of Canda Infrastructure Market
Canda Infrastructure Market REPORT HIGHLIGHTS
| Aspects | Details |
|---|---|
| Study Period | 2020-2034 |
| Base Year | 2025 |
| Estimated Year | 2026 |
| Forecast Period | 2026-2034 |
| Historical Period | 2020-2025 |
| Growth Rate | CAGR of 3.9% from 2020-2034 |
| Segmentation |
|
Table of Contents
- 1. Introduction
- 1.1. Research Scope
- 1.2. Market Segmentation
- 1.3. Research Objective
- 1.4. Definitions and Assumptions
- 2. Executive Summary
- 2.1. Market Snapshot
- 3. Market Dynamics
- 3.1. Market Drivers
- 3.2. Market Restrains
- 3.3. Market Trends
- 3.4. Market Opportunities
- 4. Market Factor Analysis
- 4.1. Porters Five Forces
- 4.1.1. Bargaining Power of Suppliers
- 4.1.2. Bargaining Power of Buyers
- 4.1.3. Threat of New Entrants
- 4.1.4. Threat of Substitutes
- 4.1.5. Competitive Rivalry
- 4.2. PESTEL analysis
- 4.3. BCG Analysis
- 4.3.1. Stars (High Growth, High Market Share)
- 4.3.2. Cash Cows (Low Growth, High Market Share)
- 4.3.3. Question Mark (High Growth, Low Market Share)
- 4.3.4. Dogs (Low Growth, Low Market Share)
- 4.4. Ansoff Matrix Analysis
- 4.5. Supply Chain Analysis
- 4.6. Regulatory Landscape
- 4.7. Current Market Potential and Opportunity Assessment (TAM–SAM–SOM Framework)
- 4.8. PRI Analyst Note
- 4.1. Porters Five Forces
- 5. Market Analysis, Insights and Forecast 2021-2033
- 5.1. Market Analysis, Insights and Forecast - by Infrastructure Segment
- 5.1.1. Social Infrastructure
- 5.1.1.1. Schools
- 5.1.1.2. Hospitals
- 5.1.1.3. Defense
- 5.1.1.4. Other Social Infrastructures
- 5.1.2. Transportation Infrastructure
- 5.1.2.1. Railways
- 5.1.2.2. Roadways
- 5.1.2.3. Airport
- 5.1.2.4. Waterways
- 5.1.3. Extraction Infrastructure
- 5.1.3.1. Power Generation
- 5.1.3.2. Electricity Transmission and Distribution
- 5.1.3.3. Gas
- 5.1.3.4. Telecom
- 5.1.4. Manufacturing Infrastructure
- 5.1.4.1. Metal and Ore Production
- 5.1.4.2. Petroleum Refining
- 5.1.4.3. Chemical Manufacturing
- 5.1.4.4. Industrial Parks and clusters
- 5.1.4.5. Other Manufacturing Infrastructures
- 5.1.1. Social Infrastructure
- 5.2. Market Analysis, Insights and Forecast - by Region
- 5.2.1. North America
- 5.2.2. South America
- 5.2.3. Europe
- 5.2.4. Middle East & Africa
- 5.2.5. Asia Pacific
- 5.1. Market Analysis, Insights and Forecast - by Infrastructure Segment
- 6. Global Canda Infrastructure Market Analysis, Insights and Forecast, 2021-2033
- 6.1. Market Analysis, Insights and Forecast - by Infrastructure Segment
- 6.1.1. Social Infrastructure
- 6.1.1.1. Schools
- 6.1.1.2. Hospitals
- 6.1.1.3. Defense
- 6.1.1.4. Other Social Infrastructures
- 6.1.2. Transportation Infrastructure
- 6.1.2.1. Railways
- 6.1.2.2. Roadways
- 6.1.2.3. Airport
- 6.1.2.4. Waterways
- 6.1.3. Extraction Infrastructure
- 6.1.3.1. Power Generation
- 6.1.3.2. Electricity Transmission and Distribution
- 6.1.3.3. Gas
- 6.1.3.4. Telecom
- 6.1.4. Manufacturing Infrastructure
- 6.1.4.1. Metal and Ore Production
- 6.1.4.2. Petroleum Refining
- 6.1.4.3. Chemical Manufacturing
- 6.1.4.4. Industrial Parks and clusters
- 6.1.4.5. Other Manufacturing Infrastructures
- 6.1.1. Social Infrastructure
- 6.1. Market Analysis, Insights and Forecast - by Infrastructure Segment
- 7. North America Canda Infrastructure Market Analysis, Insights and Forecast, 2020-2032
- 7.1. Market Analysis, Insights and Forecast - by Infrastructure Segment
- 7.1.1. Social Infrastructure
- 7.1.1.1. Schools
- 7.1.1.2. Hospitals
- 7.1.1.3. Defense
- 7.1.1.4. Other Social Infrastructures
- 7.1.2. Transportation Infrastructure
- 7.1.2.1. Railways
- 7.1.2.2. Roadways
- 7.1.2.3. Airport
- 7.1.2.4. Waterways
- 7.1.3. Extraction Infrastructure
- 7.1.3.1. Power Generation
- 7.1.3.2. Electricity Transmission and Distribution
- 7.1.3.3. Gas
- 7.1.3.4. Telecom
- 7.1.4. Manufacturing Infrastructure
- 7.1.4.1. Metal and Ore Production
- 7.1.4.2. Petroleum Refining
- 7.1.4.3. Chemical Manufacturing
- 7.1.4.4. Industrial Parks and clusters
- 7.1.4.5. Other Manufacturing Infrastructures
- 7.1.1. Social Infrastructure
- 7.1. Market Analysis, Insights and Forecast - by Infrastructure Segment
- 8. South America Canda Infrastructure Market Analysis, Insights and Forecast, 2020-2032
- 8.1. Market Analysis, Insights and Forecast - by Infrastructure Segment
- 8.1.1. Social Infrastructure
- 8.1.1.1. Schools
- 8.1.1.2. Hospitals
- 8.1.1.3. Defense
- 8.1.1.4. Other Social Infrastructures
- 8.1.2. Transportation Infrastructure
- 8.1.2.1. Railways
- 8.1.2.2. Roadways
- 8.1.2.3. Airport
- 8.1.2.4. Waterways
- 8.1.3. Extraction Infrastructure
- 8.1.3.1. Power Generation
- 8.1.3.2. Electricity Transmission and Distribution
- 8.1.3.3. Gas
- 8.1.3.4. Telecom
- 8.1.4. Manufacturing Infrastructure
- 8.1.4.1. Metal and Ore Production
- 8.1.4.2. Petroleum Refining
- 8.1.4.3. Chemical Manufacturing
- 8.1.4.4. Industrial Parks and clusters
- 8.1.4.5. Other Manufacturing Infrastructures
- 8.1.1. Social Infrastructure
- 8.1. Market Analysis, Insights and Forecast - by Infrastructure Segment
- 9. Europe Canda Infrastructure Market Analysis, Insights and Forecast, 2020-2032
- 9.1. Market Analysis, Insights and Forecast - by Infrastructure Segment
- 9.1.1. Social Infrastructure
- 9.1.1.1. Schools
- 9.1.1.2. Hospitals
- 9.1.1.3. Defense
- 9.1.1.4. Other Social Infrastructures
- 9.1.2. Transportation Infrastructure
- 9.1.2.1. Railways
- 9.1.2.2. Roadways
- 9.1.2.3. Airport
- 9.1.2.4. Waterways
- 9.1.3. Extraction Infrastructure
- 9.1.3.1. Power Generation
- 9.1.3.2. Electricity Transmission and Distribution
- 9.1.3.3. Gas
- 9.1.3.4. Telecom
- 9.1.4. Manufacturing Infrastructure
- 9.1.4.1. Metal and Ore Production
- 9.1.4.2. Petroleum Refining
- 9.1.4.3. Chemical Manufacturing
- 9.1.4.4. Industrial Parks and clusters
- 9.1.4.5. Other Manufacturing Infrastructures
- 9.1.1. Social Infrastructure
- 9.1. Market Analysis, Insights and Forecast - by Infrastructure Segment
- 10. Middle East & Africa Canda Infrastructure Market Analysis, Insights and Forecast, 2020-2032
- 10.1. Market Analysis, Insights and Forecast - by Infrastructure Segment
- 10.1.1. Social Infrastructure
- 10.1.1.1. Schools
- 10.1.1.2. Hospitals
- 10.1.1.3. Defense
- 10.1.1.4. Other Social Infrastructures
- 10.1.2. Transportation Infrastructure
- 10.1.2.1. Railways
- 10.1.2.2. Roadways
- 10.1.2.3. Airport
- 10.1.2.4. Waterways
- 10.1.3. Extraction Infrastructure
- 10.1.3.1. Power Generation
- 10.1.3.2. Electricity Transmission and Distribution
- 10.1.3.3. Gas
- 10.1.3.4. Telecom
- 10.1.4. Manufacturing Infrastructure
- 10.1.4.1. Metal and Ore Production
- 10.1.4.2. Petroleum Refining
- 10.1.4.3. Chemical Manufacturing
- 10.1.4.4. Industrial Parks and clusters
- 10.1.4.5. Other Manufacturing Infrastructures
- 10.1.1. Social Infrastructure
- 10.1. Market Analysis, Insights and Forecast - by Infrastructure Segment
- 11. Asia Pacific Canda Infrastructure Market Analysis, Insights and Forecast, 2020-2032
- 11.1. Market Analysis, Insights and Forecast - by Infrastructure Segment
- 11.1.1. Social Infrastructure
- 11.1.1.1. Schools
- 11.1.1.2. Hospitals
- 11.1.1.3. Defense
- 11.1.1.4. Other Social Infrastructures
- 11.1.2. Transportation Infrastructure
- 11.1.2.1. Railways
- 11.1.2.2. Roadways
- 11.1.2.3. Airport
- 11.1.2.4. Waterways
- 11.1.3. Extraction Infrastructure
- 11.1.3.1. Power Generation
- 11.1.3.2. Electricity Transmission and Distribution
- 11.1.3.3. Gas
- 11.1.3.4. Telecom
- 11.1.4. Manufacturing Infrastructure
- 11.1.4.1. Metal and Ore Production
- 11.1.4.2. Petroleum Refining
- 11.1.4.3. Chemical Manufacturing
- 11.1.4.4. Industrial Parks and clusters
- 11.1.4.5. Other Manufacturing Infrastructures
- 11.1.1. Social Infrastructure
- 11.1. Market Analysis, Insights and Forecast - by Infrastructure Segment
- 12. Competitive Analysis
- 12.1. Company Profiles
- 12.1.1 Aecon Group Inc
- 12.1.1.1. Company Overview
- 12.1.1.2. Products
- 12.1.1.3. Company Financials
- 12.1.1.4. SWOT Analysis
- 12.1.2 EllisDon Construction and Building Services
- 12.1.2.1. Company Overview
- 12.1.2.2. Products
- 12.1.2.3. Company Financials
- 12.1.2.4. SWOT Analysis
- 12.1.3 Morrison Hershfield**List Not Exhaustive
- 12.1.3.1. Company Overview
- 12.1.3.2. Products
- 12.1.3.3. Company Financials
- 12.1.3.4. SWOT Analysis
- 12.1.4 Dufferin Construction
- 12.1.4.1. Company Overview
- 12.1.4.2. Products
- 12.1.4.3. Company Financials
- 12.1.4.4. SWOT Analysis
- 12.1.5 Kiewit Corporation
- 12.1.5.1. Company Overview
- 12.1.5.2. Products
- 12.1.5.3. Company Financials
- 12.1.5.4. SWOT Analysis
- 12.1.6 Pomerleau
- 12.1.6.1. Company Overview
- 12.1.6.2. Products
- 12.1.6.3. Company Financials
- 12.1.6.4. SWOT Analysis
- 12.1.7 Chandos Construction
- 12.1.7.1. Company Overview
- 12.1.7.2. Products
- 12.1.7.3. Company Financials
- 12.1.7.4. SWOT Analysis
- 12.1.8 Bantrel
- 12.1.8.1. Company Overview
- 12.1.8.2. Products
- 12.1.8.3. Company Financials
- 12.1.8.4. SWOT Analysis
- 12.1.9 Bird Construction
- 12.1.9.1. Company Overview
- 12.1.9.2. Products
- 12.1.9.3. Company Financials
- 12.1.9.4. SWOT Analysis
- 12.1.10 PCL Construction
- 12.1.10.1. Company Overview
- 12.1.10.2. Products
- 12.1.10.3. Company Financials
- 12.1.10.4. SWOT Analysis
- 12.1.1 Aecon Group Inc
- 12.2. Market Entropy
- 12.2.1 Company's Key Areas Served
- 12.2.2 Recent Developments
- 12.3. Company Market Share Analysis 2025
- 12.3.1 Top 5 Companies Market Share Analysis
- 12.3.2 Top 3 Companies Market Share Analysis
- 12.4. List of Potential Customers
- 13. Research Methodology
List of Figures
- Figure 1: Global Canda Infrastructure Market Revenue Breakdown (billion, %) by Region 2025 & 2033
- Figure 2: North America Canda Infrastructure Market Revenue (billion), by Infrastructure Segment 2025 & 2033
- Figure 3: North America Canda Infrastructure Market Revenue Share (%), by Infrastructure Segment 2025 & 2033
- Figure 4: North America Canda Infrastructure Market Revenue (billion), by Country 2025 & 2033
- Figure 5: North America Canda Infrastructure Market Revenue Share (%), by Country 2025 & 2033
- Figure 6: South America Canda Infrastructure Market Revenue (billion), by Infrastructure Segment 2025 & 2033
- Figure 7: South America Canda Infrastructure Market Revenue Share (%), by Infrastructure Segment 2025 & 2033
- Figure 8: South America Canda Infrastructure Market Revenue (billion), by Country 2025 & 2033
- Figure 9: South America Canda Infrastructure Market Revenue Share (%), by Country 2025 & 2033
- Figure 10: Europe Canda Infrastructure Market Revenue (billion), by Infrastructure Segment 2025 & 2033
- Figure 11: Europe Canda Infrastructure Market Revenue Share (%), by Infrastructure Segment 2025 & 2033
- Figure 12: Europe Canda Infrastructure Market Revenue (billion), by Country 2025 & 2033
- Figure 13: Europe Canda Infrastructure Market Revenue Share (%), by Country 2025 & 2033
- Figure 14: Middle East & Africa Canda Infrastructure Market Revenue (billion), by Infrastructure Segment 2025 & 2033
- Figure 15: Middle East & Africa Canda Infrastructure Market Revenue Share (%), by Infrastructure Segment 2025 & 2033
- Figure 16: Middle East & Africa Canda Infrastructure Market Revenue (billion), by Country 2025 & 2033
- Figure 17: Middle East & Africa Canda Infrastructure Market Revenue Share (%), by Country 2025 & 2033
- Figure 18: Asia Pacific Canda Infrastructure Market Revenue (billion), by Infrastructure Segment 2025 & 2033
- Figure 19: Asia Pacific Canda Infrastructure Market Revenue Share (%), by Infrastructure Segment 2025 & 2033
- Figure 20: Asia Pacific Canda Infrastructure Market Revenue (billion), by Country 2025 & 2033
- Figure 21: Asia Pacific Canda Infrastructure Market Revenue Share (%), by Country 2025 & 2033
List of Tables
- Table 1: Global Canda Infrastructure Market Revenue billion Forecast, by Infrastructure Segment 2020 & 2033
- Table 2: Global Canda Infrastructure Market Revenue billion Forecast, by Region 2020 & 2033
- Table 3: Global Canda Infrastructure Market Revenue billion Forecast, by Infrastructure Segment 2020 & 2033
- Table 4: Global Canda Infrastructure Market Revenue billion Forecast, by Country 2020 & 2033
- Table 5: United States Canda Infrastructure Market Revenue (billion) Forecast, by Application 2020 & 2033
- Table 6: Canada Canda Infrastructure Market Revenue (billion) Forecast, by Application 2020 & 2033
- Table 7: Mexico Canda Infrastructure Market Revenue (billion) Forecast, by Application 2020 & 2033
- Table 8: Global Canda Infrastructure Market Revenue billion Forecast, by Infrastructure Segment 2020 & 2033
- Table 9: Global Canda Infrastructure Market Revenue billion Forecast, by Country 2020 & 2033
- Table 10: Brazil Canda Infrastructure Market Revenue (billion) Forecast, by Application 2020 & 2033
- Table 11: Argentina Canda Infrastructure Market Revenue (billion) Forecast, by Application 2020 & 2033
- Table 12: Rest of South America Canda Infrastructure Market Revenue (billion) Forecast, by Application 2020 & 2033
- Table 13: Global Canda Infrastructure Market Revenue billion Forecast, by Infrastructure Segment 2020 & 2033
- Table 14: Global Canda Infrastructure Market Revenue billion Forecast, by Country 2020 & 2033
- Table 15: United Kingdom Canda Infrastructure Market Revenue (billion) Forecast, by Application 2020 & 2033
- Table 16: Germany Canda Infrastructure Market Revenue (billion) Forecast, by Application 2020 & 2033
- Table 17: France Canda Infrastructure Market Revenue (billion) Forecast, by Application 2020 & 2033
- Table 18: Italy Canda Infrastructure Market Revenue (billion) Forecast, by Application 2020 & 2033
- Table 19: Spain Canda Infrastructure Market Revenue (billion) Forecast, by Application 2020 & 2033
- Table 20: Russia Canda Infrastructure Market Revenue (billion) Forecast, by Application 2020 & 2033
- Table 21: Benelux Canda Infrastructure Market Revenue (billion) Forecast, by Application 2020 & 2033
- Table 22: Nordics Canda Infrastructure Market Revenue (billion) Forecast, by Application 2020 & 2033
- Table 23: Rest of Europe Canda Infrastructure Market Revenue (billion) Forecast, by Application 2020 & 2033
- Table 24: Global Canda Infrastructure Market Revenue billion Forecast, by Infrastructure Segment 2020 & 2033
- Table 25: Global Canda Infrastructure Market Revenue billion Forecast, by Country 2020 & 2033
- Table 26: Turkey Canda Infrastructure Market Revenue (billion) Forecast, by Application 2020 & 2033
- Table 27: Israel Canda Infrastructure Market Revenue (billion) Forecast, by Application 2020 & 2033
- Table 28: GCC Canda Infrastructure Market Revenue (billion) Forecast, by Application 2020 & 2033
- Table 29: North Africa Canda Infrastructure Market Revenue (billion) Forecast, by Application 2020 & 2033
- Table 30: South Africa Canda Infrastructure Market Revenue (billion) Forecast, by Application 2020 & 2033
- Table 31: Rest of Middle East & Africa Canda Infrastructure Market Revenue (billion) Forecast, by Application 2020 & 2033
- Table 32: Global Canda Infrastructure Market Revenue billion Forecast, by Infrastructure Segment 2020 & 2033
- Table 33: Global Canda Infrastructure Market Revenue billion Forecast, by Country 2020 & 2033
- Table 34: China Canda Infrastructure Market Revenue (billion) Forecast, by Application 2020 & 2033
- Table 35: India Canda Infrastructure Market Revenue (billion) Forecast, by Application 2020 & 2033
- Table 36: Japan Canda Infrastructure Market Revenue (billion) Forecast, by Application 2020 & 2033
- Table 37: South Korea Canda Infrastructure Market Revenue (billion) Forecast, by Application 2020 & 2033
- Table 38: ASEAN Canda Infrastructure Market Revenue (billion) Forecast, by Application 2020 & 2033
- Table 39: Oceania Canda Infrastructure Market Revenue (billion) Forecast, by Application 2020 & 2033
- Table 40: Rest of Asia Pacific Canda Infrastructure Market Revenue (billion) Forecast, by Application 2020 & 2033
Frequently Asked Questions
1. What is the projected Compound Annual Growth Rate (CAGR) of the Canda Infrastructure Market?
The projected CAGR is approximately 3.9%.
2. Which companies are prominent players in the Canda Infrastructure Market?
Key companies in the market include Aecon Group Inc, EllisDon Construction and Building Services, Morrison Hershfield**List Not Exhaustive, Dufferin Construction, Kiewit Corporation, Pomerleau, Chandos Construction, Bantrel, Bird Construction, PCL Construction.
3. What are the main segments of the Canda Infrastructure Market?
The market segments include Infrastructure Segment.
4. Can you provide details about the market size?
The market size is estimated to be USD 222.11 billion as of 2022.
5. What are some drivers contributing to market growth?
Increasing Investment in Infrastructure Projects; The rising popularity of sustainable architecture.
6. What are the notable trends driving market growth?
Growth in Transportation Infrastructure.
7. Are there any restraints impacting market growth?
Volatility in Raw material prices.
8. Can you provide examples of recent developments in the market?
September 2022: Canada's Enbridge acquired U.S.-based renewable energy developer Green Power Provider Tri Global for 270 Million dollars. The deal strengthens Enbridge's renewables portfolio, including offshore wind farms in Europe and solar projects supplying power to its oil and gas pipelines in North America.
9. What pricing options are available for accessing the report?
Pricing options include single-user, multi-user, and enterprise licenses priced at USD 3800, USD 4500, and USD 5800 respectively.
10. Is the market size provided in terms of value or volume?
The market size is provided in terms of value, measured in billion.
11. Are there any specific market keywords associated with the report?
Yes, the market keyword associated with the report is "Canda Infrastructure Market," which aids in identifying and referencing the specific market segment covered.
12. How do I determine which pricing option suits my needs best?
The pricing options vary based on user requirements and access needs. Individual users may opt for single-user licenses, while businesses requiring broader access may choose multi-user or enterprise licenses for cost-effective access to the report.
13. Are there any additional resources or data provided in the Canda Infrastructure Market report?
While the report offers comprehensive insights, it's advisable to review the specific contents or supplementary materials provided to ascertain if additional resources or data are available.
14. How can I stay updated on further developments or reports in the Canda Infrastructure Market?
To stay informed about further developments, trends, and reports in the Canda Infrastructure Market, consider subscribing to industry newsletters, following relevant companies and organizations, or regularly checking reputable industry news sources and publications.
Methodology
Step 1 - Identification of Relevant Samples Size from Population Database


Step 2 - Approaches for Defining Global Market Size (Value, Volume* & Price*)

Note*: In applicable scenarios
Step 3 - Data Sources
Primary Research
- Web Analytics
- Survey Reports
- Research Institute
- Latest Research Reports
- Opinion Leaders
Secondary Research
- Annual Reports
- White Paper
- Latest Press Release
- Industry Association
- Paid Database
- Investor Presentations

Step 4 - Data Triangulation
Involves using different sources of information in order to increase the validity of a study
These sources are likely to be stakeholders in a program - participants, other researchers, program staff, other community members, and so on.
Then we put all data in single framework & apply various statistical tools to find out the dynamic on the market.
During the analysis stage, feedback from the stakeholder groups would be compared to determine areas of agreement as well as areas of divergence