

Key Insights
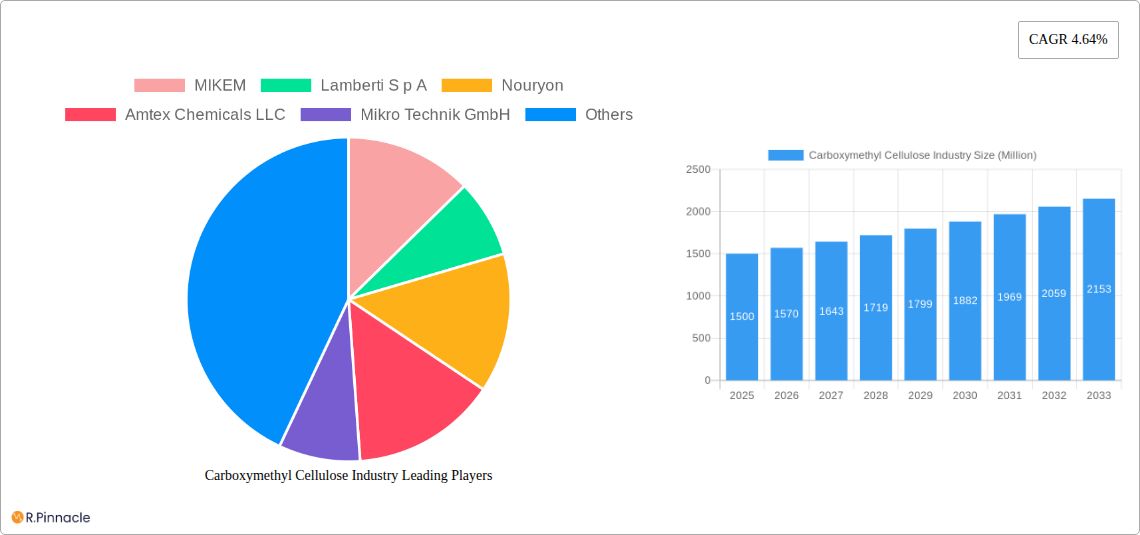
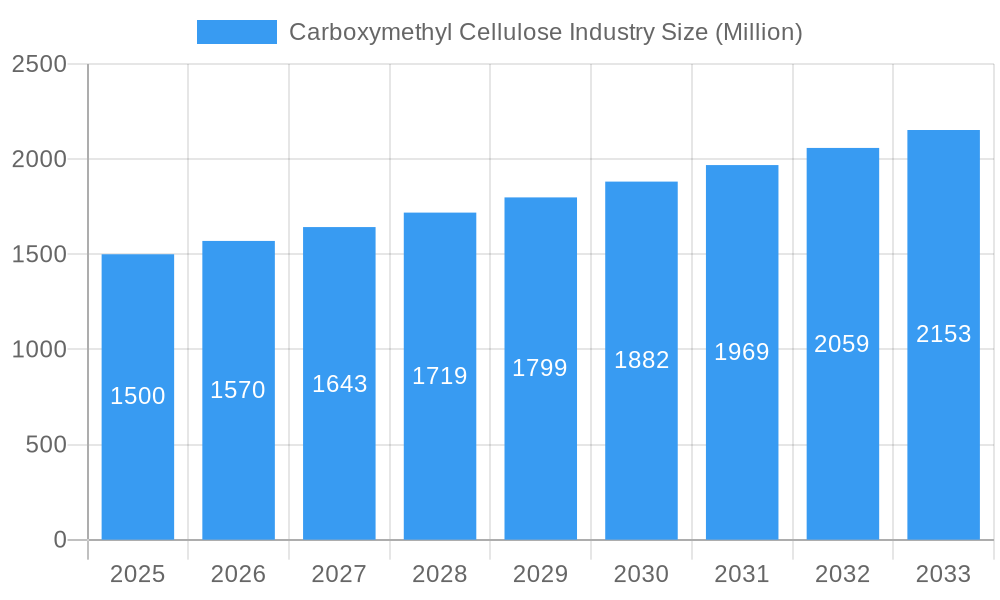
The global carboxymethyl cellulose (CMC) market, valued at $1.5 billion in 2025, is projected to experience robust growth, driven by a compound annual growth rate (CAGR) of 4.64% from 2025 to 2033. This expansion is fueled by increasing demand across diverse sectors. The food and beverage industry utilizes CMC as a thickener, stabilizer, and emulsifier, while the oil and gas sector employs it in drilling fluids. Growth in the cosmetics and pharmaceuticals industries, where CMC serves as a binder and rheology modifier, also contributes significantly. Furthermore, the detergents and paper processing sectors rely heavily on CMC's properties for improved performance. The high-purity grade segment commands a premium price due to its stringent quality requirements, particularly in pharmaceutical applications. While the industrial grade segment holds the largest volume share due to its widespread use in various applications, the technical grade segment bridges the gap between purity and cost-effectiveness. Regional market variations exist, with North America and Europe holding significant market shares due to established industries and regulatory frameworks. However, the Asia-Pacific region is expected to witness the most substantial growth in the forecast period, driven by burgeoning industries and increasing disposable income in developing economies. Competitive landscape analysis reveals a mix of established multinational corporations and regional players, leading to intense competition and driving innovation in product development and application expansion.
Carboxymethyl Cellulose Industry Market Size (In Billion)
The market faces certain restraints, primarily fluctuating raw material prices (cellulose and caustic soda) and potential environmental concerns regarding the production and disposal of CMC. However, ongoing research and development into sustainable manufacturing processes and the exploration of biodegradable alternatives are mitigating these challenges. Future market trends point towards increased demand for customized CMC solutions tailored to specific applications and heightened focus on sustainability initiatives. This includes the development of bio-based CMC derived from renewable sources to meet the growing environmental awareness and regulations. The market's expansion will also be influenced by technological advancements in CMC production, leading to greater efficiency and cost-effectiveness, further solidifying its position across numerous industries. The forecast period is expected to witness a significant increase in market size, exceeding $2 billion by 2033, driven by the factors mentioned above.
Carboxymethyl Cellulose Industry Company Market Share
Carboxymethyl Cellulose (CMC) Industry Report: 2019-2033
This comprehensive report provides an in-depth analysis of the global Carboxymethyl Cellulose (CMC) industry, offering actionable insights for industry professionals, investors, and stakeholders. The report covers the period from 2019 to 2033, with a focus on the forecast period of 2025-2033 and a base year of 2025. The global market size is expected to reach xx Million by 2033.
Carboxymethyl Cellulose Industry Market Structure & Innovation Trends
This section analyzes the competitive landscape, innovation drivers, and regulatory influences within the CMC industry. The market is moderately concentrated, with key players like Ashland, DuPont, and Nouryon holding significant market share. However, several regional players are emerging, contributing to a dynamic competitive environment.
- Market Concentration: The top 5 players collectively hold an estimated xx% market share in 2025, indicating a moderately concentrated market. However, the presence of numerous smaller regional players prevents complete market dominance by any single entity.
- Innovation Drivers: R&D efforts are focused on developing high-purity CMC grades for specialized applications such as pharmaceuticals and cosmetics. Sustainable and bio-based CMC production methods are also driving innovation.
- Regulatory Frameworks: Stringent regulations related to food safety and environmental impact are influencing the production and application of CMC. Compliance costs and sustainable sourcing are significant considerations for manufacturers.
- Product Substitutes: Several natural and synthetic polymers act as substitutes for CMC, depending on the application. Competition from these substitutes influences pricing and market share.
- M&A Activities: The industry has witnessed several mergers and acquisitions (M&A) in recent years, with deal values reaching xx Million in aggregate between 2019-2024. These activities reflect the consolidation trend and strategic expansion by major players. For example, the recent establishment of SUNROSE MAC by Nippon Paper Industries in 2023 signifies strategic expansion in Europe.
- End-User Demographics: The end-user base is diverse, spanning various industries, including food & beverage, oil & gas, pharmaceuticals, and paper processing. Each segment presents unique demand characteristics, influencing product specifications and market pricing.
Carboxymethyl Cellulose Industry Market Dynamics & Trends
The global CMC market is projected to experience significant growth throughout the forecast period (2025-2033), driven by increasing demand from various end-use sectors. The Compound Annual Growth Rate (CAGR) is estimated at xx% during this period. Several factors contribute to this growth, including rising consumer demand for processed food products, expanding pharmaceutical industries, and the increasing application of CMC in oil & gas operations. Technological advancements in CMC production, leading to improved product quality and reduced costs, are also supporting market expansion. However, fluctuating raw material prices and economic downturns pose potential challenges to sustained growth. Market penetration in emerging economies is expected to increase, driving overall market expansion.
Dominant Regions & Segments in Carboxymethyl Cellulose Industry
Asia-Pacific is currently the leading region for CMC consumption, driven by strong demand from China and India, particularly in the food and beverage and paper processing sectors. Within the different grades, High Purity Grade (99.5%+) commands a premium price and holds a significant market share in specialized applications like pharmaceuticals. Similarly, the Industrial Grade (50-90%) segment enjoys high volume demand due to its cost-effectiveness and suitability for various industrial processes.
Key Drivers in Asia-Pacific:
- Rapid economic growth and industrialization
- Increasing disposable incomes and changing consumer preferences
- Government initiatives to promote industrial development
- Abundant raw material availability
Grade Dominance:
- High Purity Grade (99.5%+) is leading in pharmaceuticals and high-value applications.
- Industrial Grade (50-90%) dominates in volume-driven segments like detergents and paper processing.
Application Dominance:
- Food and Beverage: High demand for processed foods drives growth in this segment.
- Paper Processing: CMC is a crucial additive for paper manufacturing, leading to significant demand.
Carboxymethyl Cellulose Industry Product Innovations
Recent product innovations focus on enhancing the functional properties of CMC, such as improved viscosity, stability, and biodegradability. This is achieved through modifications in the production process and the introduction of novel CMC derivatives. These innovations are meeting the growing demand for high-performance CMC in specific applications, widening the market reach and offering competitive advantages.
Report Scope & Segmentation Analysis
This report segments the CMC market based on grade (High Purity Grade, Technical Grade, Industrial Grade) and application (Food and Beverages, Oil and Gas, Cosmetics and Pharmaceuticals, Detergents, Paper Processing, Other Applications). Each segment's growth projection, market size, and competitive dynamics are analyzed in detail. The report projects significant growth for the High Purity Grade segment driven by increasing demand from the pharmaceutical industry.
Key Drivers of Carboxymethyl Cellulose Industry Growth
Several factors drive CMC industry growth, including:
- Growing Demand from End-Use Sectors: Increased consumption of processed food, personal care products, and industrial goods fuels demand for CMC.
- Technological Advancements: Innovations in CMC production lead to improved efficiency, reduced costs, and enhanced product quality.
- Favorable Government Policies: Support for the chemical industry in several regions encourages market expansion.
Challenges in the Carboxymethyl Cellulose Industry Sector
The CMC industry faces several challenges, including:
- Fluctuating Raw Material Prices: Variations in cotton prices, a primary raw material, affect production costs.
- Stringent Environmental Regulations: Compliance with environmental standards adds to operational costs.
- Intense Competition: Numerous producers compete for market share.
Emerging Opportunities in Carboxymethyl Cellulose Industry
Emerging opportunities include:
- Expanding Applications in Emerging Markets: Growth in developing economies presents significant market potential.
- Development of Bio-Based CMC: Sustainable production methods are gaining traction.
- Innovative Product Applications: CMC finds increasing use in advanced materials and technologies.
Leading Players in the Carboxymethyl Cellulose Industry Market
- MIKEM
- Lamberti S p A
- Nouryon
- Amtex Chemicals LLC
- Mikro Technik GmbH
- Jining Fortune Biotech Co Ltd
- Chongqing Lihong Fine Chemicals Co Ltd
- USK Rheology Solutions
- Ashland
- DKS Co Ltd
- DuPont
- Daicel Corporation
- Foodchem International Corporation
- Zibo Hailan Chemical Co Ltd
- NIPPON PAPER INDUSTRIES CO LTD
Key Developments in Carboxymethyl Cellulose Industry
- February 2023: Nippon Paper Industries Co., Ltd. established SUNROSE MAC, a manufacturing and sales subsidiary for CMC in Hungary, expanding its European supply chain.
Future Outlook for Carboxymethyl Cellulose Industry Market
The CMC market is poised for continued growth, driven by increasing demand from diverse sectors, technological advancements, and strategic expansions by major players. The focus on sustainable and high-performance CMC grades will shape future market dynamics. The industry is expected to experience a sustained period of growth with promising opportunities for innovation and market expansion.
Carboxymethyl Cellulose Industry Segmentation
-
1. Application
- 1.1. Food and Beverages
- 1.2. Oil and Gas
- 1.3. Cosmetics and Pharmaceuticals
- 1.4. Detergents
- 1.5. Paper Processing
- 1.6. Other Ap
Carboxymethyl Cellulose Industry Segmentation By Geography
-
1. Asia Pacific
- 1.1. China
- 1.2. India
- 1.3. Japan
- 1.4. South Korea
- 1.5. Rest of Asia Pacific
-
2. North America
- 2.1. United States
- 2.2. Canada
- 2.3. Mexico
-
3. Europe
- 3.1. Germany
- 3.2. United Kingdom
- 3.3. Italy
- 3.4. France
- 3.5. Rest of Europe
-
4. South America
- 4.1. Brazil
- 4.2. Argentina
- 4.3. Rest of South America
-
5. Middle East and Africa
- 5.1. Saudi Arabia
- 5.2. South Africa
- 5.3. Rest of Middle East and Africa
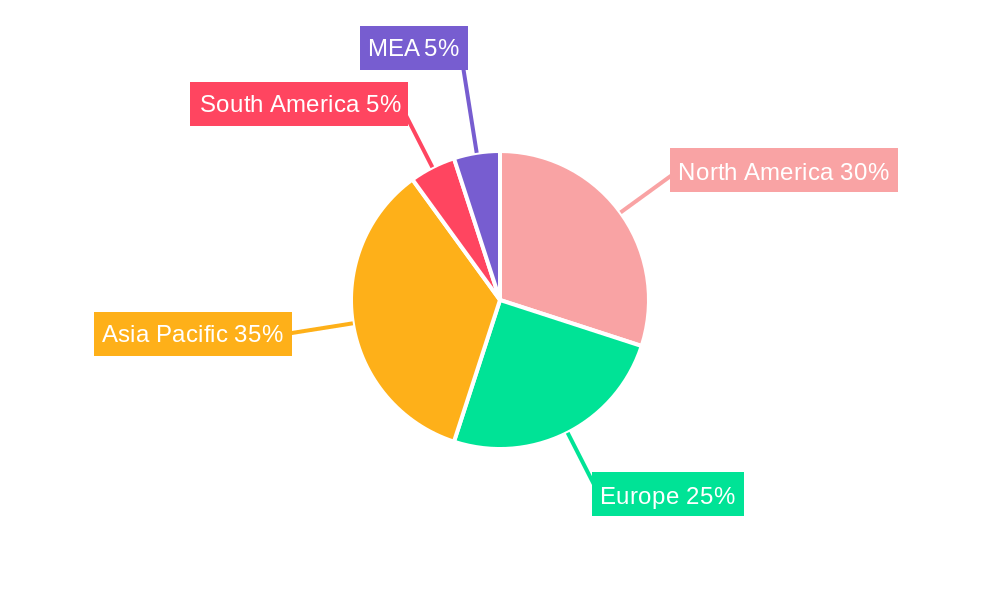
Carboxymethyl Cellulose Industry Regional Market Share
Geographic Coverage of Carboxymethyl Cellulose Industry
Carboxymethyl Cellulose Industry REPORT HIGHLIGHTS
| Aspects | Details |
|---|---|
| Study Period | 2020-2034 |
| Base Year | 2025 |
| Estimated Year | 2026 |
| Forecast Period | 2026-2034 |
| Historical Period | 2020-2025 |
| Growth Rate | CAGR of 4.64% from 2020-2034 |
| Segmentation |
|
Table of Contents
- 1. Introduction
- 1.1. Research Scope
- 1.2. Market Segmentation
- 1.3. Research Objective
- 1.4. Definitions and Assumptions
- 2. Executive Summary
- 2.1. Market Snapshot
- 3. Market Dynamics
- 3.1. Market Drivers
- 3.2. Market Restrains
- 3.3. Market Trends
- 3.4. Market Opportunities
- 4. Market Factor Analysis
- 4.1. Porters Five Forces
- 4.1.1. Bargaining Power of Suppliers
- 4.1.2. Bargaining Power of Buyers
- 4.1.3. Threat of New Entrants
- 4.1.4. Threat of Substitutes
- 4.1.5. Competitive Rivalry
- 4.2. PESTEL analysis
- 4.3. BCG Analysis
- 4.3.1. Stars (High Growth, High Market Share)
- 4.3.2. Cash Cows (Low Growth, High Market Share)
- 4.3.3. Question Mark (High Growth, Low Market Share)
- 4.3.4. Dogs (Low Growth, Low Market Share)
- 4.4. Ansoff Matrix Analysis
- 4.5. Supply Chain Analysis
- 4.6. Regulatory Landscape
- 4.7. Current Market Potential and Opportunity Assessment (TAM–SAM–SOM Framework)
- 4.8. PRI Analyst Note
- 4.1. Porters Five Forces
- 5. Market Analysis, Insights and Forecast 2021-2033
- 5.1. Market Analysis, Insights and Forecast - by Application
- 5.1.1. Food and Beverages
- 5.1.2. Oil and Gas
- 5.1.3. Cosmetics and Pharmaceuticals
- 5.1.4. Detergents
- 5.1.5. Paper Processing
- 5.1.6. Other Ap
- 5.2. Market Analysis, Insights and Forecast - by Region
- 5.2.1. Asia Pacific
- 5.2.2. North America
- 5.2.3. Europe
- 5.2.4. South America
- 5.2.5. Middle East and Africa
- 5.1. Market Analysis, Insights and Forecast - by Application
- 6. Global Carboxymethyl Cellulose Industry Analysis, Insights and Forecast, 2021-2033
- 6.1. Market Analysis, Insights and Forecast - by Application
- 6.1.1. Food and Beverages
- 6.1.2. Oil and Gas
- 6.1.3. Cosmetics and Pharmaceuticals
- 6.1.4. Detergents
- 6.1.5. Paper Processing
- 6.1.6. Other Ap
- 6.1. Market Analysis, Insights and Forecast - by Application
- 7. Asia Pacific Carboxymethyl Cellulose Industry Analysis, Insights and Forecast, 2020-2032
- 7.1. Market Analysis, Insights and Forecast - by Application
- 7.1.1. Food and Beverages
- 7.1.2. Oil and Gas
- 7.1.3. Cosmetics and Pharmaceuticals
- 7.1.4. Detergents
- 7.1.5. Paper Processing
- 7.1.6. Other Ap
- 7.1. Market Analysis, Insights and Forecast - by Application
- 8. North America Carboxymethyl Cellulose Industry Analysis, Insights and Forecast, 2020-2032
- 8.1. Market Analysis, Insights and Forecast - by Application
- 8.1.1. Food and Beverages
- 8.1.2. Oil and Gas
- 8.1.3. Cosmetics and Pharmaceuticals
- 8.1.4. Detergents
- 8.1.5. Paper Processing
- 8.1.6. Other Ap
- 8.1. Market Analysis, Insights and Forecast - by Application
- 9. Europe Carboxymethyl Cellulose Industry Analysis, Insights and Forecast, 2020-2032
- 9.1. Market Analysis, Insights and Forecast - by Application
- 9.1.1. Food and Beverages
- 9.1.2. Oil and Gas
- 9.1.3. Cosmetics and Pharmaceuticals
- 9.1.4. Detergents
- 9.1.5. Paper Processing
- 9.1.6. Other Ap
- 9.1. Market Analysis, Insights and Forecast - by Application
- 10. South America Carboxymethyl Cellulose Industry Analysis, Insights and Forecast, 2020-2032
- 10.1. Market Analysis, Insights and Forecast - by Application
- 10.1.1. Food and Beverages
- 10.1.2. Oil and Gas
- 10.1.3. Cosmetics and Pharmaceuticals
- 10.1.4. Detergents
- 10.1.5. Paper Processing
- 10.1.6. Other Ap
- 10.1. Market Analysis, Insights and Forecast - by Application
- 11. Middle East and Africa Carboxymethyl Cellulose Industry Analysis, Insights and Forecast, 2020-2032
- 11.1. Market Analysis, Insights and Forecast - by Application
- 11.1.1. Food and Beverages
- 11.1.2. Oil and Gas
- 11.1.3. Cosmetics and Pharmaceuticals
- 11.1.4. Detergents
- 11.1.5. Paper Processing
- 11.1.6. Other Ap
- 11.1. Market Analysis, Insights and Forecast - by Application
- 12. Competitive Analysis
- 12.1. Company Profiles
- 12.1.1 MIKEM
- 12.1.1.1. Company Overview
- 12.1.1.2. Products
- 12.1.1.3. Company Financials
- 12.1.1.4. SWOT Analysis
- 12.1.2 Lamberti S p A
- 12.1.2.1. Company Overview
- 12.1.2.2. Products
- 12.1.2.3. Company Financials
- 12.1.2.4. SWOT Analysis
- 12.1.3 Nouryon
- 12.1.3.1. Company Overview
- 12.1.3.2. Products
- 12.1.3.3. Company Financials
- 12.1.3.4. SWOT Analysis
- 12.1.4 Amtex Chemicals LLC
- 12.1.4.1. Company Overview
- 12.1.4.2. Products
- 12.1.4.3. Company Financials
- 12.1.4.4. SWOT Analysis
- 12.1.5 Mikro Technik GmbH
- 12.1.5.1. Company Overview
- 12.1.5.2. Products
- 12.1.5.3. Company Financials
- 12.1.5.4. SWOT Analysis
- 12.1.6 Jining Fortune Biotech Co Ltd
- 12.1.6.1. Company Overview
- 12.1.6.2. Products
- 12.1.6.3. Company Financials
- 12.1.6.4. SWOT Analysis
- 12.1.7 Chongqing Lihong Fine Chemicals Co Ltd
- 12.1.7.1. Company Overview
- 12.1.7.2. Products
- 12.1.7.3. Company Financials
- 12.1.7.4. SWOT Analysis
- 12.1.8 USK Rheology Solutions
- 12.1.8.1. Company Overview
- 12.1.8.2. Products
- 12.1.8.3. Company Financials
- 12.1.8.4. SWOT Analysis
- 12.1.9 Ashland
- 12.1.9.1. Company Overview
- 12.1.9.2. Products
- 12.1.9.3. Company Financials
- 12.1.9.4. SWOT Analysis
- 12.1.10 DKS Co Ltd
- 12.1.10.1. Company Overview
- 12.1.10.2. Products
- 12.1.10.3. Company Financials
- 12.1.10.4. SWOT Analysis
- 12.1.11 DuPont
- 12.1.11.1. Company Overview
- 12.1.11.2. Products
- 12.1.11.3. Company Financials
- 12.1.11.4. SWOT Analysis
- 12.1.12 Daicel Corporation
- 12.1.12.1. Company Overview
- 12.1.12.2. Products
- 12.1.12.3. Company Financials
- 12.1.12.4. SWOT Analysis
- 12.1.13 Foodchem International Corporation
- 12.1.13.1. Company Overview
- 12.1.13.2. Products
- 12.1.13.3. Company Financials
- 12.1.13.4. SWOT Analysis
- 12.1.14 Zibo Hailan Chemical Co Ltd
- 12.1.14.1. Company Overview
- 12.1.14.2. Products
- 12.1.14.3. Company Financials
- 12.1.14.4. SWOT Analysis
- 12.1.15 NIPPON PAPER INDUSTRIES CO LTD
- 12.1.15.1. Company Overview
- 12.1.15.2. Products
- 12.1.15.3. Company Financials
- 12.1.15.4. SWOT Analysis
- 12.1.1 MIKEM
- 12.2. Market Entropy
- 12.2.1 Company's Key Areas Served
- 12.2.2 Recent Developments
- 12.3. Company Market Share Analysis 2025
- 12.3.1 Top 5 Companies Market Share Analysis
- 12.3.2 Top 3 Companies Market Share Analysis
- 12.4. List of Potential Customers
- 13. Research Methodology
List of Figures
- Figure 1: Global Carboxymethyl Cellulose Industry Revenue Breakdown (Million, %) by Region 2025 & 2033
- Figure 2: Global Carboxymethyl Cellulose Industry Volume Breakdown (K Tons, %) by Region 2025 & 2033
- Figure 3: Asia Pacific Carboxymethyl Cellulose Industry Revenue (Million), by Application 2025 & 2033
- Figure 4: Asia Pacific Carboxymethyl Cellulose Industry Volume (K Tons), by Application 2025 & 2033
- Figure 5: Asia Pacific Carboxymethyl Cellulose Industry Revenue Share (%), by Application 2025 & 2033
- Figure 6: Asia Pacific Carboxymethyl Cellulose Industry Volume Share (%), by Application 2025 & 2033
- Figure 7: Asia Pacific Carboxymethyl Cellulose Industry Revenue (Million), by Country 2025 & 2033
- Figure 8: Asia Pacific Carboxymethyl Cellulose Industry Volume (K Tons), by Country 2025 & 2033
- Figure 9: Asia Pacific Carboxymethyl Cellulose Industry Revenue Share (%), by Country 2025 & 2033
- Figure 10: Asia Pacific Carboxymethyl Cellulose Industry Volume Share (%), by Country 2025 & 2033
- Figure 11: North America Carboxymethyl Cellulose Industry Revenue (Million), by Application 2025 & 2033
- Figure 12: North America Carboxymethyl Cellulose Industry Volume (K Tons), by Application 2025 & 2033
- Figure 13: North America Carboxymethyl Cellulose Industry Revenue Share (%), by Application 2025 & 2033
- Figure 14: North America Carboxymethyl Cellulose Industry Volume Share (%), by Application 2025 & 2033
- Figure 15: North America Carboxymethyl Cellulose Industry Revenue (Million), by Country 2025 & 2033
- Figure 16: North America Carboxymethyl Cellulose Industry Volume (K Tons), by Country 2025 & 2033
- Figure 17: North America Carboxymethyl Cellulose Industry Revenue Share (%), by Country 2025 & 2033
- Figure 18: North America Carboxymethyl Cellulose Industry Volume Share (%), by Country 2025 & 2033
- Figure 19: Europe Carboxymethyl Cellulose Industry Revenue (Million), by Application 2025 & 2033
- Figure 20: Europe Carboxymethyl Cellulose Industry Volume (K Tons), by Application 2025 & 2033
- Figure 21: Europe Carboxymethyl Cellulose Industry Revenue Share (%), by Application 2025 & 2033
- Figure 22: Europe Carboxymethyl Cellulose Industry Volume Share (%), by Application 2025 & 2033
- Figure 23: Europe Carboxymethyl Cellulose Industry Revenue (Million), by Country 2025 & 2033
- Figure 24: Europe Carboxymethyl Cellulose Industry Volume (K Tons), by Country 2025 & 2033
- Figure 25: Europe Carboxymethyl Cellulose Industry Revenue Share (%), by Country 2025 & 2033
- Figure 26: Europe Carboxymethyl Cellulose Industry Volume Share (%), by Country 2025 & 2033
- Figure 27: South America Carboxymethyl Cellulose Industry Revenue (Million), by Application 2025 & 2033
- Figure 28: South America Carboxymethyl Cellulose Industry Volume (K Tons), by Application 2025 & 2033
- Figure 29: South America Carboxymethyl Cellulose Industry Revenue Share (%), by Application 2025 & 2033
- Figure 30: South America Carboxymethyl Cellulose Industry Volume Share (%), by Application 2025 & 2033
- Figure 31: South America Carboxymethyl Cellulose Industry Revenue (Million), by Country 2025 & 2033
- Figure 32: South America Carboxymethyl Cellulose Industry Volume (K Tons), by Country 2025 & 2033
- Figure 33: South America Carboxymethyl Cellulose Industry Revenue Share (%), by Country 2025 & 2033
- Figure 34: South America Carboxymethyl Cellulose Industry Volume Share (%), by Country 2025 & 2033
- Figure 35: Middle East and Africa Carboxymethyl Cellulose Industry Revenue (Million), by Application 2025 & 2033
- Figure 36: Middle East and Africa Carboxymethyl Cellulose Industry Volume (K Tons), by Application 2025 & 2033
- Figure 37: Middle East and Africa Carboxymethyl Cellulose Industry Revenue Share (%), by Application 2025 & 2033
- Figure 38: Middle East and Africa Carboxymethyl Cellulose Industry Volume Share (%), by Application 2025 & 2033
- Figure 39: Middle East and Africa Carboxymethyl Cellulose Industry Revenue (Million), by Country 2025 & 2033
- Figure 40: Middle East and Africa Carboxymethyl Cellulose Industry Volume (K Tons), by Country 2025 & 2033
- Figure 41: Middle East and Africa Carboxymethyl Cellulose Industry Revenue Share (%), by Country 2025 & 2033
- Figure 42: Middle East and Africa Carboxymethyl Cellulose Industry Volume Share (%), by Country 2025 & 2033
List of Tables
- Table 1: Global Carboxymethyl Cellulose Industry Revenue Million Forecast, by Application 2020 & 2033
- Table 2: Global Carboxymethyl Cellulose Industry Volume K Tons Forecast, by Application 2020 & 2033
- Table 3: Global Carboxymethyl Cellulose Industry Revenue Million Forecast, by Region 2020 & 2033
- Table 4: Global Carboxymethyl Cellulose Industry Volume K Tons Forecast, by Region 2020 & 2033
- Table 5: Global Carboxymethyl Cellulose Industry Revenue Million Forecast, by Application 2020 & 2033
- Table 6: Global Carboxymethyl Cellulose Industry Volume K Tons Forecast, by Application 2020 & 2033
- Table 7: Global Carboxymethyl Cellulose Industry Revenue Million Forecast, by Country 2020 & 2033
- Table 8: Global Carboxymethyl Cellulose Industry Volume K Tons Forecast, by Country 2020 & 2033
- Table 9: China Carboxymethyl Cellulose Industry Revenue (Million) Forecast, by Application 2020 & 2033
- Table 10: China Carboxymethyl Cellulose Industry Volume (K Tons) Forecast, by Application 2020 & 2033
- Table 11: India Carboxymethyl Cellulose Industry Revenue (Million) Forecast, by Application 2020 & 2033
- Table 12: India Carboxymethyl Cellulose Industry Volume (K Tons) Forecast, by Application 2020 & 2033
- Table 13: Japan Carboxymethyl Cellulose Industry Revenue (Million) Forecast, by Application 2020 & 2033
- Table 14: Japan Carboxymethyl Cellulose Industry Volume (K Tons) Forecast, by Application 2020 & 2033
- Table 15: South Korea Carboxymethyl Cellulose Industry Revenue (Million) Forecast, by Application 2020 & 2033
- Table 16: South Korea Carboxymethyl Cellulose Industry Volume (K Tons) Forecast, by Application 2020 & 2033
- Table 17: Rest of Asia Pacific Carboxymethyl Cellulose Industry Revenue (Million) Forecast, by Application 2020 & 2033
- Table 18: Rest of Asia Pacific Carboxymethyl Cellulose Industry Volume (K Tons) Forecast, by Application 2020 & 2033
- Table 19: Global Carboxymethyl Cellulose Industry Revenue Million Forecast, by Application 2020 & 2033
- Table 20: Global Carboxymethyl Cellulose Industry Volume K Tons Forecast, by Application 2020 & 2033
- Table 21: Global Carboxymethyl Cellulose Industry Revenue Million Forecast, by Country 2020 & 2033
- Table 22: Global Carboxymethyl Cellulose Industry Volume K Tons Forecast, by Country 2020 & 2033
- Table 23: United States Carboxymethyl Cellulose Industry Revenue (Million) Forecast, by Application 2020 & 2033
- Table 24: United States Carboxymethyl Cellulose Industry Volume (K Tons) Forecast, by Application 2020 & 2033
- Table 25: Canada Carboxymethyl Cellulose Industry Revenue (Million) Forecast, by Application 2020 & 2033
- Table 26: Canada Carboxymethyl Cellulose Industry Volume (K Tons) Forecast, by Application 2020 & 2033
- Table 27: Mexico Carboxymethyl Cellulose Industry Revenue (Million) Forecast, by Application 2020 & 2033
- Table 28: Mexico Carboxymethyl Cellulose Industry Volume (K Tons) Forecast, by Application 2020 & 2033
- Table 29: Global Carboxymethyl Cellulose Industry Revenue Million Forecast, by Application 2020 & 2033
- Table 30: Global Carboxymethyl Cellulose Industry Volume K Tons Forecast, by Application 2020 & 2033
- Table 31: Global Carboxymethyl Cellulose Industry Revenue Million Forecast, by Country 2020 & 2033
- Table 32: Global Carboxymethyl Cellulose Industry Volume K Tons Forecast, by Country 2020 & 2033
- Table 33: Germany Carboxymethyl Cellulose Industry Revenue (Million) Forecast, by Application 2020 & 2033
- Table 34: Germany Carboxymethyl Cellulose Industry Volume (K Tons) Forecast, by Application 2020 & 2033
- Table 35: United Kingdom Carboxymethyl Cellulose Industry Revenue (Million) Forecast, by Application 2020 & 2033
- Table 36: United Kingdom Carboxymethyl Cellulose Industry Volume (K Tons) Forecast, by Application 2020 & 2033
- Table 37: Italy Carboxymethyl Cellulose Industry Revenue (Million) Forecast, by Application 2020 & 2033
- Table 38: Italy Carboxymethyl Cellulose Industry Volume (K Tons) Forecast, by Application 2020 & 2033
- Table 39: France Carboxymethyl Cellulose Industry Revenue (Million) Forecast, by Application 2020 & 2033
- Table 40: France Carboxymethyl Cellulose Industry Volume (K Tons) Forecast, by Application 2020 & 2033
- Table 41: Rest of Europe Carboxymethyl Cellulose Industry Revenue (Million) Forecast, by Application 2020 & 2033
- Table 42: Rest of Europe Carboxymethyl Cellulose Industry Volume (K Tons) Forecast, by Application 2020 & 2033
- Table 43: Global Carboxymethyl Cellulose Industry Revenue Million Forecast, by Application 2020 & 2033
- Table 44: Global Carboxymethyl Cellulose Industry Volume K Tons Forecast, by Application 2020 & 2033
- Table 45: Global Carboxymethyl Cellulose Industry Revenue Million Forecast, by Country 2020 & 2033
- Table 46: Global Carboxymethyl Cellulose Industry Volume K Tons Forecast, by Country 2020 & 2033
- Table 47: Brazil Carboxymethyl Cellulose Industry Revenue (Million) Forecast, by Application 2020 & 2033
- Table 48: Brazil Carboxymethyl Cellulose Industry Volume (K Tons) Forecast, by Application 2020 & 2033
- Table 49: Argentina Carboxymethyl Cellulose Industry Revenue (Million) Forecast, by Application 2020 & 2033
- Table 50: Argentina Carboxymethyl Cellulose Industry Volume (K Tons) Forecast, by Application 2020 & 2033
- Table 51: Rest of South America Carboxymethyl Cellulose Industry Revenue (Million) Forecast, by Application 2020 & 2033
- Table 52: Rest of South America Carboxymethyl Cellulose Industry Volume (K Tons) Forecast, by Application 2020 & 2033
- Table 53: Global Carboxymethyl Cellulose Industry Revenue Million Forecast, by Application 2020 & 2033
- Table 54: Global Carboxymethyl Cellulose Industry Volume K Tons Forecast, by Application 2020 & 2033
- Table 55: Global Carboxymethyl Cellulose Industry Revenue Million Forecast, by Country 2020 & 2033
- Table 56: Global Carboxymethyl Cellulose Industry Volume K Tons Forecast, by Country 2020 & 2033
- Table 57: Saudi Arabia Carboxymethyl Cellulose Industry Revenue (Million) Forecast, by Application 2020 & 2033
- Table 58: Saudi Arabia Carboxymethyl Cellulose Industry Volume (K Tons) Forecast, by Application 2020 & 2033
- Table 59: South Africa Carboxymethyl Cellulose Industry Revenue (Million) Forecast, by Application 2020 & 2033
- Table 60: South Africa Carboxymethyl Cellulose Industry Volume (K Tons) Forecast, by Application 2020 & 2033
- Table 61: Rest of Middle East and Africa Carboxymethyl Cellulose Industry Revenue (Million) Forecast, by Application 2020 & 2033
- Table 62: Rest of Middle East and Africa Carboxymethyl Cellulose Industry Volume (K Tons) Forecast, by Application 2020 & 2033
Frequently Asked Questions
1. What is the projected Compound Annual Growth Rate (CAGR) of the Carboxymethyl Cellulose Industry?
The projected CAGR is approximately 4.64%.
2. Which companies are prominent players in the Carboxymethyl Cellulose Industry?
Key companies in the market include MIKEM, Lamberti S p A, Nouryon, Amtex Chemicals LLC, Mikro Technik GmbH, Jining Fortune Biotech Co Ltd, Chongqing Lihong Fine Chemicals Co Ltd, USK Rheology Solutions, Ashland, DKS Co Ltd, DuPont, Daicel Corporation, Foodchem International Corporation, Zibo Hailan Chemical Co Ltd, NIPPON PAPER INDUSTRIES CO LTD.
3. What are the main segments of the Carboxymethyl Cellulose Industry?
The market segments include Application.
4. Can you provide details about the market size?
The market size is estimated to be USD 1.50 Million as of 2022.
5. What are some drivers contributing to market growth?
Increasing Adoption of Processed and Convenient Food; Surge in Oil Drilling Activities; Other Drivers.
6. What are the notable trends driving market growth?
Growing Applications in the Food and Beverages Sector.
7. Are there any restraints impacting market growth?
Availability of Substitutes in the Market; Other Restraints.
8. Can you provide examples of recent developments in the market?
February 2023: In Hungary, Nippon Paper Industries Co., Ltd. established a manufacturing and sales subsidiary for carboxymethyl cellulose named SUNROSE MAC. This expansion helped the company to grow its supply chain across Europe.
9. What pricing options are available for accessing the report?
Pricing options include single-user, multi-user, and enterprise licenses priced at USD 4750, USD 5250, and USD 8750 respectively.
10. Is the market size provided in terms of value or volume?
The market size is provided in terms of value, measured in Million and volume, measured in K Tons.
11. Are there any specific market keywords associated with the report?
Yes, the market keyword associated with the report is "Carboxymethyl Cellulose Industry," which aids in identifying and referencing the specific market segment covered.
12. How do I determine which pricing option suits my needs best?
The pricing options vary based on user requirements and access needs. Individual users may opt for single-user licenses, while businesses requiring broader access may choose multi-user or enterprise licenses for cost-effective access to the report.
13. Are there any additional resources or data provided in the Carboxymethyl Cellulose Industry report?
While the report offers comprehensive insights, it's advisable to review the specific contents or supplementary materials provided to ascertain if additional resources or data are available.
14. How can I stay updated on further developments or reports in the Carboxymethyl Cellulose Industry?
To stay informed about further developments, trends, and reports in the Carboxymethyl Cellulose Industry, consider subscribing to industry newsletters, following relevant companies and organizations, or regularly checking reputable industry news sources and publications.
Methodology
Step 1 - Identification of Relevant Samples Size from Population Database


Step 2 - Approaches for Defining Global Market Size (Value, Volume* & Price*)

Note*: In applicable scenarios
Step 3 - Data Sources
Primary Research
- Web Analytics
- Survey Reports
- Research Institute
- Latest Research Reports
- Opinion Leaders
Secondary Research
- Annual Reports
- White Paper
- Latest Press Release
- Industry Association
- Paid Database
- Investor Presentations

Step 4 - Data Triangulation
Involves using different sources of information in order to increase the validity of a study
These sources are likely to be stakeholders in a program - participants, other researchers, program staff, other community members, and so on.
Then we put all data in single framework & apply various statistical tools to find out the dynamic on the market.
During the analysis stage, feedback from the stakeholder groups would be compared to determine areas of agreement as well as areas of divergence