Cashew in Tanzania Market Strategic Dynamics: Competitor Analysis 2025-2033

Cashew in Tanzania Market by Production Analysis, by Consumption Analysis (Volume and Value), by Import Market Analysis (Volume and Value), by Export Market Analysis (Volume and Value), by Price Trend Analysis, by Production Analysis, by Consumption Analysis (Volume and Value), by Import Market Analysis (Volume and Value), by Export Market Analysis (Volume and Value), by Price Trend Analysis, by North America (United States, Canada, Mexico), by South America (Brazil, Argentina, Rest of South America), by Europe (United Kingdom, Germany, France, Italy, Spain, Russia, Benelux, Nordics, Rest of Europe), by Middle East & Africa (Turkey, Israel, GCC, North Africa, South Africa, Rest of Middle East & Africa), by Asia Pacific (China, India, Japan, South Korea, ASEAN, Oceania, Rest of Asia Pacific) Forecast 2025-2033

Sep 23 2025
Base Year: 2024

180 Pages
Main Logo

Cashew in Tanzania Market Strategic Dynamics: Competitor Analysis 2025-2033


Home
Industries
Agriculture
sponsor image

Tailored for you

  • In-depth Analysis Tailored to Specified Regions or Segments
  • Company Profiles Customized to User Preferences
  • Comprehensive Insights Focused on Specific Segments or Regions
  • Customized Evaluation of Competitive Landscape to Meet Your Needs
  • Tailored Customization to Address Other Specific Requirements
Ask for customization


Key Insights

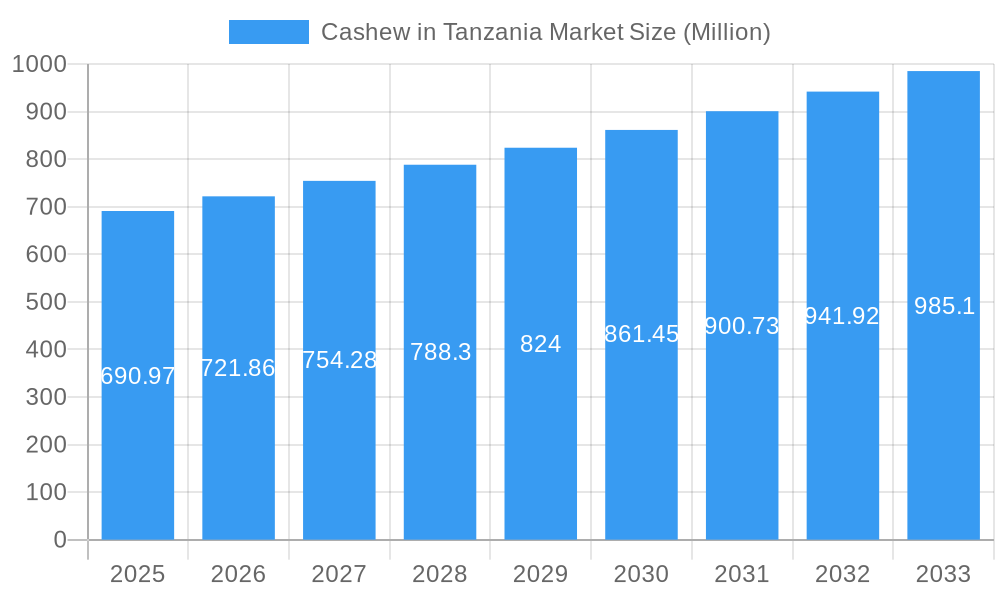
The Tanzanian cashew market, valued at $690.97 million in 2025, exhibits robust growth potential, projected to expand at a compound annual growth rate (CAGR) of 4.48% from 2025 to 2033. This growth is fueled by increasing global demand for cashews, driven by rising consumer preference for healthy snacks and the versatile use of cashews in various food products and confectionery. Furthermore, government initiatives promoting agricultural development and improved farming practices in Tanzania contribute significantly to increased cashew production. However, challenges such as climate change impacting yields, limited access to advanced processing technologies, and fluctuating international prices remain key constraints. The market is segmented across production, consumption (volume and value), import and export analysis (both volume and value), and price trends. Major players like Olam International, Cashewnut Company Ltd, and Bunge Limited dominate the market, leveraging their extensive supply chains and processing capabilities. The regional distribution likely shows a strong concentration within Africa, particularly in East Africa, with significant exports to North America, Europe, and Asia. The historical period (2019-2024) likely saw fluctuations influenced by global economic trends and weather patterns impacting cashew harvests. Future growth will hinge on addressing supply chain inefficiencies, investing in processing infrastructure, and exploring value-added cashew products to command higher prices in the international market. A strategic focus on sustainability and fair trade practices will also be crucial to enhance Tanzania's position as a key player in the global cashew industry.
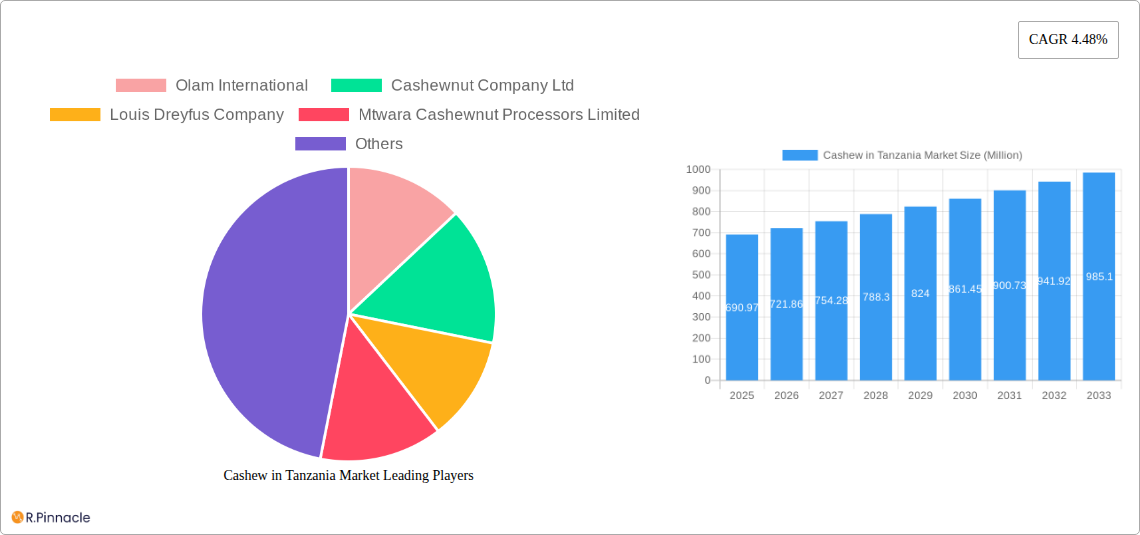
The Tanzanian cashew market's success relies on effective collaboration between the government, private sector actors, and farmers. Improving farmer access to credit and training on modern farming techniques will bolster production. Investing in research and development to develop resilient cashew varieties capable of withstanding climate change is equally crucial. Simultaneously, focusing on value addition through processing and packaging enhances profitability and strengthens the market's competitiveness globally. Analyzing regional consumption patterns and adapting marketing strategies to target specific consumer segments will also be essential for sustained growth. Ultimately, leveraging the existing strengths of Tanzanian cashew production while addressing the identified constraints will unlock the full potential of this lucrative agricultural sector.

Cashew in Tanzania Market Research Report - Market Size, Growth & Forecast

Cashew in Tanzania Market: A Comprehensive Report (2019-2033)

This comprehensive report provides an in-depth analysis of the Tanzanian cashew market, offering crucial insights for industry professionals, investors, and stakeholders. Covering the period 2019-2033, with a focus on 2025, this report unveils the market's structure, dynamics, key players, and future outlook. Detailed segmentation analysis across production, consumption, import, export, and pricing trends are included, along with projections extending to 2033. The report leverages a robust data set, encompassing market size estimations (in Millions), CAGR calculations, and analysis of key market developments.

Cashew in Tanzania Market Market Structure & Innovation Trends

This section analyzes the competitive landscape, highlighting market concentration, innovation drivers, and regulatory frameworks shaping the Tanzanian cashew industry. We delve into the roles of key players, including Olam International, Cashewnut Company Ltd, Louis Dreyfus Company, Mtwara Cashewnut Processors Limited, Bunge Limited, Tanzania Cashewnut Board, ADM (Archer Daniels Midland Company), Export Trading Group, Cargill, and assess their market share. The report also examines M&A activity, providing details on deal values (where available) and their impact on market consolidation. Analysis of product substitutes, end-user demographics, and the regulatory environment further enriches the understanding of the market structure. The xx% market share held by Olam International in 2024 is projected to reach xx% by 2033, showcasing market dynamics. Furthermore, the impact of government regulations on processing and export will be thoroughly examined. The analysis also considers innovation drivers, such as technological advancements in processing and agricultural techniques, impacting the overall market dynamics.

Cashew in Tanzania Market Growth

Cashew in Tanzania Market Market Dynamics & Trends

This section explores the key factors driving market growth, including consumer preferences, technological disruptions, and competitive dynamics. We analyze the Compound Annual Growth Rate (CAGR) for the forecast period (2025-2033) and the market penetration rate of various cashew products. Detailed analysis will examine the impact of government initiatives, such as the USD 26 million investment in agricultural inputs in 2022, on production volumes and overall market growth. The report also considers the influence of changing consumer preferences, including demand for value-added cashew products, and the impact of technological advancements on processing efficiency and quality control. Competitive dynamics, including pricing strategies and branding, are also meticulously assessed to give a complete picture of the market's evolution. This section also evaluates the influence of global cashew market trends on the Tanzanian market, considering factors like global demand, supply chain disruptions, and international pricing.

Cashew in Tanzania Market Growth

Dominant Regions & Segments in Cashew in Tanzania Market

This section identifies the leading regions and segments within the Tanzanian cashew market, based on production, consumption, import, export, and price trends. Analysis will include:

  • Production Analysis: Identifying the leading cashew-producing regions in Tanzania based on volume and value.
  • Consumption Analysis (Volume and Value): Determining the key consumption centers within Tanzania and analyzing per capita consumption patterns.
  • Import Market Analysis (Volume and Value): Identifying the key sources of cashew imports into Tanzania and the associated volumes and values.
  • Export Market Analysis (Volume and Value): Pinpointing Tanzania's major export destinations and analyzing export volumes and values.
  • Price Trend Analysis: Examining historical and projected price fluctuations, influencing factors, and their impact on market participants.

The analysis will highlight key drivers of dominance, including economic policies, infrastructure development, and the impact of government initiatives and climate conditions.

Cashew in Tanzania Market Product Innovations

This section summarizes recent product developments in the Tanzanian cashew market, focusing on technological trends and market fit. We highlight innovations in processing techniques, packaging solutions, and the development of value-added cashew products. The competitive advantages offered by these innovations will be thoroughly discussed, with an emphasis on their impact on market share and consumer acceptance.

Report Scope & Segmentation Analysis

This report segments the Tanzanian cashew market across various parameters, including:

  • Production: By region, farm size, and processing method.
  • Consumption: By type of consumer (household, industrial), and region.
  • Import/Export: By country of origin/destination and product type (raw, processed).
  • Price: By product type, grade, and market channel.

Each segment's growth projections, market size, and competitive dynamics are analyzed, providing a detailed overview of the market's structure and evolution.

Key Drivers of Cashew in Tanzania Market Growth

Key drivers fueling the growth of the Tanzanian cashew market include:

  • Government initiatives: Investments in agricultural inputs and processing infrastructure are driving increased production and value addition.
  • Technological advancements: Improved farming techniques and processing technologies enhance efficiency and quality.
  • Growing global demand: Rising global consumption of cashew nuts creates opportunities for Tanzanian exporters.

Challenges in the Cashew in Tanzania Market Sector

Challenges facing the Tanzanian cashew market include:

  • Climate change: Variable rainfall and extreme weather events threaten crop yields.
  • Supply chain inefficiencies: Limited processing capacity and storage facilities hamper efficient distribution.
  • Competition: Competition from other cashew-producing countries affects export pricing and market share. These challenges represent significant hurdles for the industry, potentially impacting market growth.

Emerging Opportunities in Cashew in Tanzania Market

Emerging opportunities in the Tanzanian cashew market include:

  • Value addition: Investing in processing facilities to produce value-added products can boost profitability and export earnings.
  • Market diversification: Exploring new export markets can reduce reliance on traditional buyers and enhance market access.
  • Sustainable farming practices: Adopting sustainable farming methods to improve crop yields and protect the environment. These opportunities offer avenues for growth and improved competitiveness.

Leading Players in the Cashew in Tanzania Market Market

  • Olam International
  • Cashewnut Company Ltd
  • Louis Dreyfus Company
  • Mtwara Cashewnut Processors Limited
  • Bunge Limited
  • Tanzania Cashewnut Board
  • ADM (Archer Daniels Midland Company)
  • Export Trading Group
  • Cargill

Key Developments in Cashew in Tanzania Market Industry

  • July 2022: The Tanzania Investment Center (TIC) announced plans to construct cashew processing factories in collaboration with local investors.
  • May 2022: The Government of Tanzania invested USD 26 Million in providing free agricultural inputs to cashew farmers.
  • March 2022: The Tanzania Agriculture Research Institute (TARI) implemented grafting and budding techniques to improve old cashew trees' productivity.

These developments significantly impact market dynamics, promoting increased production, value addition, and improved farm productivity.

Future Outlook for Cashew in Tanzania Market Market

The future outlook for the Tanzanian cashew market is positive, driven by continued government support, technological advancements, and growing global demand. Strategic investments in processing capacity, sustainable farming practices, and market diversification will be crucial for realizing the market's full potential. The report projects substantial growth in production, consumption, and export volumes over the forecast period (2025-2033), driven by these factors and a continued focus on value-added products.

Cashew in Tanzania Market Segmentation

  • 1. Production Analysis
  • 2. Consumption Analysis (Volume and Value)
  • 3. Import Market Analysis (Volume and Value)
  • 4. Export Market Analysis (Volume and Value)
  • 5. Price Trend Analysis
  • 6. Production Analysis
  • 7. Consumption Analysis (Volume and Value)
  • 8. Import Market Analysis (Volume and Value)
  • 9. Export Market Analysis (Volume and Value)
  • 10. Price Trend Analysis

Cashew in Tanzania Market Segmentation By Geography

  • 1. North America
    • 1.1. United States
    • 1.2. Canada
    • 1.3. Mexico
  • 2. South America
    • 2.1. Brazil
    • 2.2. Argentina
    • 2.3. Rest of South America
  • 3. Europe
    • 3.1. United Kingdom
    • 3.2. Germany
    • 3.3. France
    • 3.4. Italy
    • 3.5. Spain
    • 3.6. Russia
    • 3.7. Benelux
    • 3.8. Nordics
    • 3.9. Rest of Europe
  • 4. Middle East & Africa
    • 4.1. Turkey
    • 4.2. Israel
    • 4.3. GCC
    • 4.4. North Africa
    • 4.5. South Africa
    • 4.6. Rest of Middle East & Africa
  • 5. Asia Pacific
    • 5.1. China
    • 5.2. India
    • 5.3. Japan
    • 5.4. South Korea
    • 5.5. ASEAN
    • 5.6. Oceania
    • 5.7. Rest of Asia Pacific
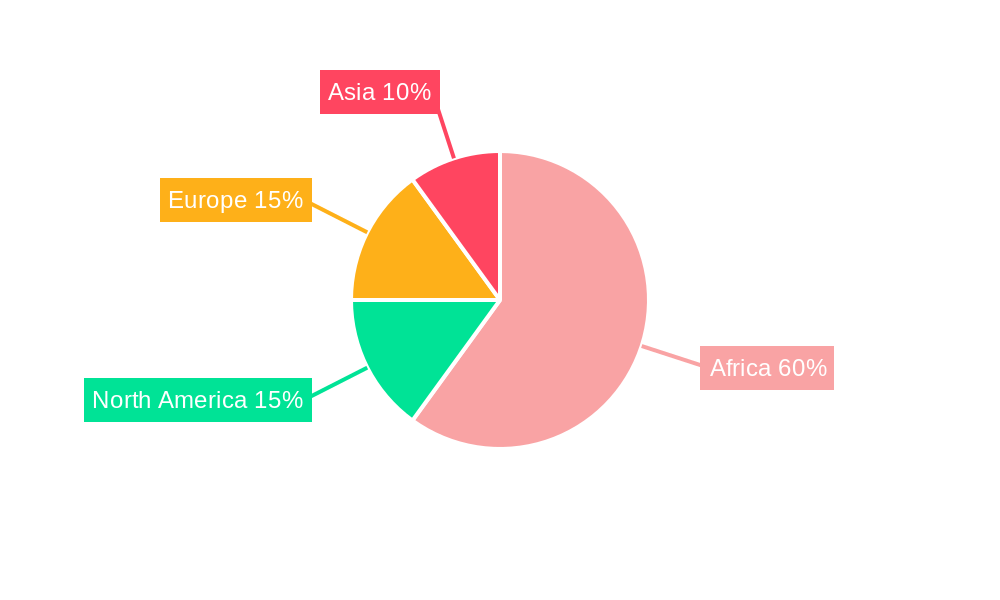
Cashew in Tanzania Market Regional Share


Cashew in Tanzania Market REPORT HIGHLIGHTS

AspectsDetails
Study Period 2019-2033
Base Year 2024
Estimated Year 2025
Forecast Period2025-2033
Historical Period2019-2024
Growth RateCAGR of 4.48% from 2019-2033
Segmentation
    • By Production Analysis
    • By Consumption Analysis (Volume and Value)
    • By Import Market Analysis (Volume and Value)
    • By Export Market Analysis (Volume and Value)
    • By Price Trend Analysis
    • By Production Analysis
    • By Consumption Analysis (Volume and Value)
    • By Import Market Analysis (Volume and Value)
    • By Export Market Analysis (Volume and Value)
    • By Price Trend Analysis
  • By Geography
    • North America
      • United States
      • Canada
      • Mexico
    • South America
      • Brazil
      • Argentina
      • Rest of South America
    • Europe
      • United Kingdom
      • Germany
      • France
      • Italy
      • Spain
      • Russia
      • Benelux
      • Nordics
      • Rest of Europe
    • Middle East & Africa
      • Turkey
      • Israel
      • GCC
      • North Africa
      • South Africa
      • Rest of Middle East & Africa
    • Asia Pacific
      • China
      • India
      • Japan
      • South Korea
      • ASEAN
      • Oceania
      • Rest of Asia Pacific


Table of Contents

  1. 1. Introduction
    • 1.1. Research Scope
    • 1.2. Market Segmentation
    • 1.3. Research Methodology
    • 1.4. Definitions and Assumptions
  2. 2. Executive Summary
    • 2.1. Introduction
  3. 3. Market Dynamics
    • 3.1. Introduction
      • 3.2. Market Drivers
      • 3.3. Market Restrains
      • 3.4. Market Trends
        • 3.4.1. Increasing Government Support and Growing Production Driving the Market
  4. 4. Market Factor Analysis
    • 4.1. Porters Five Forces
    • 4.2. Supply/Value Chain
    • 4.3. PESTEL analysis
    • 4.4. Market Entropy
    • 4.5. Patent/Trademark Analysis
  5. 5. Global Cashew in Tanzania Market Analysis, Insights and Forecast, 2019-2031
    • 5.1. Market Analysis, Insights and Forecast - by Production Analysis
      • 5.2. Market Analysis, Insights and Forecast - by Consumption Analysis (Volume and Value)
        • 5.3. Market Analysis, Insights and Forecast - by Import Market Analysis (Volume and Value)
          • 5.4. Market Analysis, Insights and Forecast - by Export Market Analysis (Volume and Value)
            • 5.5. Market Analysis, Insights and Forecast - by Price Trend Analysis
              • 5.6. Market Analysis, Insights and Forecast - by Production Analysis
                • 5.7. Market Analysis, Insights and Forecast - by Consumption Analysis (Volume and Value)
                  • 5.8. Market Analysis, Insights and Forecast - by Import Market Analysis (Volume and Value)
                    • 5.9. Market Analysis, Insights and Forecast - by Export Market Analysis (Volume and Value)
                      • 5.10. Market Analysis, Insights and Forecast - by Price Trend Analysis
                        • 5.11. Market Analysis, Insights and Forecast - by Region
                          • 5.11.1. North America
                          • 5.11.2. South America
                          • 5.11.3. Europe
                          • 5.11.4. Middle East & Africa
                          • 5.11.5. Asia Pacific
                      • 6. North America Cashew in Tanzania Market Analysis, Insights and Forecast, 2019-2031
                        • 6.1. Market Analysis, Insights and Forecast - by Production Analysis
                          • 6.2. Market Analysis, Insights and Forecast - by Consumption Analysis (Volume and Value)
                            • 6.3. Market Analysis, Insights and Forecast - by Import Market Analysis (Volume and Value)
                              • 6.4. Market Analysis, Insights and Forecast - by Export Market Analysis (Volume and Value)
                                • 6.5. Market Analysis, Insights and Forecast - by Price Trend Analysis
                                  • 6.6. Market Analysis, Insights and Forecast - by Production Analysis
                                    • 6.7. Market Analysis, Insights and Forecast - by Consumption Analysis (Volume and Value)
                                      • 6.8. Market Analysis, Insights and Forecast - by Import Market Analysis (Volume and Value)
                                        • 6.9. Market Analysis, Insights and Forecast - by Export Market Analysis (Volume and Value)
                                          • 6.10. Market Analysis, Insights and Forecast - by Price Trend Analysis
                                          • 7. South America Cashew in Tanzania Market Analysis, Insights and Forecast, 2019-2031
                                            • 7.1. Market Analysis, Insights and Forecast - by Production Analysis
                                              • 7.2. Market Analysis, Insights and Forecast - by Consumption Analysis (Volume and Value)
                                                • 7.3. Market Analysis, Insights and Forecast - by Import Market Analysis (Volume and Value)
                                                  • 7.4. Market Analysis, Insights and Forecast - by Export Market Analysis (Volume and Value)
                                                    • 7.5. Market Analysis, Insights and Forecast - by Price Trend Analysis
                                                      • 7.6. Market Analysis, Insights and Forecast - by Production Analysis
                                                        • 7.7. Market Analysis, Insights and Forecast - by Consumption Analysis (Volume and Value)
                                                          • 7.8. Market Analysis, Insights and Forecast - by Import Market Analysis (Volume and Value)
                                                            • 7.9. Market Analysis, Insights and Forecast - by Export Market Analysis (Volume and Value)
                                                              • 7.10. Market Analysis, Insights and Forecast - by Price Trend Analysis
                                                              • 8. Europe Cashew in Tanzania Market Analysis, Insights and Forecast, 2019-2031
                                                                • 8.1. Market Analysis, Insights and Forecast - by Production Analysis
                                                                  • 8.2. Market Analysis, Insights and Forecast - by Consumption Analysis (Volume and Value)
                                                                    • 8.3. Market Analysis, Insights and Forecast - by Import Market Analysis (Volume and Value)
                                                                      • 8.4. Market Analysis, Insights and Forecast - by Export Market Analysis (Volume and Value)
                                                                        • 8.5. Market Analysis, Insights and Forecast - by Price Trend Analysis
                                                                          • 8.6. Market Analysis, Insights and Forecast - by Production Analysis
                                                                            • 8.7. Market Analysis, Insights and Forecast - by Consumption Analysis (Volume and Value)
                                                                              • 8.8. Market Analysis, Insights and Forecast - by Import Market Analysis (Volume and Value)
                                                                                • 8.9. Market Analysis, Insights and Forecast - by Export Market Analysis (Volume and Value)
                                                                                  • 8.10. Market Analysis, Insights and Forecast - by Price Trend Analysis
                                                                                  • 9. Middle East & Africa Cashew in Tanzania Market Analysis, Insights and Forecast, 2019-2031
                                                                                    • 9.1. Market Analysis, Insights and Forecast - by Production Analysis
                                                                                      • 9.2. Market Analysis, Insights and Forecast - by Consumption Analysis (Volume and Value)
                                                                                        • 9.3. Market Analysis, Insights and Forecast - by Import Market Analysis (Volume and Value)
                                                                                          • 9.4. Market Analysis, Insights and Forecast - by Export Market Analysis (Volume and Value)
                                                                                            • 9.5. Market Analysis, Insights and Forecast - by Price Trend Analysis
                                                                                              • 9.6. Market Analysis, Insights and Forecast - by Production Analysis
                                                                                                • 9.7. Market Analysis, Insights and Forecast - by Consumption Analysis (Volume and Value)
                                                                                                  • 9.8. Market Analysis, Insights and Forecast - by Import Market Analysis (Volume and Value)
                                                                                                    • 9.9. Market Analysis, Insights and Forecast - by Export Market Analysis (Volume and Value)
                                                                                                      • 9.10. Market Analysis, Insights and Forecast - by Price Trend Analysis
                                                                                                      • 10. Asia Pacific Cashew in Tanzania Market Analysis, Insights and Forecast, 2019-2031
                                                                                                        • 10.1. Market Analysis, Insights and Forecast - by Production Analysis
                                                                                                          • 10.2. Market Analysis, Insights and Forecast - by Consumption Analysis (Volume and Value)
                                                                                                            • 10.3. Market Analysis, Insights and Forecast - by Import Market Analysis (Volume and Value)
                                                                                                              • 10.4. Market Analysis, Insights and Forecast - by Export Market Analysis (Volume and Value)
                                                                                                                • 10.5. Market Analysis, Insights and Forecast - by Price Trend Analysis
                                                                                                                  • 10.6. Market Analysis, Insights and Forecast - by Production Analysis
                                                                                                                    • 10.7. Market Analysis, Insights and Forecast - by Consumption Analysis (Volume and Value)
                                                                                                                      • 10.8. Market Analysis, Insights and Forecast - by Import Market Analysis (Volume and Value)
                                                                                                                        • 10.9. Market Analysis, Insights and Forecast - by Export Market Analysis (Volume and Value)
                                                                                                                          • 10.10. Market Analysis, Insights and Forecast - by Price Trend Analysis
                                                                                                                          • 11. UAE Cashew in Tanzania Market Analysis, Insights and Forecast, 2019-2031
                                                                                                                            • 12. South Africa Cashew in Tanzania Market Analysis, Insights and Forecast, 2019-2031
                                                                                                                              • 13. Saudi Arabia Cashew in Tanzania Market Analysis, Insights and Forecast, 2019-2031
                                                                                                                                • 14. Rest of MEA Cashew in Tanzania Market Analysis, Insights and Forecast, 2019-2031
                                                                                                                                  • 15. Competitive Analysis
                                                                                                                                    • 15.1. Global Market Share Analysis 2024
                                                                                                                                      • 15.2. Company Profiles
                                                                                                                                        • 15.2.1 Olam International
                                                                                                                                          • 15.2.1.1. Overview
                                                                                                                                          • 15.2.1.2. Products
                                                                                                                                          • 15.2.1.3. SWOT Analysis
                                                                                                                                          • 15.2.1.4. Recent Developments
                                                                                                                                          • 15.2.1.5. Financials (Based on Availability)
                                                                                                                                        • 15.2.2 Cashewnut Company Ltd
                                                                                                                                          • 15.2.2.1. Overview
                                                                                                                                          • 15.2.2.2. Products
                                                                                                                                          • 15.2.2.3. SWOT Analysis
                                                                                                                                          • 15.2.2.4. Recent Developments
                                                                                                                                          • 15.2.2.5. Financials (Based on Availability)
                                                                                                                                        • 15.2.3 Louis Dreyfus Company
                                                                                                                                          • 15.2.3.1. Overview
                                                                                                                                          • 15.2.3.2. Products
                                                                                                                                          • 15.2.3.3. SWOT Analysis
                                                                                                                                          • 15.2.3.4. Recent Developments
                                                                                                                                          • 15.2.3.5. Financials (Based on Availability)
                                                                                                                                        • 15.2.4 Olam International
                                                                                                                                          • 15.2.4.1. Overview
                                                                                                                                          • 15.2.4.2. Products
                                                                                                                                          • 15.2.4.3. SWOT Analysis
                                                                                                                                          • 15.2.4.4. Recent Developments
                                                                                                                                          • 15.2.4.5. Financials (Based on Availability)
                                                                                                                                        • 15.2.5 Mtwara Cashewnut Processors Limited
                                                                                                                                          • 15.2.5.1. Overview
                                                                                                                                          • 15.2.5.2. Products
                                                                                                                                          • 15.2.5.3. SWOT Analysis
                                                                                                                                          • 15.2.5.4. Recent Developments
                                                                                                                                          • 15.2.5.5. Financials (Based on Availability)
                                                                                                                                        • 15.2.6 Bunge Limited
                                                                                                                                          • 15.2.6.1. Overview
                                                                                                                                          • 15.2.6.2. Products
                                                                                                                                          • 15.2.6.3. SWOT Analysis
                                                                                                                                          • 15.2.6.4. Recent Developments
                                                                                                                                          • 15.2.6.5. Financials (Based on Availability)
                                                                                                                                        • 15.2.7 Tanzania Cashewnut Board
                                                                                                                                          • 15.2.7.1. Overview
                                                                                                                                          • 15.2.7.2. Products
                                                                                                                                          • 15.2.7.3. SWOT Analysis
                                                                                                                                          • 15.2.7.4. Recent Developments
                                                                                                                                          • 15.2.7.5. Financials (Based on Availability)
                                                                                                                                        • 15.2.8 ADM (Archer Daniels Midland Company)
                                                                                                                                          • 15.2.8.1. Overview
                                                                                                                                          • 15.2.8.2. Products
                                                                                                                                          • 15.2.8.3. SWOT Analysis
                                                                                                                                          • 15.2.8.4. Recent Developments
                                                                                                                                          • 15.2.8.5. Financials (Based on Availability)
                                                                                                                                        • 15.2.9 Export Trading Group
                                                                                                                                          • 15.2.9.1. Overview
                                                                                                                                          • 15.2.9.2. Products
                                                                                                                                          • 15.2.9.3. SWOT Analysis
                                                                                                                                          • 15.2.9.4. Recent Developments
                                                                                                                                          • 15.2.9.5. Financials (Based on Availability)
                                                                                                                                        • 15.2.10 Cargill
                                                                                                                                          • 15.2.10.1. Overview
                                                                                                                                          • 15.2.10.2. Products
                                                                                                                                          • 15.2.10.3. SWOT Analysis
                                                                                                                                          • 15.2.10.4. Recent Developments
                                                                                                                                          • 15.2.10.5. Financials (Based on Availability)

                                                                                                                                  List of Figures

                                                                                                                                  1. Figure 1: Global Cashew in Tanzania Market Revenue Breakdown (Million, %) by Region 2024 & 2032
                                                                                                                                  2. Figure 2: Global Cashew in Tanzania Market Volume Breakdown (Kiloton, %) by Region 2024 & 2032
                                                                                                                                  3. Figure 3: Middle East & Africa Cashew in Tanzania Market Revenue (Million), by Country 2024 & 2032
                                                                                                                                  4. Figure 4: Middle East & Africa Cashew in Tanzania Market Volume (Kiloton), by Country 2024 & 2032
                                                                                                                                  5. Figure 5: Middle East & Africa Cashew in Tanzania Market Revenue Share (%), by Country 2024 & 2032
                                                                                                                                  6. Figure 6: Middle East & Africa Cashew in Tanzania Market Volume Share (%), by Country 2024 & 2032
                                                                                                                                  7. Figure 7: North America Cashew in Tanzania Market Revenue (Million), by Production Analysis 2024 & 2032
                                                                                                                                  8. Figure 8: North America Cashew in Tanzania Market Volume (Kiloton), by Production Analysis 2024 & 2032
                                                                                                                                  9. Figure 9: North America Cashew in Tanzania Market Revenue Share (%), by Production Analysis 2024 & 2032
                                                                                                                                  10. Figure 10: North America Cashew in Tanzania Market Volume Share (%), by Production Analysis 2024 & 2032
                                                                                                                                  11. Figure 11: North America Cashew in Tanzania Market Revenue (Million), by Consumption Analysis (Volume and Value) 2024 & 2032
                                                                                                                                  12. Figure 12: North America Cashew in Tanzania Market Volume (Kiloton), by Consumption Analysis (Volume and Value) 2024 & 2032
                                                                                                                                  13. Figure 13: North America Cashew in Tanzania Market Revenue Share (%), by Consumption Analysis (Volume and Value) 2024 & 2032
                                                                                                                                  14. Figure 14: North America Cashew in Tanzania Market Volume Share (%), by Consumption Analysis (Volume and Value) 2024 & 2032
                                                                                                                                  15. Figure 15: North America Cashew in Tanzania Market Revenue (Million), by Import Market Analysis (Volume and Value) 2024 & 2032
                                                                                                                                  16. Figure 16: North America Cashew in Tanzania Market Volume (Kiloton), by Import Market Analysis (Volume and Value) 2024 & 2032
                                                                                                                                  17. Figure 17: North America Cashew in Tanzania Market Revenue Share (%), by Import Market Analysis (Volume and Value) 2024 & 2032
                                                                                                                                  18. Figure 18: North America Cashew in Tanzania Market Volume Share (%), by Import Market Analysis (Volume and Value) 2024 & 2032
                                                                                                                                  19. Figure 19: North America Cashew in Tanzania Market Revenue (Million), by Export Market Analysis (Volume and Value) 2024 & 2032
                                                                                                                                  20. Figure 20: North America Cashew in Tanzania Market Volume (Kiloton), by Export Market Analysis (Volume and Value) 2024 & 2032
                                                                                                                                  21. Figure 21: North America Cashew in Tanzania Market Revenue Share (%), by Export Market Analysis (Volume and Value) 2024 & 2032
                                                                                                                                  22. Figure 22: North America Cashew in Tanzania Market Volume Share (%), by Export Market Analysis (Volume and Value) 2024 & 2032
                                                                                                                                  23. Figure 23: North America Cashew in Tanzania Market Revenue (Million), by Price Trend Analysis 2024 & 2032
                                                                                                                                  24. Figure 24: North America Cashew in Tanzania Market Volume (Kiloton), by Price Trend Analysis 2024 & 2032
                                                                                                                                  25. Figure 25: North America Cashew in Tanzania Market Revenue Share (%), by Price Trend Analysis 2024 & 2032
                                                                                                                                  26. Figure 26: North America Cashew in Tanzania Market Volume Share (%), by Price Trend Analysis 2024 & 2032
                                                                                                                                  27. Figure 27: North America Cashew in Tanzania Market Revenue (Million), by Production Analysis 2024 & 2032
                                                                                                                                  28. Figure 28: North America Cashew in Tanzania Market Volume (Kiloton), by Production Analysis 2024 & 2032
                                                                                                                                  29. Figure 29: North America Cashew in Tanzania Market Revenue Share (%), by Production Analysis 2024 & 2032
                                                                                                                                  30. Figure 30: North America Cashew in Tanzania Market Volume Share (%), by Production Analysis 2024 & 2032
                                                                                                                                  31. Figure 31: North America Cashew in Tanzania Market Revenue (Million), by Consumption Analysis (Volume and Value) 2024 & 2032
                                                                                                                                  32. Figure 32: North America Cashew in Tanzania Market Volume (Kiloton), by Consumption Analysis (Volume and Value) 2024 & 2032
                                                                                                                                  33. Figure 33: North America Cashew in Tanzania Market Revenue Share (%), by Consumption Analysis (Volume and Value) 2024 & 2032
                                                                                                                                  34. Figure 34: North America Cashew in Tanzania Market Volume Share (%), by Consumption Analysis (Volume and Value) 2024 & 2032
                                                                                                                                  35. Figure 35: North America Cashew in Tanzania Market Revenue (Million), by Import Market Analysis (Volume and Value) 2024 & 2032
                                                                                                                                  36. Figure 36: North America Cashew in Tanzania Market Volume (Kiloton), by Import Market Analysis (Volume and Value) 2024 & 2032
                                                                                                                                  37. Figure 37: North America Cashew in Tanzania Market Revenue Share (%), by Import Market Analysis (Volume and Value) 2024 & 2032
                                                                                                                                  38. Figure 38: North America Cashew in Tanzania Market Volume Share (%), by Import Market Analysis (Volume and Value) 2024 & 2032
                                                                                                                                  39. Figure 39: North America Cashew in Tanzania Market Revenue (Million), by Export Market Analysis (Volume and Value) 2024 & 2032
                                                                                                                                  40. Figure 40: North America Cashew in Tanzania Market Volume (Kiloton), by Export Market Analysis (Volume and Value) 2024 & 2032
                                                                                                                                  41. Figure 41: North America Cashew in Tanzania Market Revenue Share (%), by Export Market Analysis (Volume and Value) 2024 & 2032
                                                                                                                                  42. Figure 42: North America Cashew in Tanzania Market Volume Share (%), by Export Market Analysis (Volume and Value) 2024 & 2032
                                                                                                                                  43. Figure 43: North America Cashew in Tanzania Market Revenue (Million), by Price Trend Analysis 2024 & 2032
                                                                                                                                  44. Figure 44: North America Cashew in Tanzania Market Volume (Kiloton), by Price Trend Analysis 2024 & 2032
                                                                                                                                  45. Figure 45: North America Cashew in Tanzania Market Revenue Share (%), by Price Trend Analysis 2024 & 2032
                                                                                                                                  46. Figure 46: North America Cashew in Tanzania Market Volume Share (%), by Price Trend Analysis 2024 & 2032
                                                                                                                                  47. Figure 47: North America Cashew in Tanzania Market Revenue (Million), by Country 2024 & 2032
                                                                                                                                  48. Figure 48: North America Cashew in Tanzania Market Volume (Kiloton), by Country 2024 & 2032
                                                                                                                                  49. Figure 49: North America Cashew in Tanzania Market Revenue Share (%), by Country 2024 & 2032
                                                                                                                                  50. Figure 50: North America Cashew in Tanzania Market Volume Share (%), by Country 2024 & 2032
                                                                                                                                  51. Figure 51: South America Cashew in Tanzania Market Revenue (Million), by Production Analysis 2024 & 2032
                                                                                                                                  52. Figure 52: South America Cashew in Tanzania Market Volume (Kiloton), by Production Analysis 2024 & 2032
                                                                                                                                  53. Figure 53: South America Cashew in Tanzania Market Revenue Share (%), by Production Analysis 2024 & 2032
                                                                                                                                  54. Figure 54: South America Cashew in Tanzania Market Volume Share (%), by Production Analysis 2024 & 2032
                                                                                                                                  55. Figure 55: South America Cashew in Tanzania Market Revenue (Million), by Consumption Analysis (Volume and Value) 2024 & 2032
                                                                                                                                  56. Figure 56: South America Cashew in Tanzania Market Volume (Kiloton), by Consumption Analysis (Volume and Value) 2024 & 2032
                                                                                                                                  57. Figure 57: South America Cashew in Tanzania Market Revenue Share (%), by Consumption Analysis (Volume and Value) 2024 & 2032
                                                                                                                                  58. Figure 58: South America Cashew in Tanzania Market Volume Share (%), by Consumption Analysis (Volume and Value) 2024 & 2032
                                                                                                                                  59. Figure 59: South America Cashew in Tanzania Market Revenue (Million), by Import Market Analysis (Volume and Value) 2024 & 2032
                                                                                                                                  60. Figure 60: South America Cashew in Tanzania Market Volume (Kiloton), by Import Market Analysis (Volume and Value) 2024 & 2032
                                                                                                                                  61. Figure 61: South America Cashew in Tanzania Market Revenue Share (%), by Import Market Analysis (Volume and Value) 2024 & 2032
                                                                                                                                  62. Figure 62: South America Cashew in Tanzania Market Volume Share (%), by Import Market Analysis (Volume and Value) 2024 & 2032
                                                                                                                                  63. Figure 63: South America Cashew in Tanzania Market Revenue (Million), by Export Market Analysis (Volume and Value) 2024 & 2032
                                                                                                                                  64. Figure 64: South America Cashew in Tanzania Market Volume (Kiloton), by Export Market Analysis (Volume and Value) 2024 & 2032
                                                                                                                                  65. Figure 65: South America Cashew in Tanzania Market Revenue Share (%), by Export Market Analysis (Volume and Value) 2024 & 2032
                                                                                                                                  66. Figure 66: South America Cashew in Tanzania Market Volume Share (%), by Export Market Analysis (Volume and Value) 2024 & 2032
                                                                                                                                  67. Figure 67: South America Cashew in Tanzania Market Revenue (Million), by Price Trend Analysis 2024 & 2032
                                                                                                                                  68. Figure 68: South America Cashew in Tanzania Market Volume (Kiloton), by Price Trend Analysis 2024 & 2032
                                                                                                                                  69. Figure 69: South America Cashew in Tanzania Market Revenue Share (%), by Price Trend Analysis 2024 & 2032
                                                                                                                                  70. Figure 70: South America Cashew in Tanzania Market Volume Share (%), by Price Trend Analysis 2024 & 2032
                                                                                                                                  71. Figure 71: South America Cashew in Tanzania Market Revenue (Million), by Production Analysis 2024 & 2032
                                                                                                                                  72. Figure 72: South America Cashew in Tanzania Market Volume (Kiloton), by Production Analysis 2024 & 2032
                                                                                                                                  73. Figure 73: South America Cashew in Tanzania Market Revenue Share (%), by Production Analysis 2024 & 2032
                                                                                                                                  74. Figure 74: South America Cashew in Tanzania Market Volume Share (%), by Production Analysis 2024 & 2032
                                                                                                                                  75. Figure 75: South America Cashew in Tanzania Market Revenue (Million), by Consumption Analysis (Volume and Value) 2024 & 2032
                                                                                                                                  76. Figure 76: South America Cashew in Tanzania Market Volume (Kiloton), by Consumption Analysis (Volume and Value) 2024 & 2032
                                                                                                                                  77. Figure 77: South America Cashew in Tanzania Market Revenue Share (%), by Consumption Analysis (Volume and Value) 2024 & 2032
                                                                                                                                  78. Figure 78: South America Cashew in Tanzania Market Volume Share (%), by Consumption Analysis (Volume and Value) 2024 & 2032
                                                                                                                                  79. Figure 79: South America Cashew in Tanzania Market Revenue (Million), by Import Market Analysis (Volume and Value) 2024 & 2032
                                                                                                                                  80. Figure 80: South America Cashew in Tanzania Market Volume (Kiloton), by Import Market Analysis (Volume and Value) 2024 & 2032
                                                                                                                                  81. Figure 81: South America Cashew in Tanzania Market Revenue Share (%), by Import Market Analysis (Volume and Value) 2024 & 2032
                                                                                                                                  82. Figure 82: South America Cashew in Tanzania Market Volume Share (%), by Import Market Analysis (Volume and Value) 2024 & 2032
                                                                                                                                  83. Figure 83: South America Cashew in Tanzania Market Revenue (Million), by Export Market Analysis (Volume and Value) 2024 & 2032
                                                                                                                                  84. Figure 84: South America Cashew in Tanzania Market Volume (Kiloton), by Export Market Analysis (Volume and Value) 2024 & 2032
                                                                                                                                  85. Figure 85: South America Cashew in Tanzania Market Revenue Share (%), by Export Market Analysis (Volume and Value) 2024 & 2032
                                                                                                                                  86. Figure 86: South America Cashew in Tanzania Market Volume Share (%), by Export Market Analysis (Volume and Value) 2024 & 2032
                                                                                                                                  87. Figure 87: South America Cashew in Tanzania Market Revenue (Million), by Price Trend Analysis 2024 & 2032
                                                                                                                                  88. Figure 88: South America Cashew in Tanzania Market Volume (Kiloton), by Price Trend Analysis 2024 & 2032
                                                                                                                                  89. Figure 89: South America Cashew in Tanzania Market Revenue Share (%), by Price Trend Analysis 2024 & 2032
                                                                                                                                  90. Figure 90: South America Cashew in Tanzania Market Volume Share (%), by Price Trend Analysis 2024 & 2032
                                                                                                                                  91. Figure 91: South America Cashew in Tanzania Market Revenue (Million), by Country 2024 & 2032
                                                                                                                                  92. Figure 92: South America Cashew in Tanzania Market Volume (Kiloton), by Country 2024 & 2032
                                                                                                                                  93. Figure 93: South America Cashew in Tanzania Market Revenue Share (%), by Country 2024 & 2032
                                                                                                                                  94. Figure 94: South America Cashew in Tanzania Market Volume Share (%), by Country 2024 & 2032
                                                                                                                                  95. Figure 95: Europe Cashew in Tanzania Market Revenue (Million), by Production Analysis 2024 & 2032
                                                                                                                                  96. Figure 96: Europe Cashew in Tanzania Market Volume (Kiloton), by Production Analysis 2024 & 2032
                                                                                                                                  97. Figure 97: Europe Cashew in Tanzania Market Revenue Share (%), by Production Analysis 2024 & 2032
                                                                                                                                  98. Figure 98: Europe Cashew in Tanzania Market Volume Share (%), by Production Analysis 2024 & 2032
                                                                                                                                  99. Figure 99: Europe Cashew in Tanzania Market Revenue (Million), by Consumption Analysis (Volume and Value) 2024 & 2032
                                                                                                                                  100. Figure 100: Europe Cashew in Tanzania Market Volume (Kiloton), by Consumption Analysis (Volume and Value) 2024 & 2032
                                                                                                                                  101. Figure 101: Europe Cashew in Tanzania Market Revenue Share (%), by Consumption Analysis (Volume and Value) 2024 & 2032
                                                                                                                                  102. Figure 102: Europe Cashew in Tanzania Market Volume Share (%), by Consumption Analysis (Volume and Value) 2024 & 2032
                                                                                                                                  103. Figure 103: Europe Cashew in Tanzania Market Revenue (Million), by Import Market Analysis (Volume and Value) 2024 & 2032
                                                                                                                                  104. Figure 104: Europe Cashew in Tanzania Market Volume (Kiloton), by Import Market Analysis (Volume and Value) 2024 & 2032
                                                                                                                                  105. Figure 105: Europe Cashew in Tanzania Market Revenue Share (%), by Import Market Analysis (Volume and Value) 2024 & 2032
                                                                                                                                  106. Figure 106: Europe Cashew in Tanzania Market Volume Share (%), by Import Market Analysis (Volume and Value) 2024 & 2032
                                                                                                                                  107. Figure 107: Europe Cashew in Tanzania Market Revenue (Million), by Export Market Analysis (Volume and Value) 2024 & 2032
                                                                                                                                  108. Figure 108: Europe Cashew in Tanzania Market Volume (Kiloton), by Export Market Analysis (Volume and Value) 2024 & 2032
                                                                                                                                  109. Figure 109: Europe Cashew in Tanzania Market Revenue Share (%), by Export Market Analysis (Volume and Value) 2024 & 2032
                                                                                                                                  110. Figure 110: Europe Cashew in Tanzania Market Volume Share (%), by Export Market Analysis (Volume and Value) 2024 & 2032
                                                                                                                                  111. Figure 111: Europe Cashew in Tanzania Market Revenue (Million), by Price Trend Analysis 2024 & 2032
                                                                                                                                  112. Figure 112: Europe Cashew in Tanzania Market Volume (Kiloton), by Price Trend Analysis 2024 & 2032
                                                                                                                                  113. Figure 113: Europe Cashew in Tanzania Market Revenue Share (%), by Price Trend Analysis 2024 & 2032
                                                                                                                                  114. Figure 114: Europe Cashew in Tanzania Market Volume Share (%), by Price Trend Analysis 2024 & 2032
                                                                                                                                  115. Figure 115: Europe Cashew in Tanzania Market Revenue (Million), by Production Analysis 2024 & 2032
                                                                                                                                  116. Figure 116: Europe Cashew in Tanzania Market Volume (Kiloton), by Production Analysis 2024 & 2032
                                                                                                                                  117. Figure 117: Europe Cashew in Tanzania Market Revenue Share (%), by Production Analysis 2024 & 2032
                                                                                                                                  118. Figure 118: Europe Cashew in Tanzania Market Volume Share (%), by Production Analysis 2024 & 2032
                                                                                                                                  119. Figure 119: Europe Cashew in Tanzania Market Revenue (Million), by Consumption Analysis (Volume and Value) 2024 & 2032
                                                                                                                                  120. Figure 120: Europe Cashew in Tanzania Market Volume (Kiloton), by Consumption Analysis (Volume and Value) 2024 & 2032
                                                                                                                                  121. Figure 121: Europe Cashew in Tanzania Market Revenue Share (%), by Consumption Analysis (Volume and Value) 2024 & 2032
                                                                                                                                  122. Figure 122: Europe Cashew in Tanzania Market Volume Share (%), by Consumption Analysis (Volume and Value) 2024 & 2032
                                                                                                                                  123. Figure 123: Europe Cashew in Tanzania Market Revenue (Million), by Import Market Analysis (Volume and Value) 2024 & 2032
                                                                                                                                  124. Figure 124: Europe Cashew in Tanzania Market Volume (Kiloton), by Import Market Analysis (Volume and Value) 2024 & 2032
                                                                                                                                  125. Figure 125: Europe Cashew in Tanzania Market Revenue Share (%), by Import Market Analysis (Volume and Value) 2024 & 2032
                                                                                                                                  126. Figure 126: Europe Cashew in Tanzania Market Volume Share (%), by Import Market Analysis (Volume and Value) 2024 & 2032
                                                                                                                                  127. Figure 127: Europe Cashew in Tanzania Market Revenue (Million), by Export Market Analysis (Volume and Value) 2024 & 2032
                                                                                                                                  128. Figure 128: Europe Cashew in Tanzania Market Volume (Kiloton), by Export Market Analysis (Volume and Value) 2024 & 2032
                                                                                                                                  129. Figure 129: Europe Cashew in Tanzania Market Revenue Share (%), by Export Market Analysis (Volume and Value) 2024 & 2032
                                                                                                                                  130. Figure 130: Europe Cashew in Tanzania Market Volume Share (%), by Export Market Analysis (Volume and Value) 2024 & 2032
                                                                                                                                  131. Figure 131: Europe Cashew in Tanzania Market Revenue (Million), by Price Trend Analysis 2024 & 2032
                                                                                                                                  132. Figure 132: Europe Cashew in Tanzania Market Volume (Kiloton), by Price Trend Analysis 2024 & 2032
                                                                                                                                  133. Figure 133: Europe Cashew in Tanzania Market Revenue Share (%), by Price Trend Analysis 2024 & 2032
                                                                                                                                  134. Figure 134: Europe Cashew in Tanzania Market Volume Share (%), by Price Trend Analysis 2024 & 2032
                                                                                                                                  135. Figure 135: Europe Cashew in Tanzania Market Revenue (Million), by Country 2024 & 2032
                                                                                                                                  136. Figure 136: Europe Cashew in Tanzania Market Volume (Kiloton), by Country 2024 & 2032
                                                                                                                                  137. Figure 137: Europe Cashew in Tanzania Market Revenue Share (%), by Country 2024 & 2032
                                                                                                                                  138. Figure 138: Europe Cashew in Tanzania Market Volume Share (%), by Country 2024 & 2032
                                                                                                                                  139. Figure 139: Middle East & Africa Cashew in Tanzania Market Revenue (Million), by Production Analysis 2024 & 2032
                                                                                                                                  140. Figure 140: Middle East & Africa Cashew in Tanzania Market Volume (Kiloton), by Production Analysis 2024 & 2032
                                                                                                                                  141. Figure 141: Middle East & Africa Cashew in Tanzania Market Revenue Share (%), by Production Analysis 2024 & 2032
                                                                                                                                  142. Figure 142: Middle East & Africa Cashew in Tanzania Market Volume Share (%), by Production Analysis 2024 & 2032
                                                                                                                                  143. Figure 143: Middle East & Africa Cashew in Tanzania Market Revenue (Million), by Consumption Analysis (Volume and Value) 2024 & 2032
                                                                                                                                  144. Figure 144: Middle East & Africa Cashew in Tanzania Market Volume (Kiloton), by Consumption Analysis (Volume and Value) 2024 & 2032
                                                                                                                                  145. Figure 145: Middle East & Africa Cashew in Tanzania Market Revenue Share (%), by Consumption Analysis (Volume and Value) 2024 & 2032
                                                                                                                                  146. Figure 146: Middle East & Africa Cashew in Tanzania Market Volume Share (%), by Consumption Analysis (Volume and Value) 2024 & 2032
                                                                                                                                  147. Figure 147: Middle East & Africa Cashew in Tanzania Market Revenue (Million), by Import Market Analysis (Volume and Value) 2024 & 2032
                                                                                                                                  148. Figure 148: Middle East & Africa Cashew in Tanzania Market Volume (Kiloton), by Import Market Analysis (Volume and Value) 2024 & 2032
                                                                                                                                  149. Figure 149: Middle East & Africa Cashew in Tanzania Market Revenue Share (%), by Import Market Analysis (Volume and Value) 2024 & 2032
                                                                                                                                  150. Figure 150: Middle East & Africa Cashew in Tanzania Market Volume Share (%), by Import Market Analysis (Volume and Value) 2024 & 2032
                                                                                                                                  151. Figure 151: Middle East & Africa Cashew in Tanzania Market Revenue (Million), by Export Market Analysis (Volume and Value) 2024 & 2032
                                                                                                                                  152. Figure 152: Middle East & Africa Cashew in Tanzania Market Volume (Kiloton), by Export Market Analysis (Volume and Value) 2024 & 2032
                                                                                                                                  153. Figure 153: Middle East & Africa Cashew in Tanzania Market Revenue Share (%), by Export Market Analysis (Volume and Value) 2024 & 2032
                                                                                                                                  154. Figure 154: Middle East & Africa Cashew in Tanzania Market Volume Share (%), by Export Market Analysis (Volume and Value) 2024 & 2032
                                                                                                                                  155. Figure 155: Middle East & Africa Cashew in Tanzania Market Revenue (Million), by Price Trend Analysis 2024 & 2032
                                                                                                                                  156. Figure 156: Middle East & Africa Cashew in Tanzania Market Volume (Kiloton), by Price Trend Analysis 2024 & 2032
                                                                                                                                  157. Figure 157: Middle East & Africa Cashew in Tanzania Market Revenue Share (%), by Price Trend Analysis 2024 & 2032
                                                                                                                                  158. Figure 158: Middle East & Africa Cashew in Tanzania Market Volume Share (%), by Price Trend Analysis 2024 & 2032
                                                                                                                                  159. Figure 159: Middle East & Africa Cashew in Tanzania Market Revenue (Million), by Production Analysis 2024 & 2032
                                                                                                                                  160. Figure 160: Middle East & Africa Cashew in Tanzania Market Volume (Kiloton), by Production Analysis 2024 & 2032
                                                                                                                                  161. Figure 161: Middle East & Africa Cashew in Tanzania Market Revenue Share (%), by Production Analysis 2024 & 2032
                                                                                                                                  162. Figure 162: Middle East & Africa Cashew in Tanzania Market Volume Share (%), by Production Analysis 2024 & 2032
                                                                                                                                  163. Figure 163: Middle East & Africa Cashew in Tanzania Market Revenue (Million), by Consumption Analysis (Volume and Value) 2024 & 2032
                                                                                                                                  164. Figure 164: Middle East & Africa Cashew in Tanzania Market Volume (Kiloton), by Consumption Analysis (Volume and Value) 2024 & 2032
                                                                                                                                  165. Figure 165: Middle East & Africa Cashew in Tanzania Market Revenue Share (%), by Consumption Analysis (Volume and Value) 2024 & 2032
                                                                                                                                  166. Figure 166: Middle East & Africa Cashew in Tanzania Market Volume Share (%), by Consumption Analysis (Volume and Value) 2024 & 2032
                                                                                                                                  167. Figure 167: Middle East & Africa Cashew in Tanzania Market Revenue (Million), by Import Market Analysis (Volume and Value) 2024 & 2032
                                                                                                                                  168. Figure 168: Middle East & Africa Cashew in Tanzania Market Volume (Kiloton), by Import Market Analysis (Volume and Value) 2024 & 2032
                                                                                                                                  169. Figure 169: Middle East & Africa Cashew in Tanzania Market Revenue Share (%), by Import Market Analysis (Volume and Value) 2024 & 2032
                                                                                                                                  170. Figure 170: Middle East & Africa Cashew in Tanzania Market Volume Share (%), by Import Market Analysis (Volume and Value) 2024 & 2032
                                                                                                                                  171. Figure 171: Middle East & Africa Cashew in Tanzania Market Revenue (Million), by Export Market Analysis (Volume and Value) 2024 & 2032
                                                                                                                                  172. Figure 172: Middle East & Africa Cashew in Tanzania Market Volume (Kiloton), by Export Market Analysis (Volume and Value) 2024 & 2032
                                                                                                                                  173. Figure 173: Middle East & Africa Cashew in Tanzania Market Revenue Share (%), by Export Market Analysis (Volume and Value) 2024 & 2032
                                                                                                                                  174. Figure 174: Middle East & Africa Cashew in Tanzania Market Volume Share (%), by Export Market Analysis (Volume and Value) 2024 & 2032
                                                                                                                                  175. Figure 175: Middle East & Africa Cashew in Tanzania Market Revenue (Million), by Price Trend Analysis 2024 & 2032
                                                                                                                                  176. Figure 176: Middle East & Africa Cashew in Tanzania Market Volume (Kiloton), by Price Trend Analysis 2024 & 2032
                                                                                                                                  177. Figure 177: Middle East & Africa Cashew in Tanzania Market Revenue Share (%), by Price Trend Analysis 2024 & 2032
                                                                                                                                  178. Figure 178: Middle East & Africa Cashew in Tanzania Market Volume Share (%), by Price Trend Analysis 2024 & 2032
                                                                                                                                  179. Figure 179: Middle East & Africa Cashew in Tanzania Market Revenue (Million), by Country 2024 & 2032
                                                                                                                                  180. Figure 180: Middle East & Africa Cashew in Tanzania Market Volume (Kiloton), by Country 2024 & 2032
                                                                                                                                  181. Figure 181: Middle East & Africa Cashew in Tanzania Market Revenue Share (%), by Country 2024 & 2032
                                                                                                                                  182. Figure 182: Middle East & Africa Cashew in Tanzania Market Volume Share (%), by Country 2024 & 2032
                                                                                                                                  183. Figure 183: Asia Pacific Cashew in Tanzania Market Revenue (Million), by Production Analysis 2024 & 2032
                                                                                                                                  184. Figure 184: Asia Pacific Cashew in Tanzania Market Volume (Kiloton), by Production Analysis 2024 & 2032
                                                                                                                                  185. Figure 185: Asia Pacific Cashew in Tanzania Market Revenue Share (%), by Production Analysis 2024 & 2032
                                                                                                                                  186. Figure 186: Asia Pacific Cashew in Tanzania Market Volume Share (%), by Production Analysis 2024 & 2032
                                                                                                                                  187. Figure 187: Asia Pacific Cashew in Tanzania Market Revenue (Million), by Consumption Analysis (Volume and Value) 2024 & 2032
                                                                                                                                  188. Figure 188: Asia Pacific Cashew in Tanzania Market Volume (Kiloton), by Consumption Analysis (Volume and Value) 2024 & 2032
                                                                                                                                  189. Figure 189: Asia Pacific Cashew in Tanzania Market Revenue Share (%), by Consumption Analysis (Volume and Value) 2024 & 2032
                                                                                                                                  190. Figure 190: Asia Pacific Cashew in Tanzania Market Volume Share (%), by Consumption Analysis (Volume and Value) 2024 & 2032
                                                                                                                                  191. Figure 191: Asia Pacific Cashew in Tanzania Market Revenue (Million), by Import Market Analysis (Volume and Value) 2024 & 2032
                                                                                                                                  192. Figure 192: Asia Pacific Cashew in Tanzania Market Volume (Kiloton), by Import Market Analysis (Volume and Value) 2024 & 2032
                                                                                                                                  193. Figure 193: Asia Pacific Cashew in Tanzania Market Revenue Share (%), by Import Market Analysis (Volume and Value) 2024 & 2032
                                                                                                                                  194. Figure 194: Asia Pacific Cashew in Tanzania Market Volume Share (%), by Import Market Analysis (Volume and Value) 2024 & 2032
                                                                                                                                  195. Figure 195: Asia Pacific Cashew in Tanzania Market Revenue (Million), by Export Market Analysis (Volume and Value) 2024 & 2032
                                                                                                                                  196. Figure 196: Asia Pacific Cashew in Tanzania Market Volume (Kiloton), by Export Market Analysis (Volume and Value) 2024 & 2032
                                                                                                                                  197. Figure 197: Asia Pacific Cashew in Tanzania Market Revenue Share (%), by Export Market Analysis (Volume and Value) 2024 & 2032
                                                                                                                                  198. Figure 198: Asia Pacific Cashew in Tanzania Market Volume Share (%), by Export Market Analysis (Volume and Value) 2024 & 2032
                                                                                                                                  199. Figure 199: Asia Pacific Cashew in Tanzania Market Revenue (Million), by Price Trend Analysis 2024 & 2032
                                                                                                                                  200. Figure 200: Asia Pacific Cashew in Tanzania Market Volume (Kiloton), by Price Trend Analysis 2024 & 2032
                                                                                                                                  201. Figure 201: Asia Pacific Cashew in Tanzania Market Revenue Share (%), by Price Trend Analysis 2024 & 2032
                                                                                                                                  202. Figure 202: Asia Pacific Cashew in Tanzania Market Volume Share (%), by Price Trend Analysis 2024 & 2032
                                                                                                                                  203. Figure 203: Asia Pacific Cashew in Tanzania Market Revenue (Million), by Production Analysis 2024 & 2032
                                                                                                                                  204. Figure 204: Asia Pacific Cashew in Tanzania Market Volume (Kiloton), by Production Analysis 2024 & 2032
                                                                                                                                  205. Figure 205: Asia Pacific Cashew in Tanzania Market Revenue Share (%), by Production Analysis 2024 & 2032
                                                                                                                                  206. Figure 206: Asia Pacific Cashew in Tanzania Market Volume Share (%), by Production Analysis 2024 & 2032
                                                                                                                                  207. Figure 207: Asia Pacific Cashew in Tanzania Market Revenue (Million), by Consumption Analysis (Volume and Value) 2024 & 2032
                                                                                                                                  208. Figure 208: Asia Pacific Cashew in Tanzania Market Volume (Kiloton), by Consumption Analysis (Volume and Value) 2024 & 2032
                                                                                                                                  209. Figure 209: Asia Pacific Cashew in Tanzania Market Revenue Share (%), by Consumption Analysis (Volume and Value) 2024 & 2032
                                                                                                                                  210. Figure 210: Asia Pacific Cashew in Tanzania Market Volume Share (%), by Consumption Analysis (Volume and Value) 2024 & 2032
                                                                                                                                  211. Figure 211: Asia Pacific Cashew in Tanzania Market Revenue (Million), by Import Market Analysis (Volume and Value) 2024 & 2032
                                                                                                                                  212. Figure 212: Asia Pacific Cashew in Tanzania Market Volume (Kiloton), by Import Market Analysis (Volume and Value) 2024 & 2032
                                                                                                                                  213. Figure 213: Asia Pacific Cashew in Tanzania Market Revenue Share (%), by Import Market Analysis (Volume and Value) 2024 & 2032
                                                                                                                                  214. Figure 214: Asia Pacific Cashew in Tanzania Market Volume Share (%), by Import Market Analysis (Volume and Value) 2024 & 2032
                                                                                                                                  215. Figure 215: Asia Pacific Cashew in Tanzania Market Revenue (Million), by Export Market Analysis (Volume and Value) 2024 & 2032
                                                                                                                                  216. Figure 216: Asia Pacific Cashew in Tanzania Market Volume (Kiloton), by Export Market Analysis (Volume and Value) 2024 & 2032
                                                                                                                                  217. Figure 217: Asia Pacific Cashew in Tanzania Market Revenue Share (%), by Export Market Analysis (Volume and Value) 2024 & 2032
                                                                                                                                  218. Figure 218: Asia Pacific Cashew in Tanzania Market Volume Share (%), by Export Market Analysis (Volume and Value) 2024 & 2032
                                                                                                                                  219. Figure 219: Asia Pacific Cashew in Tanzania Market Revenue (Million), by Price Trend Analysis 2024 & 2032
                                                                                                                                  220. Figure 220: Asia Pacific Cashew in Tanzania Market Volume (Kiloton), by Price Trend Analysis 2024 & 2032
                                                                                                                                  221. Figure 221: Asia Pacific Cashew in Tanzania Market Revenue Share (%), by Price Trend Analysis 2024 & 2032
                                                                                                                                  222. Figure 222: Asia Pacific Cashew in Tanzania Market Volume Share (%), by Price Trend Analysis 2024 & 2032
                                                                                                                                  223. Figure 223: Asia Pacific Cashew in Tanzania Market Revenue (Million), by Country 2024 & 2032
                                                                                                                                  224. Figure 224: Asia Pacific Cashew in Tanzania Market Volume (Kiloton), by Country 2024 & 2032
                                                                                                                                  225. Figure 225: Asia Pacific Cashew in Tanzania Market Revenue Share (%), by Country 2024 & 2032
                                                                                                                                  226. Figure 226: Asia Pacific Cashew in Tanzania Market Volume Share (%), by Country 2024 & 2032

                                                                                                                                  List of Tables

                                                                                                                                  1. Table 1: Global Cashew in Tanzania Market Revenue Million Forecast, by Region 2019 & 2032
                                                                                                                                  2. Table 2: Global Cashew in Tanzania Market Volume Kiloton Forecast, by Region 2019 & 2032
                                                                                                                                  3. Table 3: Global Cashew in Tanzania Market Revenue Million Forecast, by Production Analysis 2019 & 2032
                                                                                                                                  4. Table 4: Global Cashew in Tanzania Market Volume Kiloton Forecast, by Production Analysis 2019 & 2032
                                                                                                                                  5. Table 5: Global Cashew in Tanzania Market Revenue Million Forecast, by Consumption Analysis (Volume and Value) 2019 & 2032
                                                                                                                                  6. Table 6: Global Cashew in Tanzania Market Volume Kiloton Forecast, by Consumption Analysis (Volume and Value) 2019 & 2032
                                                                                                                                  7. Table 7: Global Cashew in Tanzania Market Revenue Million Forecast, by Import Market Analysis (Volume and Value) 2019 & 2032
                                                                                                                                  8. Table 8: Global Cashew in Tanzania Market Volume Kiloton Forecast, by Import Market Analysis (Volume and Value) 2019 & 2032
                                                                                                                                  9. Table 9: Global Cashew in Tanzania Market Revenue Million Forecast, by Export Market Analysis (Volume and Value) 2019 & 2032
                                                                                                                                  10. Table 10: Global Cashew in Tanzania Market Volume Kiloton Forecast, by Export Market Analysis (Volume and Value) 2019 & 2032
                                                                                                                                  11. Table 11: Global Cashew in Tanzania Market Revenue Million Forecast, by Price Trend Analysis 2019 & 2032
                                                                                                                                  12. Table 12: Global Cashew in Tanzania Market Volume Kiloton Forecast, by Price Trend Analysis 2019 & 2032
                                                                                                                                  13. Table 13: Global Cashew in Tanzania Market Revenue Million Forecast, by Production Analysis 2019 & 2032
                                                                                                                                  14. Table 14: Global Cashew in Tanzania Market Volume Kiloton Forecast, by Production Analysis 2019 & 2032
                                                                                                                                  15. Table 15: Global Cashew in Tanzania Market Revenue Million Forecast, by Consumption Analysis (Volume and Value) 2019 & 2032
                                                                                                                                  16. Table 16: Global Cashew in Tanzania Market Volume Kiloton Forecast, by Consumption Analysis (Volume and Value) 2019 & 2032
                                                                                                                                  17. Table 17: Global Cashew in Tanzania Market Revenue Million Forecast, by Import Market Analysis (Volume and Value) 2019 & 2032
                                                                                                                                  18. Table 18: Global Cashew in Tanzania Market Volume Kiloton Forecast, by Import Market Analysis (Volume and Value) 2019 & 2032
                                                                                                                                  19. Table 19: Global Cashew in Tanzania Market Revenue Million Forecast, by Export Market Analysis (Volume and Value) 2019 & 2032
                                                                                                                                  20. Table 20: Global Cashew in Tanzania Market Volume Kiloton Forecast, by Export Market Analysis (Volume and Value) 2019 & 2032
                                                                                                                                  21. Table 21: Global Cashew in Tanzania Market Revenue Million Forecast, by Price Trend Analysis 2019 & 2032
                                                                                                                                  22. Table 22: Global Cashew in Tanzania Market Volume Kiloton Forecast, by Price Trend Analysis 2019 & 2032
                                                                                                                                  23. Table 23: Global Cashew in Tanzania Market Revenue Million Forecast, by Region 2019 & 2032
                                                                                                                                  24. Table 24: Global Cashew in Tanzania Market Volume Kiloton Forecast, by Region 2019 & 2032
                                                                                                                                  25. Table 25: Global Cashew in Tanzania Market Revenue Million Forecast, by Country 2019 & 2032
                                                                                                                                  26. Table 26: Global Cashew in Tanzania Market Volume Kiloton Forecast, by Country 2019 & 2032
                                                                                                                                  27. Table 27: UAE Cashew in Tanzania Market Revenue (Million) Forecast, by Application 2019 & 2032
                                                                                                                                  28. Table 28: UAE Cashew in Tanzania Market Volume (Kiloton) Forecast, by Application 2019 & 2032
                                                                                                                                  29. Table 29: South Africa Cashew in Tanzania Market Revenue (Million) Forecast, by Application 2019 & 2032
                                                                                                                                  30. Table 30: South Africa Cashew in Tanzania Market Volume (Kiloton) Forecast, by Application 2019 & 2032
                                                                                                                                  31. Table 31: Saudi Arabia Cashew in Tanzania Market Revenue (Million) Forecast, by Application 2019 & 2032
                                                                                                                                  32. Table 32: Saudi Arabia Cashew in Tanzania Market Volume (Kiloton) Forecast, by Application 2019 & 2032
                                                                                                                                  33. Table 33: Rest of MEA Cashew in Tanzania Market Revenue (Million) Forecast, by Application 2019 & 2032
                                                                                                                                  34. Table 34: Rest of MEA Cashew in Tanzania Market Volume (Kiloton) Forecast, by Application 2019 & 2032
                                                                                                                                  35. Table 35: Global Cashew in Tanzania Market Revenue Million Forecast, by Production Analysis 2019 & 2032
                                                                                                                                  36. Table 36: Global Cashew in Tanzania Market Volume Kiloton Forecast, by Production Analysis 2019 & 2032
                                                                                                                                  37. Table 37: Global Cashew in Tanzania Market Revenue Million Forecast, by Consumption Analysis (Volume and Value) 2019 & 2032
                                                                                                                                  38. Table 38: Global Cashew in Tanzania Market Volume Kiloton Forecast, by Consumption Analysis (Volume and Value) 2019 & 2032
                                                                                                                                  39. Table 39: Global Cashew in Tanzania Market Revenue Million Forecast, by Import Market Analysis (Volume and Value) 2019 & 2032
                                                                                                                                  40. Table 40: Global Cashew in Tanzania Market Volume Kiloton Forecast, by Import Market Analysis (Volume and Value) 2019 & 2032
                                                                                                                                  41. Table 41: Global Cashew in Tanzania Market Revenue Million Forecast, by Export Market Analysis (Volume and Value) 2019 & 2032
                                                                                                                                  42. Table 42: Global Cashew in Tanzania Market Volume Kiloton Forecast, by Export Market Analysis (Volume and Value) 2019 & 2032
                                                                                                                                  43. Table 43: Global Cashew in Tanzania Market Revenue Million Forecast, by Price Trend Analysis 2019 & 2032
                                                                                                                                  44. Table 44: Global Cashew in Tanzania Market Volume Kiloton Forecast, by Price Trend Analysis 2019 & 2032
                                                                                                                                  45. Table 45: Global Cashew in Tanzania Market Revenue Million Forecast, by Production Analysis 2019 & 2032
                                                                                                                                  46. Table 46: Global Cashew in Tanzania Market Volume Kiloton Forecast, by Production Analysis 2019 & 2032
                                                                                                                                  47. Table 47: Global Cashew in Tanzania Market Revenue Million Forecast, by Consumption Analysis (Volume and Value) 2019 & 2032
                                                                                                                                  48. Table 48: Global Cashew in Tanzania Market Volume Kiloton Forecast, by Consumption Analysis (Volume and Value) 2019 & 2032
                                                                                                                                  49. Table 49: Global Cashew in Tanzania Market Revenue Million Forecast, by Import Market Analysis (Volume and Value) 2019 & 2032
                                                                                                                                  50. Table 50: Global Cashew in Tanzania Market Volume Kiloton Forecast, by Import Market Analysis (Volume and Value) 2019 & 2032
                                                                                                                                  51. Table 51: Global Cashew in Tanzania Market Revenue Million Forecast, by Export Market Analysis (Volume and Value) 2019 & 2032
                                                                                                                                  52. Table 52: Global Cashew in Tanzania Market Volume Kiloton Forecast, by Export Market Analysis (Volume and Value) 2019 & 2032
                                                                                                                                  53. Table 53: Global Cashew in Tanzania Market Revenue Million Forecast, by Price Trend Analysis 2019 & 2032
                                                                                                                                  54. Table 54: Global Cashew in Tanzania Market Volume Kiloton Forecast, by Price Trend Analysis 2019 & 2032
                                                                                                                                  55. Table 55: Global Cashew in Tanzania Market Revenue Million Forecast, by Country 2019 & 2032
                                                                                                                                  56. Table 56: Global Cashew in Tanzania Market Volume Kiloton Forecast, by Country 2019 & 2032
                                                                                                                                  57. Table 57: United States Cashew in Tanzania Market Revenue (Million) Forecast, by Application 2019 & 2032
                                                                                                                                  58. Table 58: United States Cashew in Tanzania Market Volume (Kiloton) Forecast, by Application 2019 & 2032
                                                                                                                                  59. Table 59: Canada Cashew in Tanzania Market Revenue (Million) Forecast, by Application 2019 & 2032
                                                                                                                                  60. Table 60: Canada Cashew in Tanzania Market Volume (Kiloton) Forecast, by Application 2019 & 2032
                                                                                                                                  61. Table 61: Mexico Cashew in Tanzania Market Revenue (Million) Forecast, by Application 2019 & 2032
                                                                                                                                  62. Table 62: Mexico Cashew in Tanzania Market Volume (Kiloton) Forecast, by Application 2019 & 2032
                                                                                                                                  63. Table 63: Global Cashew in Tanzania Market Revenue Million Forecast, by Production Analysis 2019 & 2032
                                                                                                                                  64. Table 64: Global Cashew in Tanzania Market Volume Kiloton Forecast, by Production Analysis 2019 & 2032
                                                                                                                                  65. Table 65: Global Cashew in Tanzania Market Revenue Million Forecast, by Consumption Analysis (Volume and Value) 2019 & 2032
                                                                                                                                  66. Table 66: Global Cashew in Tanzania Market Volume Kiloton Forecast, by Consumption Analysis (Volume and Value) 2019 & 2032
                                                                                                                                  67. Table 67: Global Cashew in Tanzania Market Revenue Million Forecast, by Import Market Analysis (Volume and Value) 2019 & 2032
                                                                                                                                  68. Table 68: Global Cashew in Tanzania Market Volume Kiloton Forecast, by Import Market Analysis (Volume and Value) 2019 & 2032
                                                                                                                                  69. Table 69: Global Cashew in Tanzania Market Revenue Million Forecast, by Export Market Analysis (Volume and Value) 2019 & 2032
                                                                                                                                  70. Table 70: Global Cashew in Tanzania Market Volume Kiloton Forecast, by Export Market Analysis (Volume and Value) 2019 & 2032
                                                                                                                                  71. Table 71: Global Cashew in Tanzania Market Revenue Million Forecast, by Price Trend Analysis 2019 & 2032
                                                                                                                                  72. Table 72: Global Cashew in Tanzania Market Volume Kiloton Forecast, by Price Trend Analysis 2019 & 2032
                                                                                                                                  73. Table 73: Global Cashew in Tanzania Market Revenue Million Forecast, by Production Analysis 2019 & 2032
                                                                                                                                  74. Table 74: Global Cashew in Tanzania Market Volume Kiloton Forecast, by Production Analysis 2019 & 2032
                                                                                                                                  75. Table 75: Global Cashew in Tanzania Market Revenue Million Forecast, by Consumption Analysis (Volume and Value) 2019 & 2032
                                                                                                                                  76. Table 76: Global Cashew in Tanzania Market Volume Kiloton Forecast, by Consumption Analysis (Volume and Value) 2019 & 2032
                                                                                                                                  77. Table 77: Global Cashew in Tanzania Market Revenue Million Forecast, by Import Market Analysis (Volume and Value) 2019 & 2032
                                                                                                                                  78. Table 78: Global Cashew in Tanzania Market Volume Kiloton Forecast, by Import Market Analysis (Volume and Value) 2019 & 2032
                                                                                                                                  79. Table 79: Global Cashew in Tanzania Market Revenue Million Forecast, by Export Market Analysis (Volume and Value) 2019 & 2032
                                                                                                                                  80. Table 80: Global Cashew in Tanzania Market Volume Kiloton Forecast, by Export Market Analysis (Volume and Value) 2019 & 2032
                                                                                                                                  81. Table 81: Global Cashew in Tanzania Market Revenue Million Forecast, by Price Trend Analysis 2019 & 2032
                                                                                                                                  82. Table 82: Global Cashew in Tanzania Market Volume Kiloton Forecast, by Price Trend Analysis 2019 & 2032
                                                                                                                                  83. Table 83: Global Cashew in Tanzania Market Revenue Million Forecast, by Country 2019 & 2032
                                                                                                                                  84. Table 84: Global Cashew in Tanzania Market Volume Kiloton Forecast, by Country 2019 & 2032
                                                                                                                                  85. Table 85: Brazil Cashew in Tanzania Market Revenue (Million) Forecast, by Application 2019 & 2032
                                                                                                                                  86. Table 86: Brazil Cashew in Tanzania Market Volume (Kiloton) Forecast, by Application 2019 & 2032
                                                                                                                                  87. Table 87: Argentina Cashew in Tanzania Market Revenue (Million) Forecast, by Application 2019 & 2032
                                                                                                                                  88. Table 88: Argentina Cashew in Tanzania Market Volume (Kiloton) Forecast, by Application 2019 & 2032
                                                                                                                                  89. Table 89: Rest of South America Cashew in Tanzania Market Revenue (Million) Forecast, by Application 2019 & 2032
                                                                                                                                  90. Table 90: Rest of South America Cashew in Tanzania Market Volume (Kiloton) Forecast, by Application 2019 & 2032
                                                                                                                                  91. Table 91: Global Cashew in Tanzania Market Revenue Million Forecast, by Production Analysis 2019 & 2032
                                                                                                                                  92. Table 92: Global Cashew in Tanzania Market Volume Kiloton Forecast, by Production Analysis 2019 & 2032
                                                                                                                                  93. Table 93: Global Cashew in Tanzania Market Revenue Million Forecast, by Consumption Analysis (Volume and Value) 2019 & 2032
                                                                                                                                  94. Table 94: Global Cashew in Tanzania Market Volume Kiloton Forecast, by Consumption Analysis (Volume and Value) 2019 & 2032
                                                                                                                                  95. Table 95: Global Cashew in Tanzania Market Revenue Million Forecast, by Import Market Analysis (Volume and Value) 2019 & 2032
                                                                                                                                  96. Table 96: Global Cashew in Tanzania Market Volume Kiloton Forecast, by Import Market Analysis (Volume and Value) 2019 & 2032
                                                                                                                                  97. Table 97: Global Cashew in Tanzania Market Revenue Million Forecast, by Export Market Analysis (Volume and Value) 2019 & 2032
                                                                                                                                  98. Table 98: Global Cashew in Tanzania Market Volume Kiloton Forecast, by Export Market Analysis (Volume and Value) 2019 & 2032
                                                                                                                                  99. Table 99: Global Cashew in Tanzania Market Revenue Million Forecast, by Price Trend Analysis 2019 & 2032
                                                                                                                                  100. Table 100: Global Cashew in Tanzania Market Volume Kiloton Forecast, by Price Trend Analysis 2019 & 2032
                                                                                                                                  101. Table 101: Global Cashew in Tanzania Market Revenue Million Forecast, by Production Analysis 2019 & 2032
                                                                                                                                  102. Table 102: Global Cashew in Tanzania Market Volume Kiloton Forecast, by Production Analysis 2019 & 2032
                                                                                                                                  103. Table 103: Global Cashew in Tanzania Market Revenue Million Forecast, by Consumption Analysis (Volume and Value) 2019 & 2032
                                                                                                                                  104. Table 104: Global Cashew in Tanzania Market Volume Kiloton Forecast, by Consumption Analysis (Volume and Value) 2019 & 2032
                                                                                                                                  105. Table 105: Global Cashew in Tanzania Market Revenue Million Forecast, by Import Market Analysis (Volume and Value) 2019 & 2032
                                                                                                                                  106. Table 106: Global Cashew in Tanzania Market Volume Kiloton Forecast, by Import Market Analysis (Volume and Value) 2019 & 2032
                                                                                                                                  107. Table 107: Global Cashew in Tanzania Market Revenue Million Forecast, by Export Market Analysis (Volume and Value) 2019 & 2032
                                                                                                                                  108. Table 108: Global Cashew in Tanzania Market Volume Kiloton Forecast, by Export Market Analysis (Volume and Value) 2019 & 2032
                                                                                                                                  109. Table 109: Global Cashew in Tanzania Market Revenue Million Forecast, by Price Trend Analysis 2019 & 2032
                                                                                                                                  110. Table 110: Global Cashew in Tanzania Market Volume Kiloton Forecast, by Price Trend Analysis 2019 & 2032
                                                                                                                                  111. Table 111: Global Cashew in Tanzania Market Revenue Million Forecast, by Country 2019 & 2032
                                                                                                                                  112. Table 112: Global Cashew in Tanzania Market Volume Kiloton Forecast, by Country 2019 & 2032
                                                                                                                                  113. Table 113: United Kingdom Cashew in Tanzania Market Revenue (Million) Forecast, by Application 2019 & 2032
                                                                                                                                  114. Table 114: United Kingdom Cashew in Tanzania Market Volume (Kiloton) Forecast, by Application 2019 & 2032
                                                                                                                                  115. Table 115: Germany Cashew in Tanzania Market Revenue (Million) Forecast, by Application 2019 & 2032
                                                                                                                                  116. Table 116: Germany Cashew in Tanzania Market Volume (Kiloton) Forecast, by Application 2019 & 2032
                                                                                                                                  117. Table 117: France Cashew in Tanzania Market Revenue (Million) Forecast, by Application 2019 & 2032
                                                                                                                                  118. Table 118: France Cashew in Tanzania Market Volume (Kiloton) Forecast, by Application 2019 & 2032
                                                                                                                                  119. Table 119: Italy Cashew in Tanzania Market Revenue (Million) Forecast, by Application 2019 & 2032
                                                                                                                                  120. Table 120: Italy Cashew in Tanzania Market Volume (Kiloton) Forecast, by Application 2019 & 2032
                                                                                                                                  121. Table 121: Spain Cashew in Tanzania Market Revenue (Million) Forecast, by Application 2019 & 2032
                                                                                                                                  122. Table 122: Spain Cashew in Tanzania Market Volume (Kiloton) Forecast, by Application 2019 & 2032
                                                                                                                                  123. Table 123: Russia Cashew in Tanzania Market Revenue (Million) Forecast, by Application 2019 & 2032
                                                                                                                                  124. Table 124: Russia Cashew in Tanzania Market Volume (Kiloton) Forecast, by Application 2019 & 2032
                                                                                                                                  125. Table 125: Benelux Cashew in Tanzania Market Revenue (Million) Forecast, by Application 2019 & 2032
                                                                                                                                  126. Table 126: Benelux Cashew in Tanzania Market Volume (Kiloton) Forecast, by Application 2019 & 2032
                                                                                                                                  127. Table 127: Nordics Cashew in Tanzania Market Revenue (Million) Forecast, by Application 2019 & 2032
                                                                                                                                  128. Table 128: Nordics Cashew in Tanzania Market Volume (Kiloton) Forecast, by Application 2019 & 2032
                                                                                                                                  129. Table 129: Rest of Europe Cashew in Tanzania Market Revenue (Million) Forecast, by Application 2019 & 2032
                                                                                                                                  130. Table 130: Rest of Europe Cashew in Tanzania Market Volume (Kiloton) Forecast, by Application 2019 & 2032
                                                                                                                                  131. Table 131: Global Cashew in Tanzania Market Revenue Million Forecast, by Production Analysis 2019 & 2032
                                                                                                                                  132. Table 132: Global Cashew in Tanzania Market Volume Kiloton Forecast, by Production Analysis 2019 & 2032
                                                                                                                                  133. Table 133: Global Cashew in Tanzania Market Revenue Million Forecast, by Consumption Analysis (Volume and Value) 2019 & 2032
                                                                                                                                  134. Table 134: Global Cashew in Tanzania Market Volume Kiloton Forecast, by Consumption Analysis (Volume and Value) 2019 & 2032
                                                                                                                                  135. Table 135: Global Cashew in Tanzania Market Revenue Million Forecast, by Import Market Analysis (Volume and Value) 2019 & 2032
                                                                                                                                  136. Table 136: Global Cashew in Tanzania Market Volume Kiloton Forecast, by Import Market Analysis (Volume and Value) 2019 & 2032
                                                                                                                                  137. Table 137: Global Cashew in Tanzania Market Revenue Million Forecast, by Export Market Analysis (Volume and Value) 2019 & 2032
                                                                                                                                  138. Table 138: Global Cashew in Tanzania Market Volume Kiloton Forecast, by Export Market Analysis (Volume and Value) 2019 & 2032
                                                                                                                                  139. Table 139: Global Cashew in Tanzania Market Revenue Million Forecast, by Price Trend Analysis 2019 & 2032
                                                                                                                                  140. Table 140: Global Cashew in Tanzania Market Volume Kiloton Forecast, by Price Trend Analysis 2019 & 2032
                                                                                                                                  141. Table 141: Global Cashew in Tanzania Market Revenue Million Forecast, by Production Analysis 2019 & 2032
                                                                                                                                  142. Table 142: Global Cashew in Tanzania Market Volume Kiloton Forecast, by Production Analysis 2019 & 2032
                                                                                                                                  143. Table 143: Global Cashew in Tanzania Market Revenue Million Forecast, by Consumption Analysis (Volume and Value) 2019 & 2032
                                                                                                                                  144. Table 144: Global Cashew in Tanzania Market Volume Kiloton Forecast, by Consumption Analysis (Volume and Value) 2019 & 2032
                                                                                                                                  145. Table 145: Global Cashew in Tanzania Market Revenue Million Forecast, by Import Market Analysis (Volume and Value) 2019 & 2032
                                                                                                                                  146. Table 146: Global Cashew in Tanzania Market Volume Kiloton Forecast, by Import Market Analysis (Volume and Value) 2019 & 2032
                                                                                                                                  147. Table 147: Global Cashew in Tanzania Market Revenue Million Forecast, by Export Market Analysis (Volume and Value) 2019 & 2032
                                                                                                                                  148. Table 148: Global Cashew in Tanzania Market Volume Kiloton Forecast, by Export Market Analysis (Volume and Value) 2019 & 2032
                                                                                                                                  149. Table 149: Global Cashew in Tanzania Market Revenue Million Forecast, by Price Trend Analysis 2019 & 2032
                                                                                                                                  150. Table 150: Global Cashew in Tanzania Market Volume Kiloton Forecast, by Price Trend Analysis 2019 & 2032
                                                                                                                                  151. Table 151: Global Cashew in Tanzania Market Revenue Million Forecast, by Country 2019 & 2032
                                                                                                                                  152. Table 152: Global Cashew in Tanzania Market Volume Kiloton Forecast, by Country 2019 & 2032
                                                                                                                                  153. Table 153: Turkey Cashew in Tanzania Market Revenue (Million) Forecast, by Application 2019 & 2032
                                                                                                                                  154. Table 154: Turkey Cashew in Tanzania Market Volume (Kiloton) Forecast, by Application 2019 & 2032
                                                                                                                                  155. Table 155: Israel Cashew in Tanzania Market Revenue (Million) Forecast, by Application 2019 & 2032
                                                                                                                                  156. Table 156: Israel Cashew in Tanzania Market Volume (Kiloton) Forecast, by Application 2019 & 2032
                                                                                                                                  157. Table 157: GCC Cashew in Tanzania Market Revenue (Million) Forecast, by Application 2019 & 2032
                                                                                                                                  158. Table 158: GCC Cashew in Tanzania Market Volume (Kiloton) Forecast, by Application 2019 & 2032
                                                                                                                                  159. Table 159: North Africa Cashew in Tanzania Market Revenue (Million) Forecast, by Application 2019 & 2032
                                                                                                                                  160. Table 160: North Africa Cashew in Tanzania Market Volume (Kiloton) Forecast, by Application 2019 & 2032
                                                                                                                                  161. Table 161: South Africa Cashew in Tanzania Market Revenue (Million) Forecast, by Application 2019 & 2032
                                                                                                                                  162. Table 162: South Africa Cashew in Tanzania Market Volume (Kiloton) Forecast, by Application 2019 & 2032
                                                                                                                                  163. Table 163: Rest of Middle East & Africa Cashew in Tanzania Market Revenue (Million) Forecast, by Application 2019 & 2032
                                                                                                                                  164. Table 164: Rest of Middle East & Africa Cashew in Tanzania Market Volume (Kiloton) Forecast, by Application 2019 & 2032
                                                                                                                                  165. Table 165: Global Cashew in Tanzania Market Revenue Million Forecast, by Production Analysis 2019 & 2032
                                                                                                                                  166. Table 166: Global Cashew in Tanzania Market Volume Kiloton Forecast, by Production Analysis 2019 & 2032
                                                                                                                                  167. Table 167: Global Cashew in Tanzania Market Revenue Million Forecast, by Consumption Analysis (Volume and Value) 2019 & 2032
                                                                                                                                  168. Table 168: Global Cashew in Tanzania Market Volume Kiloton Forecast, by Consumption Analysis (Volume and Value) 2019 & 2032
                                                                                                                                  169. Table 169: Global Cashew in Tanzania Market Revenue Million Forecast, by Import Market Analysis (Volume and Value) 2019 & 2032
                                                                                                                                  170. Table 170: Global Cashew in Tanzania Market Volume Kiloton Forecast, by Import Market Analysis (Volume and Value) 2019 & 2032
                                                                                                                                  171. Table 171: Global Cashew in Tanzania Market Revenue Million Forecast, by Export Market Analysis (Volume and Value) 2019 & 2032
                                                                                                                                  172. Table 172: Global Cashew in Tanzania Market Volume Kiloton Forecast, by Export Market Analysis (Volume and Value) 2019 & 2032
                                                                                                                                  173. Table 173: Global Cashew in Tanzania Market Revenue Million Forecast, by Price Trend Analysis 2019 & 2032
                                                                                                                                  174. Table 174: Global Cashew in Tanzania Market Volume Kiloton Forecast, by Price Trend Analysis 2019 & 2032
                                                                                                                                  175. Table 175: Global Cashew in Tanzania Market Revenue Million Forecast, by Production Analysis 2019 & 2032
                                                                                                                                  176. Table 176: Global Cashew in Tanzania Market Volume Kiloton Forecast, by Production Analysis 2019 & 2032
                                                                                                                                  177. Table 177: Global Cashew in Tanzania Market Revenue Million Forecast, by Consumption Analysis (Volume and Value) 2019 & 2032
                                                                                                                                  178. Table 178: Global Cashew in Tanzania Market Volume Kiloton Forecast, by Consumption Analysis (Volume and Value) 2019 & 2032
                                                                                                                                  179. Table 179: Global Cashew in Tanzania Market Revenue Million Forecast, by Import Market Analysis (Volume and Value) 2019 & 2032
                                                                                                                                  180. Table 180: Global Cashew in Tanzania Market Volume Kiloton Forecast, by Import Market Analysis (Volume and Value) 2019 & 2032
                                                                                                                                  181. Table 181: Global Cashew in Tanzania Market Revenue Million Forecast, by Export Market Analysis (Volume and Value) 2019 & 2032
                                                                                                                                  182. Table 182: Global Cashew in Tanzania Market Volume Kiloton Forecast, by Export Market Analysis (Volume and Value) 2019 & 2032
                                                                                                                                  183. Table 183: Global Cashew in Tanzania Market Revenue Million Forecast, by Price Trend Analysis 2019 & 2032
                                                                                                                                  184. Table 184: Global Cashew in Tanzania Market Volume Kiloton Forecast, by Price Trend Analysis 2019 & 2032
                                                                                                                                  185. Table 185: Global Cashew in Tanzania Market Revenue Million Forecast, by Country 2019 & 2032
                                                                                                                                  186. Table 186: Global Cashew in Tanzania Market Volume Kiloton Forecast, by Country 2019 & 2032
                                                                                                                                  187. Table 187: China Cashew in Tanzania Market Revenue (Million) Forecast, by Application 2019 & 2032
                                                                                                                                  188. Table 188: China Cashew in Tanzania Market Volume (Kiloton) Forecast, by Application 2019 & 2032
                                                                                                                                  189. Table 189: India Cashew in Tanzania Market Revenue (Million) Forecast, by Application 2019 & 2032
                                                                                                                                  190. Table 190: India Cashew in Tanzania Market Volume (Kiloton) Forecast, by Application 2019 & 2032
                                                                                                                                  191. Table 191: Japan Cashew in Tanzania Market Revenue (Million) Forecast, by Application 2019 & 2032
                                                                                                                                  192. Table 192: Japan Cashew in Tanzania Market Volume (Kiloton) Forecast, by Application 2019 & 2032
                                                                                                                                  193. Table 193: South Korea Cashew in Tanzania Market Revenue (Million) Forecast, by Application 2019 & 2032
                                                                                                                                  194. Table 194: South Korea Cashew in Tanzania Market Volume (Kiloton) Forecast, by Application 2019 & 2032
                                                                                                                                  195. Table 195: ASEAN Cashew in Tanzania Market Revenue (Million) Forecast, by Application 2019 & 2032
                                                                                                                                  196. Table 196: ASEAN Cashew in Tanzania Market Volume (Kiloton) Forecast, by Application 2019 & 2032
                                                                                                                                  197. Table 197: Oceania Cashew in Tanzania Market Revenue (Million) Forecast, by Application 2019 & 2032
                                                                                                                                  198. Table 198: Oceania Cashew in Tanzania Market Volume (Kiloton) Forecast, by Application 2019 & 2032
                                                                                                                                  199. Table 199: Rest of Asia Pacific Cashew in Tanzania Market Revenue (Million) Forecast, by Application 2019 & 2032
                                                                                                                                  200. Table 200: Rest of Asia Pacific Cashew in Tanzania Market Volume (Kiloton) Forecast, by Application 2019 & 2032


                                                                                                                                  Frequently Asked Questions

                                                                                                                                  1. What is the projected Compound Annual Growth Rate (CAGR) of the Cashew in Tanzania Market?

                                                                                                                                  The projected CAGR is approximately 4.48%.

                                                                                                                                  2. Which companies are prominent players in the Cashew in Tanzania Market?

                                                                                                                                  Key companies in the market include Olam International , Cashewnut Company Ltd , Louis Dreyfus Company, Olam International , Mtwara Cashewnut Processors Limited , Bunge Limited , Tanzania Cashewnut Board , ADM (Archer Daniels Midland Company) , Export Trading Group , Cargill .

                                                                                                                                  3. What are the main segments of the Cashew in Tanzania Market?

                                                                                                                                  The market segments include Production Analysis, Consumption Analysis (Volume and Value), Import Market Analysis (Volume and Value), Export Market Analysis (Volume and Value), Price Trend Analysis, Production Analysis, Consumption Analysis (Volume and Value), Import Market Analysis (Volume and Value), Export Market Analysis (Volume and Value), Price Trend Analysis.

                                                                                                                                  4. Can you provide details about the market size?

                                                                                                                                  The market size is estimated to be USD 690.97 Million as of 2022.

                                                                                                                                  5. What are some drivers contributing to market growth?

                                                                                                                                  N/A

                                                                                                                                  6. What are the notable trends driving market growth?

                                                                                                                                  Increasing Government Support and Growing Production Driving the Market.

                                                                                                                                  7. Are there any restraints impacting market growth?

                                                                                                                                  N/A

                                                                                                                                  8. Can you provide examples of recent developments in the market?

                                                                                                                                  July 2022: Tanzania Investment Center (TIC) revealed that the government of Tanzania is planning to construct cashew nut processing factories in Tanzania in collaboration with local investors to supply value-added cashew nuts in the international market to earn high export value and create employment opportunities for the Tanzanian people.

                                                                                                                                  9. What pricing options are available for accessing the report?

                                                                                                                                  Pricing options include single-user, multi-user, and enterprise licenses priced at USD 3800, USD 4500, and USD 5800 respectively.

                                                                                                                                  10. Is the market size provided in terms of value or volume?

                                                                                                                                  The market size is provided in terms of value, measured in Million and volume, measured in Kiloton.

                                                                                                                                  11. Are there any specific market keywords associated with the report?

                                                                                                                                  Yes, the market keyword associated with the report is "Cashew in Tanzania Market," which aids in identifying and referencing the specific market segment covered.

                                                                                                                                  12. How do I determine which pricing option suits my needs best?

                                                                                                                                  The pricing options vary based on user requirements and access needs. Individual users may opt for single-user licenses, while businesses requiring broader access may choose multi-user or enterprise licenses for cost-effective access to the report.

                                                                                                                                  13. Are there any additional resources or data provided in the Cashew in Tanzania Market report?

                                                                                                                                  While the report offers comprehensive insights, it's advisable to review the specific contents or supplementary materials provided to ascertain if additional resources or data are available.

                                                                                                                                  14. How can I stay updated on further developments or reports in the Cashew in Tanzania Market?

                                                                                                                                  To stay informed about further developments, trends, and reports in the Cashew in Tanzania Market, consider subscribing to industry newsletters, following relevant companies and organizations, or regularly checking reputable industry news sources and publications.


                                                                                                                                  Methodology

                                                                                                                                  Step 1 - Identification of Relevant Samples Size from Population Database

                                                                                                                                  Step Chart
                                                                                                                                  Bar Chart
                                                                                                                                  Method Chart

                                                                                                                                  Step 2 - Approaches for Defining Global Market Size (Value, Volume* & Price*)

                                                                                                                                  Approach Chart
                                                                                                                                  Top-down and bottom-up approaches are used to validate the global market size and estimate the market size for manufactures, regional segments, product, and application.

                                                                                                                                  Note*: In applicable scenarios

                                                                                                                                  Step 3 - Data Sources

                                                                                                                                  Primary Research

                                                                                                                                  • Web Analytics
                                                                                                                                  • Survey Reports
                                                                                                                                  • Research Institute
                                                                                                                                  • Latest Research Reports
                                                                                                                                  • Opinion Leaders

                                                                                                                                  Secondary Research

                                                                                                                                  • Annual Reports
                                                                                                                                  • White Paper
                                                                                                                                  • Latest Press Release
                                                                                                                                  • Industry Association
                                                                                                                                  • Paid Database
                                                                                                                                  • Investor Presentations
                                                                                                                                  Analyst Chart

                                                                                                                                  Step 4 - Data Triangulation

                                                                                                                                  Involves using different sources of information in order to increase the validity of a study

                                                                                                                                  These sources are likely to be stakeholders in a program - participants, other researchers, program staff, other community members, and so on.

                                                                                                                                  Then we put all data in single framework & apply various statistical tools to find out the dynamic on the market.

                                                                                                                                  During the analysis stage, feedback from the stakeholder groups would be compared to determine areas of agreement as well as areas of divergence

                                                                                                                                  Additionally, after gathering mixed and scattered data from a wide range of sources, data is triangulated and correlated to come up with estimated figures which are further validated through primary mediums or industry experts, opinion leaders.

                                                                                                                                  About Report Pinnacle

                                                                                                                                  Report Pinnacle provides top-tier market research, industry intelligence, and actionable insights for finance, technology, healthcare, and consumer sectors. Our reports empower you to make informed decisions and achieve business success.

                                                                                                                                  Our expert team combines primary research, data analytics, and industry knowledge to deliver insights you can trust. We offer syndicated reports, custom research, and consulting services tailored to your unique business needs.

                                                                                                                                  At Report Pinnacle, we are committed to quality, transparency, and client satisfaction. Every report is rigorously validated to ensure accuracy and relevance. Our global perspective and local expertise help you understand both broad trends and detailed market shifts.

                                                                                                                                  Stay ahead with Report Pinnacle. Subscribe to our newsletter for the latest insights and research highlights, and follow us on social media for real-time updates.

                                                                                                                                  Report Pinnacle – Your Partner for Reaching the Top in Market Intelligence.

                                                                                                                                  Business Address

                                                                                                                                  Head Office

                                                                                                                                  Ansec House 3 rd floor Tank Road, Yerwada, Pune, Maharashtra 411014

                                                                                                                                  Contact Information

                                                                                                                                  Craig Francis

                                                                                                                                  Business Development Head

                                                                                                                                  +17162654855

                                                                                                                                  [email protected]

                                                                                                                                  Secure Payment Partners

                                                                                                                                  payment image
                                                                                                                                  RetailLogisticsPackagingAutomotiveHealthcareAgricultureEnergy & PowerFood & BeverageAerospace & DefenseChemicals & MaterialsHospitality and TourismAnimal Nutrition & WellnessConsumer Goods and ServicesReal Estate and ConstructionHome and Property ImprovementTechnology, Media and TelecomManufacturing Products and ServicesFinancial Services and Investment Intelligence

                                                                                                                                  © 2025 PRDUA Research & Media Private Limited, All rights reserved

                                                                                                                                  Privacy Policy
                                                                                                                                  Terms and Conditions
                                                                                                                                  FAQ
                                                                                                                                  • Home
                                                                                                                                  • About Us
                                                                                                                                  • Industries
                                                                                                                                    • Aerospace & Defense
                                                                                                                                    • Agriculture
                                                                                                                                    • Animal Nutrition & Wellness
                                                                                                                                    • Automotive
                                                                                                                                    • Chemicals & Materials
                                                                                                                                    • Consumer Goods and Services
                                                                                                                                    • Energy & Power
                                                                                                                                    • Financial Services and Investment Intelligence
                                                                                                                                    • Food & Beverage
                                                                                                                                    • Home and Property Improvement
                                                                                                                                    • Hospitality and Tourism
                                                                                                                                    • Logistics
                                                                                                                                    • Manufacturing Products and Services
                                                                                                                                    • Packaging
                                                                                                                                    • Professional and Commercial Services
                                                                                                                                    • Real Estate and Construction
                                                                                                                                    • Retail
                                                                                                                                    • Technology, Media and Telecom
                                                                                                                                    • Healthcare
                                                                                                                                  • Services
                                                                                                                                  • Contact
                                                                                                                                  Main Logo
                                                                                                                                  • Home
                                                                                                                                  • About Us
                                                                                                                                  • Industries
                                                                                                                                    • Aerospace & Defense
                                                                                                                                    • Agriculture
                                                                                                                                    • Animal Nutrition & Wellness
                                                                                                                                    • Automotive
                                                                                                                                    • Chemicals & Materials
                                                                                                                                    • Consumer Goods and Services
                                                                                                                                    • Energy & Power
                                                                                                                                    • Financial Services and Investment Intelligence
                                                                                                                                    • Food & Beverage
                                                                                                                                    • Home and Property Improvement
                                                                                                                                    • Hospitality and Tourism
                                                                                                                                    • Logistics
                                                                                                                                    • Manufacturing Products and Services
                                                                                                                                    • Packaging
                                                                                                                                    • Professional and Commercial Services
                                                                                                                                    • Real Estate and Construction
                                                                                                                                    • Retail
                                                                                                                                    • Technology, Media and Telecom
                                                                                                                                    • Healthcare
                                                                                                                                  • Services
                                                                                                                                  • Contact
                                                                                                                                  +17162654855
                                                                                                                                  [email protected]

                                                                                                                                  +17162654855

                                                                                                                                  [email protected]

                                                                                                                                  artwork spiralartwork spiralRelated Reports
                                                                                                                                  artwork underline

                                                                                                                                  Cashew in Tanzania Market Strategic Dynamics: Competitor Analysis 2025-2033

                                                                                                                                  Discover the booming Tanzanian cashew market! Explore its $690.97 million valuation, 4.48% CAGR, key players, and regional trends (2019-2033). Learn about growth drivers, challenges, and future projections in this comprehensive market analysis.

                                                                                                                                  September 2025
                                                                                                                                  Base Year: 2024
                                                                                                                                  No Of Pages: 180
                                                                                                                                  Price: $3800

                                                                                                                                  Emerging Markets Driving Glyphosate Market Growth

                                                                                                                                  Discover the latest insights into the booming glyphosate market, projected to reach [estimated 2033 value] by 2033 with a CAGR of 7.49%. Analyze market trends, segmentation, key players (FMC, Bayer, Syngenta), and regional growth in our comprehensive report. Explore the challenges and opportunities in this dynamic sector.

                                                                                                                                  September 2025
                                                                                                                                  Base Year: 2024
                                                                                                                                  No Of Pages: 180
                                                                                                                                  Price: $4750

                                                                                                                                  Limes Market in Mexico Navigating Dynamics Comprehensive Analysis and Forecasts 2025-2033

                                                                                                                                  Discover the booming Mexican lime market! This in-depth analysis reveals key trends, growth projections (2025-2033), major players, and regional market shares, providing valuable insights for investors and industry professionals. Explore the market size, CAGR, and driving forces behind this vibrant sector.

                                                                                                                                  September 2025
                                                                                                                                  Base Year: 2024
                                                                                                                                  No Of Pages: 180
                                                                                                                                  Price: $3800

                                                                                                                                  Analyzing the Future of United States Biocontrol Agents Market: Key Trends to 2033

                                                                                                                                  Discover the booming US Biocontrol Agents market! This comprehensive analysis reveals key trends, drivers, and restraints influencing growth (CAGR 3.50%) to 2033, with insights into leading companies and market segmentation. Explore the future of sustainable pest management.

                                                                                                                                  September 2025
                                                                                                                                  Base Year: 2024
                                                                                                                                  No Of Pages: 197
                                                                                                                                  Price: $3800

                                                                                                                                  South America Crop Protection Chemicals Market in Focus: Growth Trajectories and Strategic Insights 2025-2033

                                                                                                                                  Discover the booming South American Crop Protection Chemicals market! This in-depth analysis reveals a 16.50% CAGR, driven by growing agricultural sectors, pest pressures, and technological advancements. Explore market segmentation, key players (Bayer, Syngenta, BASF), and regional trends in Brazil, Argentina, and beyond. Learn how to capitalize on this dynamic market.

                                                                                                                                  September 2025
                                                                                                                                  Base Year: 2024
                                                                                                                                  No Of Pages: 197
                                                                                                                                  Price: $3800

                                                                                                                                  Understanding Growth Challenges in Europe Biocontrol Agents Market Market 2025-2033

                                                                                                                                  Discover the booming European biocontrol agents market! This in-depth analysis reveals key trends, drivers, and restraints shaping this €150M+ market (2025), projected to grow at a 3.5% CAGR until 2033. Learn about leading companies, regional insights, and the shift towards sustainable pest management.

                                                                                                                                  September 2025
                                                                                                                                  Base Year: 2024
                                                                                                                                  No Of Pages: 197
                                                                                                                                  Price: $3800

                                                                                                                                  Myanmar Maize Industry 2025-2033: Preparing for Growth and Change

                                                                                                                                  Discover the booming Myanmar maize industry, projected to reach \$30.4 million by 2033 with a 5.90% CAGR. This in-depth analysis explores market drivers, trends, restraints, key players (Dagon Group, Charoen Pokphand Group, etc.), and regional data, providing valuable insights for investors and businesses.

                                                                                                                                  September 2025
                                                                                                                                  Base Year: 2024
                                                                                                                                  No Of Pages: 197
                                                                                                                                  Price: $3800

                                                                                                                                  Indonesia Fungicide Market Report Probes the XXX Million Size, Share, Growth Report and Future Analysis by 2033

                                                                                                                                  The Indonesia Fungicide Market is booming, with a projected CAGR of 16.50% to 2033. Driven by increasing crop diseases and government support, this market offers significant opportunities. Learn about key trends, leading companies (Bayer, Syngenta, BASF), and market segmentation in our comprehensive analysis.

                                                                                                                                  September 2025
                                                                                                                                  Base Year: 2024
                                                                                                                                  No Of Pages: 197
                                                                                                                                  Price: $3800

                                                                                                                                  Emerging Market Insights in Brazil Biocontrol Agents Market: 2025-2033 Overview

                                                                                                                                  Discover the booming Brazil Biocontrol Agents Market! Projected to reach $XX million by 2033 with a 4.56% CAGR, this report analyzes market drivers, trends, restraints, and key players like Syngenta and Koppert. Learn about regional variations and future growth opportunities in sustainable agriculture.

                                                                                                                                  September 2025
                                                                                                                                  Base Year: 2024
                                                                                                                                  No Of Pages: 150
                                                                                                                                  Price: $3800

                                                                                                                                  Exploring Key Trends in Fertilizer Industry in Africa Market

                                                                                                                                  Discover the booming African fertilizer market! This comprehensive analysis reveals a CAGR of 9.02%, driven by population growth and agricultural investment. Explore market size, regional trends, key players (Haifa Group, Foskor, Yara), and future projections for 2025-2033. Learn about the challenges and opportunities in this rapidly expanding sector.

                                                                                                                                  September 2025
                                                                                                                                  Base Year: 2024
                                                                                                                                  No Of Pages: 197
                                                                                                                                  Price: $3800

                                                                                                                                  Strategic Drivers and Barriers in North America Agricultural Enzymes Market Market 2025-2033

                                                                                                                                  Discover the booming North American agricultural enzymes market. This comprehensive analysis reveals a CAGR of 10.40% driven by sustainable farming, technological advancements, and key players like Novozymes and BASF. Explore market size, segmentation, and future trends in this dynamic sector.

                                                                                                                                  September 2025
                                                                                                                                  Base Year: 2024
                                                                                                                                  No Of Pages: 150
                                                                                                                                  Price: $3800

                                                                                                                                  Future Trends Shaping Molecular Breeding Market Growth

                                                                                                                                  The global molecular breeding market is booming, projected to reach [Insert estimated 2033 value based on chart data] by 2033, fueled by advancements in genomic technologies and the urgent need for food security. Learn about market trends, key players (Illumina, Thermo Fisher, etc.), and regional growth in this in-depth analysis.

                                                                                                                                  September 2025
                                                                                                                                  Base Year: 2024
                                                                                                                                  No Of Pages: 150
                                                                                                                                  Price: $4750

                                                                                                                                  Peaches and Nectarines Industry Market Strategies: Trends and Outlook 2025-2033

                                                                                                                                  Discover the booming peaches and nectarines market! Explore key trends, regional insights, and top companies driving growth in this $15 billion industry. Learn about projected market size, CAGR, and future opportunities from 2025-2033.

                                                                                                                                  August 2025
                                                                                                                                  Base Year: 2024
                                                                                                                                  No Of Pages: 150
                                                                                                                                  Price: $4750

                                                                                                                                  Exploring Consumer Shifts in Europe Acaricides Market Market 2025-2033

                                                                                                                                  Discover the latest trends in the burgeoning European acaricide market. Our in-depth analysis reveals a €1.5 billion market (2025 est.) growing at a 5.20% CAGR, driven by increasing pest resistance and high crop yields but constrained by environmental concerns. Explore key players, regional data, and future projections for 2025-2033.

                                                                                                                                  August 2025
                                                                                                                                  Base Year: 2024
                                                                                                                                  No Of Pages: 197
                                                                                                                                  Price: $3800

                                                                                                                                  Exploring Soil Conditioner Market Market Evolution 2025-2033

                                                                                                                                  Discover the booming soil conditioner market! Learn about its projected 5.80% CAGR, key drivers (sustainable agriculture, organic farming), major players (Saint-Gobain, Sanoway), and regional growth trends (Asia Pacific leading). Explore market insights and forecast data for 2025-2033.

                                                                                                                                  August 2025
                                                                                                                                  Base Year: 2024
                                                                                                                                  No Of Pages: 150
                                                                                                                                  Price: $4750

                                                                                                                                  Agricultural Chelate Market Decoded: Comprehensive Analysis and Forecasts 2025-2033

                                                                                                                                  Discover the booming Agricultural Chelate Market! Explore key trends, growth drivers, regional analysis, and leading companies shaping this $XX million market projected to reach [estimated 2033 value] by 2033, with a 7.5% CAGR. Learn about synthetic vs. organic chelates and their applications in soil, foliar, and fertigation.

                                                                                                                                  August 2025
                                                                                                                                  Base Year: 2024
                                                                                                                                  No Of Pages: 150
                                                                                                                                  Price: $4750

                                                                                                                                  Cameroon Grains Industry XX CAGR Growth Outlook 2025-2033

                                                                                                                                  Discover the thriving Cameroon grains industry! This comprehensive market analysis reveals a CAGR of 4.80%, driven by population growth and evolving consumer preferences. Explore market size, key players (Sodecoton, CDC, Herakles Farms), and future trends in cereals, pulses, and oilseeds from 2025-2033.

                                                                                                                                  August 2025
                                                                                                                                  Base Year: 2024
                                                                                                                                  No Of Pages: 180
                                                                                                                                  Price: $3800

                                                                                                                                  Aquaponics Industry 2025-2033 Overview: Trends, Competitor Dynamics, and Opportunities

                                                                                                                                  Discover the booming aquaponics market! This comprehensive analysis reveals a $1.21B market in 2025, projected to reach over $2.5B by 2033, driven by sustainable food trends and technological advancements. Explore market segments, key players, and regional growth opportunities in this in-depth report.

                                                                                                                                  August 2025
                                                                                                                                  Base Year: 2024
                                                                                                                                  No Of Pages: 150
                                                                                                                                  Price: $4750

                                                                                                                                  North America Agricultural Robots and Mechatronics Market Analysis Report 2025: Market to Grow by a CAGR of XX to 2033, Driven by Government Incentives, Popularity of Virtual Assistants, and Strategic Partnerships

                                                                                                                                  The North American Agricultural Robots & Mechatronics Market is booming, projected to reach $5.325 Billion by 2033, fueled by automation needs and technological advancements. Learn about market trends, key players, and regional insights in this comprehensive analysis.

                                                                                                                                  August 2025
                                                                                                                                  Base Year: 2024
                                                                                                                                  No Of Pages: 234
                                                                                                                                  Price: $4750

                                                                                                                                  Europe Fungicide Market Market’s Consumer Insights and Trends

                                                                                                                                  The European fungicide market is booming, projected to reach €[Estimated Value in 2033 based on CAGR] by 2033, driven by rising crop diseases and increasing adoption of advanced fungicides. Explore market trends, key players (BASF, Bayer, Syngenta), and regional insights in this comprehensive analysis.

                                                                                                                                  August 2025
                                                                                                                                  Base Year: 2024
                                                                                                                                  No Of Pages: 180
                                                                                                                                  Price: $3800

                                                                                                                                  Consumer-Centric Trends in Japan Seed Treatment Market Industry

                                                                                                                                  Discover the booming Japan seed treatment market forecast to 2033! This in-depth analysis reveals a CAGR of 7.40%, driven by demand for high-yield crops and sustainable agriculture. Learn about key players, market segmentation (chemical vs. non-chemical, crop types), and regional trends. Get insights into growth drivers, restraints, and future projections for this lucrative market.

                                                                                                                                  August 2025
                                                                                                                                  Base Year: 2024
                                                                                                                                  No Of Pages: 150
                                                                                                                                  Price: $3800

                                                                                                                                  North America Organic Fertilizers Market Competitor Insights: Trends and Opportunities 2025-2033

                                                                                                                                  Discover the booming North American organic fertilizers market! This comprehensive analysis reveals key trends, growth drivers (like increasing consumer demand and sustainable farming), restraints, and leading companies from 2019-2033. Explore market segmentation by form, crop type, and region (US, Canada, Mexico). Learn how this $2.5 billion market is poised for continued expansion.

                                                                                                                                  August 2025
                                                                                                                                  Base Year: 2024
                                                                                                                                  No Of Pages: 197
                                                                                                                                  Price: $3800

                                                                                                                                  Strategizing Growth: Germany Haying & Forage Machinery Market Market’s Decade Ahead 2025-2033

                                                                                                                                  Discover the dynamic Germany Haying & Forage Machinery Market, poised for steady growth with a 3.50% CAGR. Explore market drivers, trends, and key players like Deere, CLAAS, and Kubota. This detailed analysis reveals insights into regional variations and segment performance, projecting market size and growth through 2033.

                                                                                                                                  August 2025
                                                                                                                                  Base Year: 2024
                                                                                                                                  No Of Pages: 150
                                                                                                                                  Price: $3800

                                                                                                                                  Strategic Projections for Bacterial Biopesticide Market Market Expansion

                                                                                                                                  Discover the booming bacterial biopesticide market! This comprehensive analysis reveals a CAGR of 12.80%, driven by sustainable agriculture and concerns over chemical pesticides. Explore market size, segmentation (Bacillus thuringiensis, seed treatment, etc.), key players, and regional trends (North America, Europe, Asia-Pacific) for 2019-2033.

                                                                                                                                  August 2025
                                                                                                                                  Base Year: 2024
                                                                                                                                  No Of Pages: 180
                                                                                                                                  Price: $4750

                                                                                                                                  Cashews Market in South America Market’s Technological Evolution: Trends and Analysis 2025-2033

                                                                                                                                  Discover the booming South American cashew market! This in-depth analysis reveals a $582.24M market in 2025, projected to grow at a 5.20% CAGR until 2033. Explore key trends, drivers, restraints, and leading companies shaping this lucrative sector. Learn about market segmentation and regional variations.

                                                                                                                                  August 2025
                                                                                                                                  Base Year: 2024
                                                                                                                                  No Of Pages: 180
                                                                                                                                  Price: $3800

                                                                                                                                  Understanding Consumer Behavior in Quinoa Seed Industry Market: 2025-2033

                                                                                                                                  Discover the booming quinoa seed market! This comprehensive analysis reveals a $1.3B market (2025) with a 10.16% CAGR, driven by health trends & growing demand. Explore market segmentation, key players, and regional insights to understand this lucrative opportunity.

                                                                                                                                  August 2025
                                                                                                                                  Base Year: 2024
                                                                                                                                  No Of Pages: 150
                                                                                                                                  Price: $4750

                                                                                                                                  South America Herbicide Market Market Overview: Trends and Strategic Forecasts 2025-2033

                                                                                                                                  Discover the booming South American herbicide market! This comprehensive analysis reveals a CAGR of 16.50%, driven by growing food demands and modern farming. Explore key players, application methods, and regional trends impacting Brazil, Argentina, and Chile until 2033. Learn more!

                                                                                                                                  August 2025
                                                                                                                                  Base Year: 2024
                                                                                                                                  No Of Pages: 197
                                                                                                                                  Price: $3800

                                                                                                                                  Asia Pacific Seed Treatment Market Consumer Behavior Dynamics: Key Trends 2025-2033

                                                                                                                                  Discover the booming Asia-Pacific seed treatment market forecast to 2033. This comprehensive analysis reveals key growth drivers, regional trends, leading companies like Syngenta and Bayer, and market segmentation by crop type and function (fungicide, insecticide, nematicide). Learn about the opportunities and challenges shaping this dynamic sector.

                                                                                                                                  August 2025
                                                                                                                                  Base Year: 2024
                                                                                                                                  No Of Pages: 150
                                                                                                                                  Price: $3800

                                                                                                                                  Emerging Market Insights in Liquid Fertilizers Market: 2025-2033 Overview

                                                                                                                                  Discover the booming liquid fertilizers market! This comprehensive analysis reveals a CAGR of 3.80% through 2033, driven by precision agriculture and high-yield crop demands. Explore market segments, key players (Nortox, Yara, IFFCO), and regional trends impacting this dynamic industry.

                                                                                                                                  August 2025
                                                                                                                                  Base Year: 2024
                                                                                                                                  No Of Pages: 150
                                                                                                                                  Price: $3800

                                                                                                                                  Insights into Hydroponics Industry Industry Dynamics

                                                                                                                                  Discover the booming hydroponics market! This comprehensive analysis reveals a $5.06B industry with a 7.80% CAGR, driven by urbanization, consumer demand, and technological advancements. Explore regional trends, key players, and future growth projections for hydroponic systems, including various crop types.

                                                                                                                                  August 2025
                                                                                                                                  Base Year: 2024
                                                                                                                                  No Of Pages: 150
                                                                                                                                  Price: $4750

                                                                                                                                  Canada Nematicides Market Market Growth Fueled by CAGR to XXX Million by 2033

                                                                                                                                  Discover the latest trends and growth projections for the Canadian nematicides market (2025-2033). This comprehensive analysis covers market size, CAGR, key drivers, restraints, segmentation by nematicide type and application, and regional insights. Learn about leading companies and future opportunities in the Canadian agricultural sector.

                                                                                                                                  August 2025
                                                                                                                                  Base Year: 2024
                                                                                                                                  No Of Pages: 197
                                                                                                                                  Price: $3800

                                                                                                                                  Europe Chia Seeds Market Market’s Consumer Preferences: Trends and Analysis 2025-2033

                                                                                                                                  Discover the booming European chia seeds market! This comprehensive analysis reveals key trends, market size (€414.2M in 2025), CAGR, leading players, and future projections to 2033. Learn about market segmentation, driving factors, and growth opportunities in this lucrative health food sector.

                                                                                                                                  August 2025
                                                                                                                                  Base Year: 2024
                                                                                                                                  No Of Pages: 180
                                                                                                                                  Price: $4750

                                                                                                                                  Regional Insights into Asia-Pacific Controlled Release Fertilizer Market Market Growth

                                                                                                                                  Discover the booming Asia-Pacific Controlled Release Fertilizer market! Explore its 6.70% CAGR, key drivers, restraints, leading companies (like ICL Group & Grupa Azoty), and regional insights (China, India, Japan). Projecting to 2033, this in-depth analysis reveals growth opportunities and market trends within the agricultural sector.

                                                                                                                                  August 2025
                                                                                                                                  Base Year: 2024
                                                                                                                                  No Of Pages: 150
                                                                                                                                  Price: $3800

                                                                                                                                  Growth Catalysts in Nutrition Canary Seed Market Market

                                                                                                                                  Discover the latest insights into the booming nutrition canary seed market. Explore market size, CAGR, key drivers, trends, and regional analysis for this high-growth sector, projected to reach significant value by 2033. Learn about major players and investment opportunities.

                                                                                                                                  August 2025
                                                                                                                                  Base Year: 2024
                                                                                                                                  No Of Pages: 234
                                                                                                                                  Price: $4750

                                                                                                                                  Key Drivers for Agricultural Surfactant Market Market Growth: Projections 2025-2033

                                                                                                                                  The agricultural surfactant market is booming, projected to reach [estimated 2033 market size] by 2033, with a CAGR of 6.70%. Discover key trends, drivers, and restraints shaping this dynamic sector, including the rise of bio-based surfactants and the impact of sustainable agriculture. Learn about major players like Clariant, BASF, and more.

                                                                                                                                  August 2025
                                                                                                                                  Base Year: 2024
                                                                                                                                  No Of Pages: 234
                                                                                                                                  Price: $4750

                                                                                                                                  Fertilizer Market in India in Emerging Markets: Analysis and Projections 2025-2033

                                                                                                                                  Discover the booming Indian fertilizer market! This in-depth analysis reveals a ₹30 billion (USD 30 Billion) market in 2025, projected to reach ₹450 billion (USD 55 Billion) by 2033 at a CAGR of 6.5%. Explore key drivers, trends, restraints, and regional insights. Learn about leading players like Coromandel International and Yara International. Get your competitive edge now!

                                                                                                                                  August 2025
                                                                                                                                  Base Year: 2024
                                                                                                                                  No Of Pages: 197
                                                                                                                                  Price: $3800

                                                                                                                                  Strategizing Growth: Agrochemicals Market in South America Market’s Decade Ahead 2025-2033

                                                                                                                                  Discover the booming South American agrochemicals market! This comprehensive analysis reveals key trends, drivers, and restraints influencing growth in Brazil, Argentina, and beyond. Learn about market size, CAGR, top players (ADM, Syngenta, BASF), and the future of fertilizers, pesticides, and other agrochemicals in the region. Projecting a CAGR of 4.10%, this report offers valuable insights for investors and industry professionals.

                                                                                                                                  August 2025
                                                                                                                                  Base Year: 2024
                                                                                                                                  No Of Pages: 197
                                                                                                                                  Price: $3800

                                                                                                                                  Seed Processing Machines Market Future-proof Strategies: Trends, Competitor Dynamics, and Opportunities 2025-2033

                                                                                                                                  The global seed processing machines market is booming, projected to reach $7.27 billion by 2033, driven by increasing demand for high-quality seeds and technological advancements. Explore market trends, key players (Cimbria, Alvan Blanch, etc.), and regional insights in this comprehensive analysis.

                                                                                                                                  August 2025
                                                                                                                                  Base Year: 2024
                                                                                                                                  No Of Pages: 234
                                                                                                                                  Price: $4750

                                                                                                                                  Strategic Drivers of Growth in Cotton Trade Analysis Market Industry

                                                                                                                                  Discover the booming global cotton trade market! Our comprehensive analysis reveals a $60B market in 2025, projected to reach over $85B by 2033, driven by textile and non-woven industry growth. Explore key trends, restraints, and regional insights.

                                                                                                                                  August 2025
                                                                                                                                  Base Year: 2024
                                                                                                                                  No Of Pages: 150
                                                                                                                                  Price: $4750

                                                                                                                                  USA Cashew Market: Growth Opportunities and Competitive Landscape Overview 2025-2033

                                                                                                                                  Discover the booming US cashew market! This in-depth analysis reveals key trends, growth drivers, and leading companies in the $2.5B industry. Learn about market size, CAGR, and future projections for roasted cashews, cashew butter, and more.

                                                                                                                                  August 2025
                                                                                                                                  Base Year: 2024
                                                                                                                                  No Of Pages: 180
                                                                                                                                  Price: $3800

                                                                                                                                  Australia Biopesticides Industry XX CAGR Growth Outlook 2025-2033

                                                                                                                                  The Australian biopesticides market is booming, projected to reach $140 million by 2033 with a 7.3% CAGR. Driven by consumer demand for organic produce and stricter regulations, this report analyzes market trends, segments (bioherbicides, bioinsecticides etc.), key players (Bayer, Valent etc.), and future growth potential.

                                                                                                                                  August 2025
                                                                                                                                  Base Year: 2024
                                                                                                                                  No Of Pages: 150
                                                                                                                                  Price: $3800

                                                                                                                                  Potash Fertilizer Market in Africa Future-Proofing Growth: Strategic Insights and Analysis 2025-2033

                                                                                                                                  Discover the booming African potash fertilizer market! This in-depth analysis reveals a CAGR of 7.40% through 2033, driven by food security needs and government initiatives. Explore key market drivers, restraints, and regional breakdowns for South Africa, Nigeria, Egypt, and more. Learn about top companies and investment opportunities in this lucrative sector.

                                                                                                                                  August 2025
                                                                                                                                  Base Year: 2024
                                                                                                                                  No Of Pages: 150
                                                                                                                                  Price: $3800

                                                                                                                                  Thai Seed Market Market’s Evolutionary Trends 2025-2033

                                                                                                                                  Discover the booming Thai seed market! Explore its 16.50% CAGR, key drivers, major players (DCM Shriram, Limagrain, Rijk Zwaan), and future trends impacting hybrid seeds, vegetable cultivation, and agricultural technology in Thailand. Get insights into market segmentation and regional analysis.

                                                                                                                                  August 2025
                                                                                                                                  Base Year: 2024
                                                                                                                                  No Of Pages: 197
                                                                                                                                  Price: $3800

                                                                                                                                  Strategic Vision for Russia Specialty Fertilizer Market Industry Trends

                                                                                                                                  Discover the booming Russia specialty fertilizer market! This comprehensive analysis reveals key trends, drivers, and restraints impacting growth from 2019-2033. Learn about market segmentation, key players, and regional insights. Projected to reach $X million by 2033, this market offers significant opportunities for investors and businesses.

                                                                                                                                  August 2025
                                                                                                                                  Base Year: 2024
                                                                                                                                  No Of Pages: 150
                                                                                                                                  Price: $3800

                                                                                                                                  Position Sensor Market Industry’s Evolution and Growth Pathways

                                                                                                                                  The global position sensor market is booming, projected to reach $25.55 billion by 2033, driven by automation in agriculture, industrial automation, and smart farming. Explore market trends, key players (Honeywell, Balluff, etc.), and segment analysis in this comprehensive report.

                                                                                                                                  August 2025
                                                                                                                                  Base Year: 2024
                                                                                                                                  No Of Pages: 150
                                                                                                                                  Price: $4750

                                                                                                                                  Comprehensive Insights into Sunflower Oil Market: Trends and Growth Projections 2025-2033

                                                                                                                                  Discover the booming sunflower oil market! Explore its $40.59B valuation, 3.01% CAGR, key segments (refined, unrefined, cooking oil, cosmetics), top players (Cargill, Olam), and regional growth projections (Asia-Pacific leading). Get insights into market trends and future opportunities in this comprehensive analysis.

                                                                                                                                  August 2025
                                                                                                                                  Base Year: 2024
                                                                                                                                  No Of Pages: 180
                                                                                                                                  Price: $4750

                                                                                                                                  Strategic Projections for Europe Controlled Release Fertilizer Industry Market Expansion

                                                                                                                                  The European controlled-release fertilizer market is booming, projected to reach €Y million by 2033 with a CAGR of 5.03%. Discover key trends, growth drivers, and leading companies shaping this sustainable agriculture sector. Learn more about market segmentation, regional analysis, and future projections for controlled release fertilizers in Europe.

                                                                                                                                  August 2025
                                                                                                                                  Base Year: 2024
                                                                                                                                  No Of Pages: 150
                                                                                                                                  Price: $3800

                                                                                                                                  Vietnam Combine Harvesters Industry Market Report: Strategic Insights

                                                                                                                                  Discover the booming Vietnam combine harvester market! This in-depth analysis reveals a CAGR of 11.90%, driven by agricultural modernization and rising demand. Explore market size, key players (Yanmar, CLAAS, Kubota), segment trends (TOT, wheeled, track-type), and future projections to 2033. Learn how this $135.35 million market is shaping Vietnamese agriculture.

                                                                                                                                  August 2025
                                                                                                                                  Base Year: 2024
                                                                                                                                  No Of Pages: 150
                                                                                                                                  Price: $3800

                                                                                                                                  Europe Agricultural Irrigation Machinery Market: Growth Opportunities and Competitive Landscape Overview 2025-2033

                                                                                                                                  Discover the booming European agricultural irrigation machinery market! Projected to reach €[Estimated Value] by 2025, this market is driven by drought, sustainability initiatives, and technological advancements like smart irrigation and precision agriculture. Learn about key players, market trends, and future growth projections in our comprehensive analysis.

                                                                                                                                  August 2025
                                                                                                                                  Base Year: 2024
                                                                                                                                  No Of Pages: 150
                                                                                                                                  Price: $3800

                                                                                                                                  Myanmar Seed Industry Future-Proofing Growth: Strategic Insights and Analysis 2025-2033

                                                                                                                                  Discover the burgeoning Myanmar seed industry, projected to reach $162.4 million by 2033, driven by high-yielding crop demands and technological advancements. Explore market trends, key players (Groupe Limagrain, East-West Seed, CP Group), and growth opportunities in this dynamic sector.

                                                                                                                                  August 2025
                                                                                                                                  Base Year: 2024
                                                                                                                                  No Of Pages: 180
                                                                                                                                  Price: $3800