

Key Insights
The global ceramic boost sprays market is poised for substantial expansion, driven by an increasing consumer demand for enhanced vehicle aesthetics and long-lasting paint protection. With an estimated market size of $9.75 billion in 2025, the market is projected to experience a robust CAGR of 15.91% over the forecast period of 2025-2033. This impressive growth trajectory is fueled by several key factors, including the rising popularity of DIY car care solutions, greater awareness of the benefits of ceramic coatings for vehicles, and the continuous innovation in product formulations. The drivers for this market are multifaceted, encompassing the growing automotive aftermarket industry, increasing disposable incomes, and the desire among vehicle owners to preserve the resale value of their cars. Furthermore, advancements in water-based formulations are also contributing significantly, offering environmentally friendly alternatives that align with growing sustainability concerns.
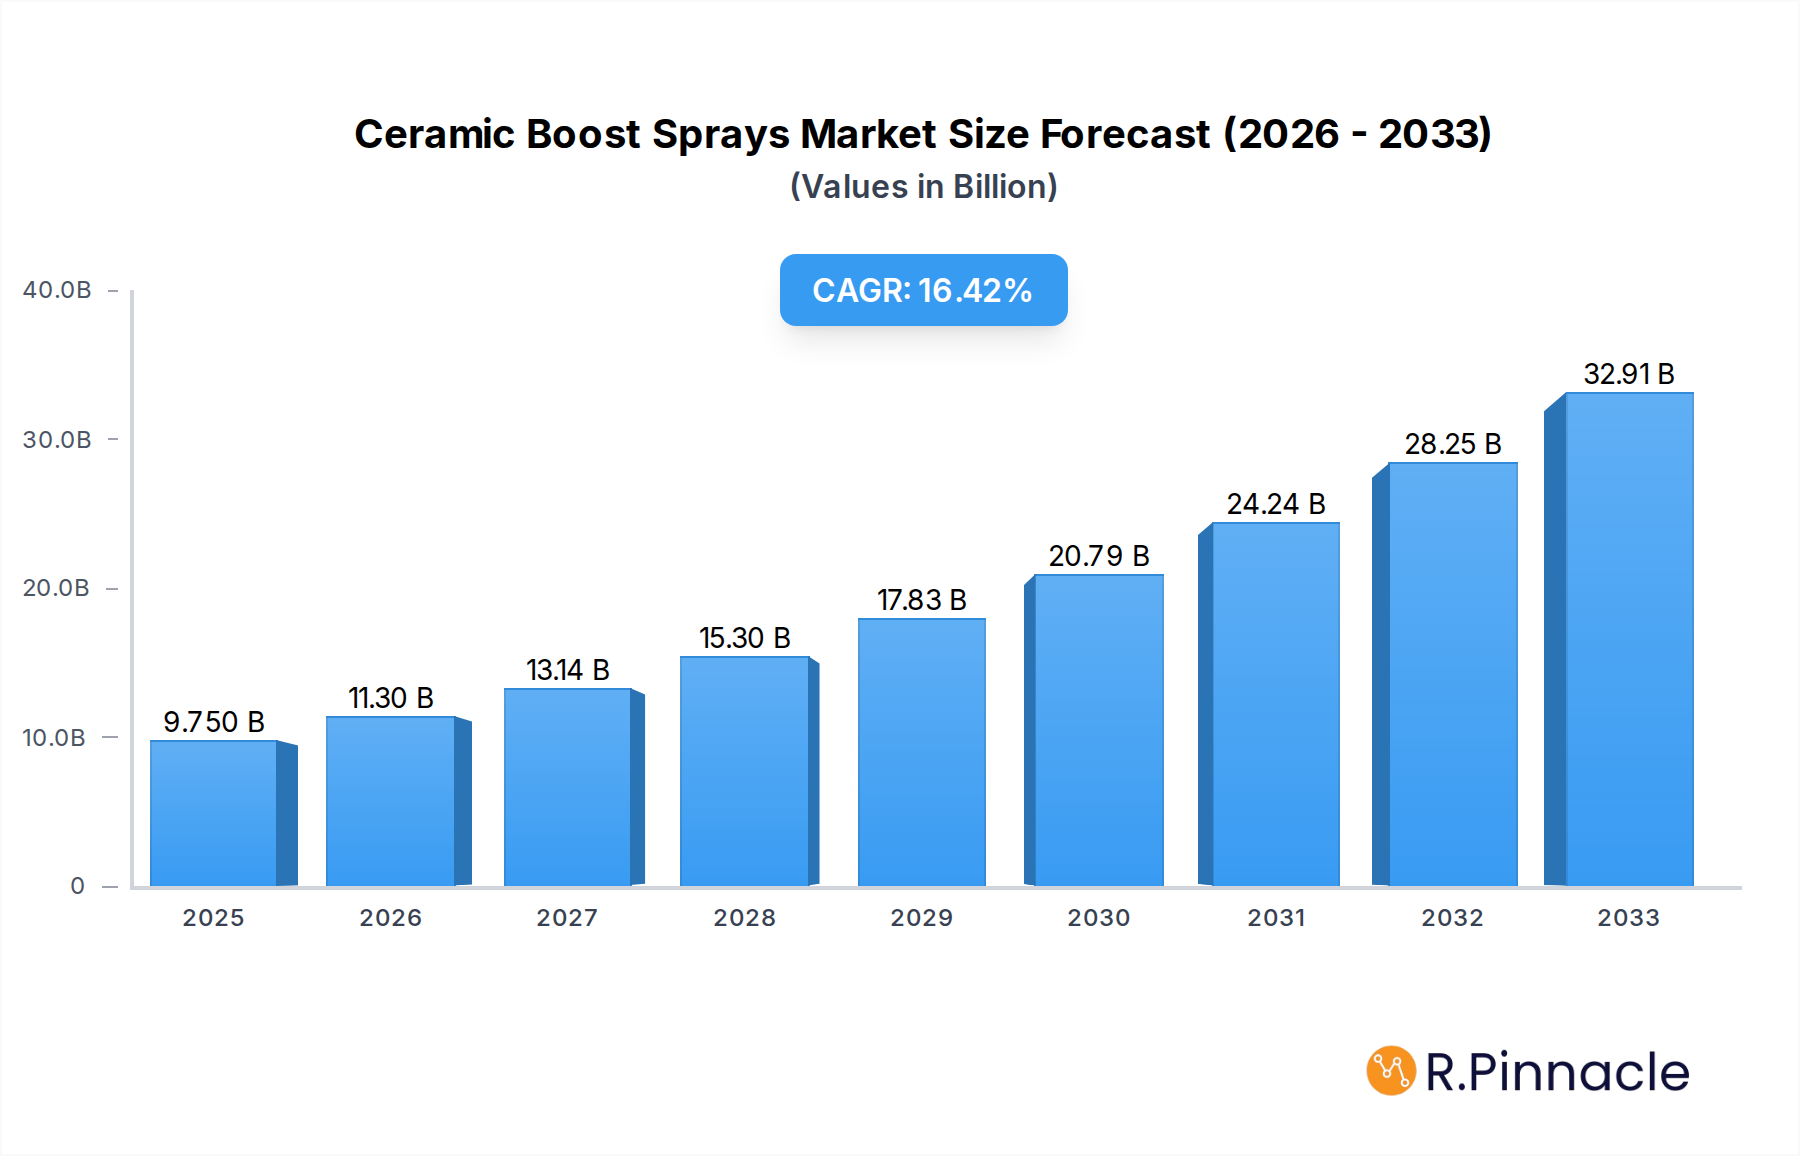
Ceramic Boost Sprays Market Size (In Billion)
The market is segmented by application into household, commercial, and industrial segments, with the household segment likely leading due to the proliferation of car enthusiasts and the ease of application of boost sprays. In terms of types, water-based and silicone-based formulations cater to diverse consumer preferences and performance requirements, with water-based products gaining traction for their eco-friendliness. Despite the optimistic outlook, certain restraints may emerge, such as the initial cost perception of ceramic-infused products compared to traditional waxes and sealants, and the potential need for specialized knowledge for optimal application, although modern boost sprays are designed for ease of use. Key players like 3M, Adam's Polishes, and XPEL Inc. are actively innovating and expanding their product portfolios to capture market share. The trends indicate a move towards user-friendly, spray-and-wipe applications that deliver superior gloss, hydrophobicity, and UV protection, making ceramic boost sprays a highly sought-after product in automotive detailing.

Ceramic Boost Sprays Company Market Share
This comprehensive Ceramic Boost Sprays Market report provides an in-depth analysis of the rapidly evolving global market, offering actionable insights for industry professionals. Covering a study period from 2019 to 2033, with a base year of 2025 and a forecast period extending to 2033, this report delves into market structure, dynamics, regional dominance, product innovations, key drivers, challenges, emerging opportunities, and the future outlook. Leveraging high-ranking keywords such as "ceramic coating spray," "automotive ceramic spray," "detailing spray," and "hydrophobic coating," this report is meticulously crafted to maximize search visibility and engage stakeholders across the automotive detailing, car care, and related industries.
Ceramic Boost Sprays Market Structure & Innovation Trends
The global Ceramic Boost Sprays market exhibits a moderate to high concentration, with leading players like 3M, Adam's Polishes, XPEL Inc, NANOSKIN Car Care Products, Meguiar's, Chemical Guys, and FEYNLAB Inc holding significant market share, estimated in the hundreds of billions of dollars. Innovation is the primary driver, fueled by advancements in nanotechnology and polymer science, leading to enhanced durability, hydrophobic properties, and ease of application for ceramic coating sprays. Regulatory frameworks, primarily focused on VOC emissions and product safety, are becoming more stringent, influencing product formulations and manufacturing processes. Product substitutes, such as traditional waxes and sealants, continue to compete, but the superior performance and longevity of ceramic boost sprays are driving market penetration. End-user demographics are broadening, encompassing both professional detailers and DIY enthusiasts seeking superior automotive protection and aesthetic appeal. Merger and acquisition (M&A) activities are anticipated to increase, with an estimated tens of billions of dollars in deal values, as larger companies seek to consolidate market share and acquire innovative technologies. Key M&A activities are expected to focus on companies with proprietary ceramic formulations and strong distribution networks.
Ceramic Boost Sprays Market Dynamics & Trends
The Ceramic Boost Sprays market is experiencing robust growth, projected to witness a Compound Annual Growth Rate (CAGR) of XX% between 2025 and 2033. This expansion is primarily propelled by an escalating consumer demand for long-lasting, high-performance automotive protection solutions that go beyond traditional waxing and sealing. The increasing awareness among vehicle owners regarding the benefits of ceramic coatings, such as enhanced gloss, superior scratch resistance, and exceptional water repellency (hydrophobic properties), is a significant market growth driver. Technological disruptions, particularly in the realm of nanotechnology and advanced polymer science, are continuously leading to the development of more durable, easier-to-apply, and cost-effective ceramic boost spray formulations. The accessibility of these advanced products has also broadened their appeal to a wider consumer base, further accelerating market penetration.
Consumer preferences are shifting towards DIY-friendly products that offer professional-grade results. This trend is evident in the popularity of sprayable ceramic coatings that require minimal specialized equipment or training for application. The competitive landscape is dynamic, characterized by intense innovation and strategic collaborations. Key players are investing heavily in research and development to introduce novel formulations that offer enhanced UV protection, chemical resistance, and ease of maintenance. The market penetration of ceramic boost sprays is steadily increasing, driven by effective marketing campaigns highlighting their long-term value proposition and superior aesthetic enhancement compared to conventional car care products. The rise of online retail channels and direct-to-consumer sales models is also playing a crucial role in expanding the reach of these products to a global audience. Furthermore, the growing customization trend in the automotive sector, where owners seek to personalize and protect their vehicles, is creating a sustained demand for advanced detailing solutions like ceramic boost sprays. The increasing adoption of these products in commercial applications, such as fleet management and professional car washes, is also contributing significantly to the overall market growth, underpinning the projected billion-dollar market valuation.
Dominant Regions & Segments in Ceramic Boost Sprays
North America currently stands as the dominant region in the global Ceramic Boost Sprays market, with the United States spearheading this leadership. This dominance is underpinned by a combination of strong economic policies supporting the automotive aftermarket industry, a highly developed automotive infrastructure, and a large, affluent consumer base with a high propensity to invest in premium car care products. The strong culture of car enthusiasm and meticulous vehicle maintenance in the U.S. directly translates into a substantial demand for advanced detailing solutions like ceramic boost sprays.
- Key Drivers of Dominance in North America:
- High Disposable Income: Consumers in the U.S. possess significant disposable income, allowing for discretionary spending on premium automotive detailing products.
- Robust Automotive Aftermarket: The U.S. boasts one of the largest and most mature automotive aftermarket sectors globally, providing a fertile ground for specialized products.
- Awareness and Adoption: High levels of consumer awareness regarding the benefits of ceramic coatings and a rapid adoption rate of new automotive technologies.
- Strong Distribution Networks: Well-established distribution channels, including major automotive retailers, online platforms, and professional detailing supply houses, ensure product availability.
- Innovation Hub: The presence of leading automotive chemical manufacturers and detailing brands fosters continuous product innovation and development within the region.
Within the Application segment, Commercial applications are demonstrating significant growth potential, driven by professional auto detailing businesses, car dealerships, and fleet management companies seeking to offer superior protection and value-added services. The Industrial segment, while smaller, presents niche opportunities in protective coatings for specialized vehicles and equipment. In terms of Types, Water-Based ceramic boost sprays are gaining traction due to their lower VOC content and ease of cleanup, aligning with growing environmental consciousness, though Silicone-Based formulations continue to offer robust durability and hydrophobicity, catering to performance-oriented users. The market size for these segments is collectively estimated in the hundreds of billions of dollars, with continued growth projected across all segments.
Ceramic Boost Sprays Product Innovations
Product innovations in the Ceramic Boost Sprays market are centered on enhancing user experience and performance. Developments focus on creating spray-on ceramic coatings with superior hydrophobic properties, exceptional gloss, and long-lasting protection against environmental contaminants and minor abrasions. Self-healing capabilities and UV-resistant formulations are emerging trends, offering advanced protection and aesthetic appeal. Competitive advantages are derived from ease of application, rapid curing times, and the ability to deliver professional-grade results for both DIY enthusiasts and professional detailers. The integration of nanotechnology continues to be a key differentiator, enabling thinner, more durable, and highly effective ceramic layers. These advancements are directly addressing the evolving needs of the automotive care industry, positioning ceramic boost sprays as the premium solution for vehicle protection and enhancement.
Report Scope & Segmentation Analysis
This report meticulously segments the Ceramic Boost Sprays market across key categories to provide granular insights. The Application segment is divided into:
- Household: Primarily focusing on individual vehicle owners for personal use, contributing a significant portion to the market's tens of billions of dollars valuation, with projections indicating steady growth.
- Commercial: Encompassing professional auto detailing shops, car washes, and dealerships, this segment is experiencing robust expansion, estimated to reach hundreds of billions of dollars in market size due to increased adoption for service offerings and competitive differentiation.
- Industrial: Addressing specialized applications in protective coatings for commercial fleets and industrial vehicles, this niche segment, while smaller, offers significant growth potential in the billions of dollars range.
The Types segment is further categorized into:
- Water-Based: Gaining popularity due to environmental considerations and ease of use, with projected growth to exceed hundreds of billions of dollars in market value.
- Silicone-Based: Continuing to dominate due to superior durability and hydrophobic performance, with an established market size in the hundreds of billions of dollars and sustained demand.
Key Drivers of Ceramic Boost Sprays Growth
The exponential growth in the Ceramic Boost Sprays market is propelled by several interconnected factors. Technological advancements in nanotechnology and advanced polymer formulations are at the forefront, enabling the creation of highly durable, hydrophobic, and easy-to-apply ceramic coatings. This innovation directly addresses the increasing consumer demand for superior vehicle protection and a showroom-quality finish. Economically, the rising disposable incomes globally, particularly in emerging economies, are enabling a larger segment of the population to invest in premium automotive care solutions. The growing awareness of the long-term cost savings associated with ceramic coatings, such as reduced need for frequent washing and protection against paint damage, further fuels adoption. Regulatory frameworks, while sometimes presenting challenges, are also driving innovation towards more environmentally friendly, low-VOC formulations, creating new market opportunities. The burgeoning automotive aftermarket industry, coupled with a strong DIY culture, provides a fertile ground for the widespread adoption of these advanced detailing products.
Challenges in the Ceramic Boost Sprays Sector
Despite the strong growth trajectory, the Ceramic Boost Sprays sector faces several hurdles. High initial product cost compared to traditional waxes and sealants remains a barrier for some price-sensitive consumers, impacting market penetration in certain demographics, representing a potential billions of dollars in untapped revenue. Consumer education and application complexity can also be a challenge, with a need for clear instructions and demonstrations to ensure proper application and maximize product performance. Regulatory hurdles, particularly concerning the varying standards for VOC content and chemical safety across different regions, can complicate product development and market entry for manufacturers, leading to potential delays in market expansion valued in the billions of dollars. Intense competition from established car care brands and the continuous introduction of new ceramic coating products necessitate ongoing innovation and aggressive marketing strategies. Furthermore, supply chain disruptions and the sourcing of specialized raw materials can impact production volumes and costs, potentially affecting market stability and growth projections in the billions of dollars.
Emerging Opportunities in Ceramic Boost Sprays
The Ceramic Boost Sprays market is ripe with emerging opportunities, driven by evolving consumer preferences and technological advancements. The increasing demand for eco-friendly and sustainable automotive care products presents a significant opportunity for water-based and low-VOC ceramic spray formulations, tapping into a billions of dollars market segment. The expansion into emerging markets in Asia-Pacific and Latin America, where car ownership is rapidly growing, offers substantial untapped potential for market penetration. Furthermore, the development of DIY-friendly, all-in-one ceramic coating kits and advanced application tools can further democratize the technology, opening up new revenue streams estimated in the tens of billions of dollars. The integration of smart coating technologies that offer self-cleaning or UV-indicating properties is another area of nascent innovation with significant future market potential, contributing to a billions of dollars future market. Strategic partnerships with automotive manufacturers for OEM applications also represent a promising avenue for long-term growth.
Leading Players in the Ceramic Boost Sprays Market
- 3M
- Adam's Polishes
- XPEL Inc
- NANOSKIN Car Care Products
- Meguiar's
- Chemical Guys
- Flynn’s Auto Detailing
- Sam's Detailing
- Vvash Auto Care
- Wizards Products
- Supreme Detail Supply
- FEYNLAB Inc
- Naked Bikes
- VEROS PREMIUM CAR CARE
Key Developments in Ceramic Boost Sprays Industry
- 2024 (Q1): FEYNLAB Inc launched its new ultra-hydrophobic ceramic boost spray, emphasizing extended durability and ease of application.
- 2023 (Q4): Chemical Guys introduced a graphene-infused ceramic spray, aiming to enhance scratch resistance and gloss.
- 2023 (Q2): XPEL Inc expanded its ceramic coating product line with a faster-drying, all-weather application spray.
- 2022 (Q3): NANOSKIN Car Care Products announced strategic partnerships with several automotive detailing chains to promote their ceramic boost spray solutions.
- 2021 (Q1): 3M unveiled a new generation of ceramic boost sprays with improved UV protection and chemical resistance.
- 2020 (Q4): Adam's Polishes released a water-based ceramic spray targeting environmentally conscious consumers.
Future Outlook for Ceramic Boost Sprays Market
The future outlook for the Ceramic Boost Sprays market is exceptionally bright, with projected continued expansion in the hundreds of billions of dollars. Growth accelerators include ongoing advancements in nanotechnology, leading to even more durable and self-repairing ceramic coatings, and the increasing demand for sustainable and eco-friendly automotive detailing solutions. The penetration into emerging economies, coupled with the rising disposable incomes and a growing car parc, presents significant untapped market potential. Strategic opportunities lie in the development of specialized ceramic coatings for electric vehicles and the integration of ceramic boost spray technology into vehicle manufacturing processes. The shift towards online retail and direct-to-consumer sales models will continue to streamline accessibility, further bolstering market growth and solidifying ceramic boost sprays as the premium standard in automotive protection and aesthetics.
Ceramic Boost Sprays Segmentation
-
1. Application
- 1.1. Household
- 1.2. Commercial
- 1.3. Industrial
-
2. Types
- 2.1. Water-Based
- 2.2. Silicone-Based
Ceramic Boost Sprays Segmentation By Geography
-
1. North America
- 1.1. United States
- 1.2. Canada
- 1.3. Mexico
-
2. South America
- 2.1. Brazil
- 2.2. Argentina
- 2.3. Rest of South America
-
3. Europe
- 3.1. United Kingdom
- 3.2. Germany
- 3.3. France
- 3.4. Italy
- 3.5. Spain
- 3.6. Russia
- 3.7. Benelux
- 3.8. Nordics
- 3.9. Rest of Europe
-
4. Middle East & Africa
- 4.1. Turkey
- 4.2. Israel
- 4.3. GCC
- 4.4. North Africa
- 4.5. South Africa
- 4.6. Rest of Middle East & Africa
-
5. Asia Pacific
- 5.1. China
- 5.2. India
- 5.3. Japan
- 5.4. South Korea
- 5.5. ASEAN
- 5.6. Oceania
- 5.7. Rest of Asia Pacific
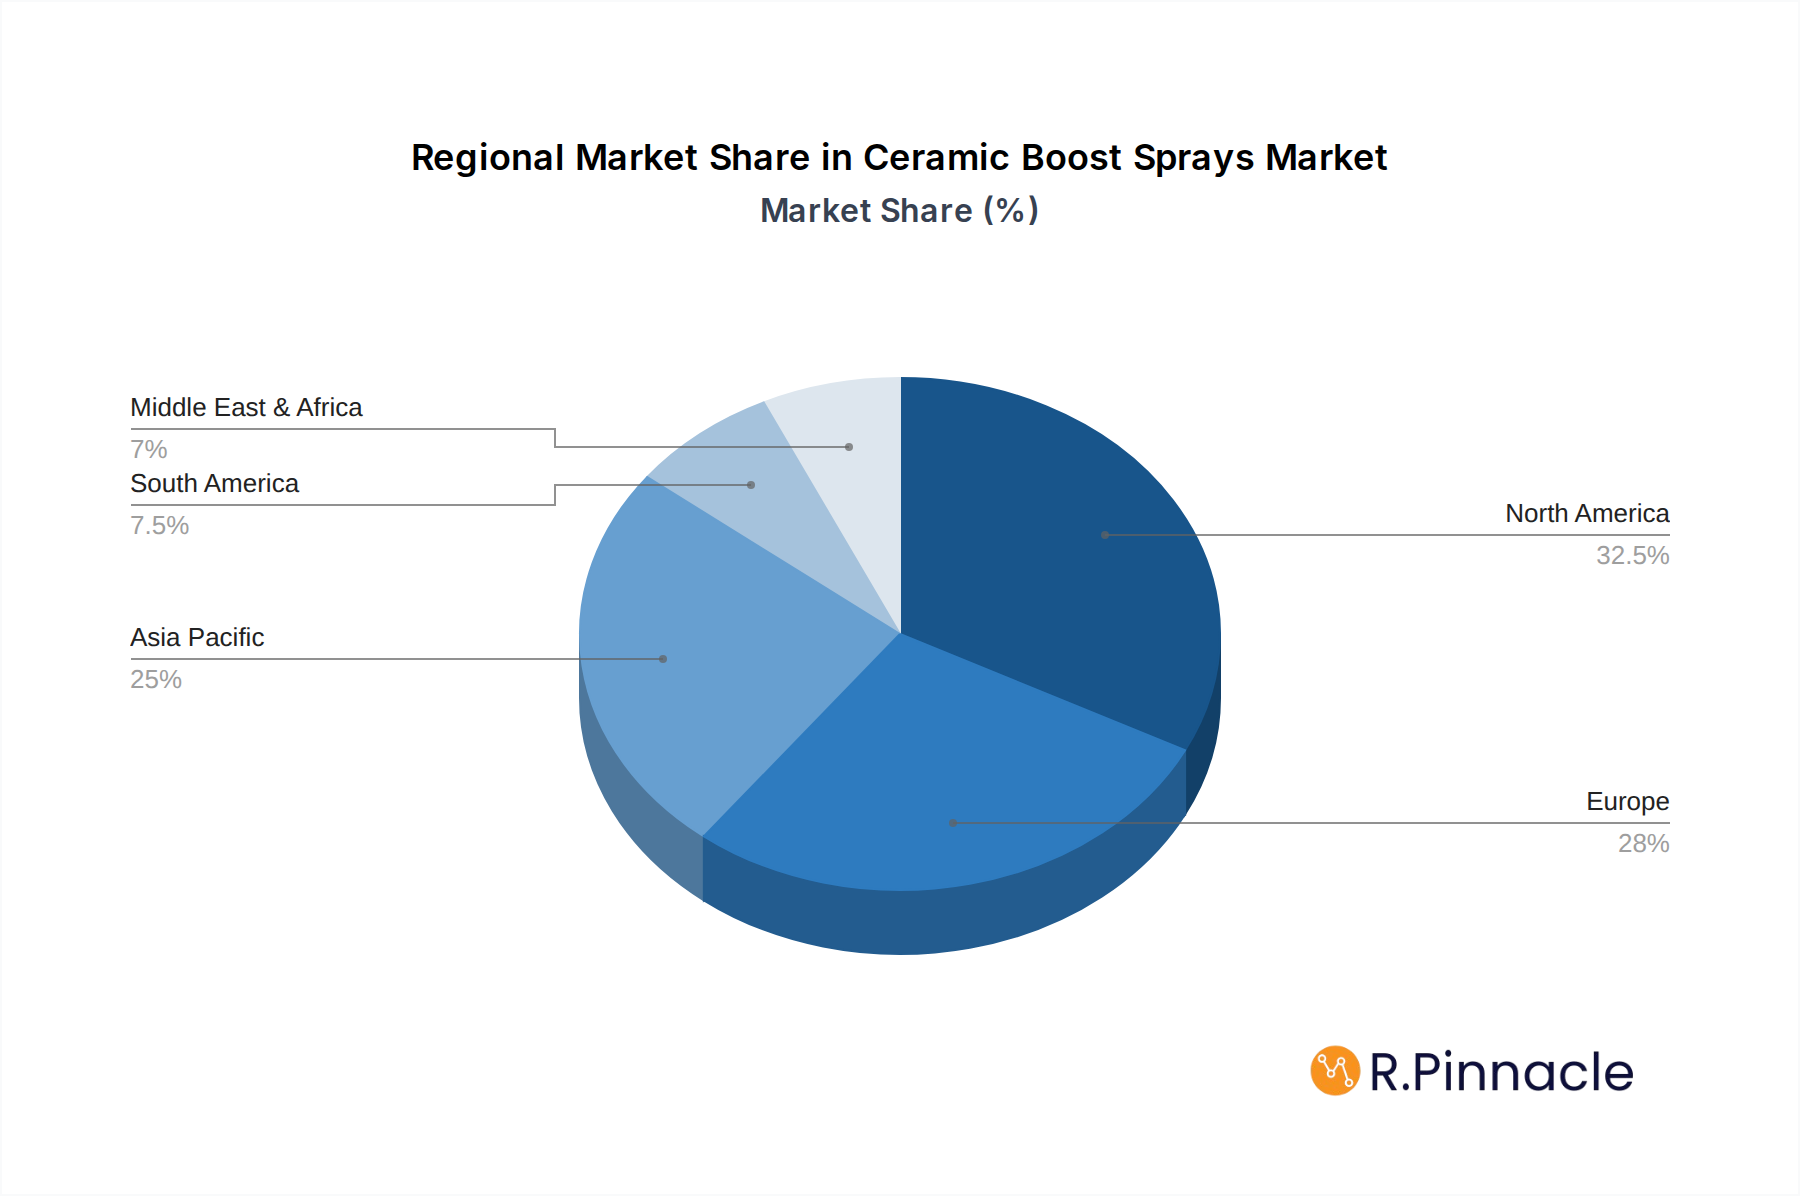
Ceramic Boost Sprays Regional Market Share
Geographic Coverage of Ceramic Boost Sprays
Ceramic Boost Sprays REPORT HIGHLIGHTS
| Aspects | Details |
|---|---|
| Study Period | 2020-2034 |
| Base Year | 2025 |
| Estimated Year | 2026 |
| Forecast Period | 2026-2034 |
| Historical Period | 2020-2025 |
| Growth Rate | CAGR of 15.91% from 2020-2034 |
| Segmentation |
|
Table of Contents
- 1. Introduction
- 1.1. Research Scope
- 1.2. Market Segmentation
- 1.3. Research Methodology
- 1.4. Definitions and Assumptions
- 2. Executive Summary
- 2.1. Introduction
- 3. Market Dynamics
- 3.1. Introduction
- 3.2. Market Drivers
- 3.3. Market Restrains
- 3.4. Market Trends
- 4. Market Factor Analysis
- 4.1. Porters Five Forces
- 4.2. Supply/Value Chain
- 4.3. PESTEL analysis
- 4.4. Market Entropy
- 4.5. Patent/Trademark Analysis
- 5. Global Ceramic Boost Sprays Analysis, Insights and Forecast, 2020-2032
- 5.1. Market Analysis, Insights and Forecast - by Application
- 5.1.1. Household
- 5.1.2. Commercial
- 5.1.3. Industrial
- 5.2. Market Analysis, Insights and Forecast - by Types
- 5.2.1. Water-Based
- 5.2.2. Silicone-Based
- 5.3. Market Analysis, Insights and Forecast - by Region
- 5.3.1. North America
- 5.3.2. South America
- 5.3.3. Europe
- 5.3.4. Middle East & Africa
- 5.3.5. Asia Pacific
- 5.1. Market Analysis, Insights and Forecast - by Application
- 6. North America Ceramic Boost Sprays Analysis, Insights and Forecast, 2020-2032
- 6.1. Market Analysis, Insights and Forecast - by Application
- 6.1.1. Household
- 6.1.2. Commercial
- 6.1.3. Industrial
- 6.2. Market Analysis, Insights and Forecast - by Types
- 6.2.1. Water-Based
- 6.2.2. Silicone-Based
- 6.1. Market Analysis, Insights and Forecast - by Application
- 7. South America Ceramic Boost Sprays Analysis, Insights and Forecast, 2020-2032
- 7.1. Market Analysis, Insights and Forecast - by Application
- 7.1.1. Household
- 7.1.2. Commercial
- 7.1.3. Industrial
- 7.2. Market Analysis, Insights and Forecast - by Types
- 7.2.1. Water-Based
- 7.2.2. Silicone-Based
- 7.1. Market Analysis, Insights and Forecast - by Application
- 8. Europe Ceramic Boost Sprays Analysis, Insights and Forecast, 2020-2032
- 8.1. Market Analysis, Insights and Forecast - by Application
- 8.1.1. Household
- 8.1.2. Commercial
- 8.1.3. Industrial
- 8.2. Market Analysis, Insights and Forecast - by Types
- 8.2.1. Water-Based
- 8.2.2. Silicone-Based
- 8.1. Market Analysis, Insights and Forecast - by Application
- 9. Middle East & Africa Ceramic Boost Sprays Analysis, Insights and Forecast, 2020-2032
- 9.1. Market Analysis, Insights and Forecast - by Application
- 9.1.1. Household
- 9.1.2. Commercial
- 9.1.3. Industrial
- 9.2. Market Analysis, Insights and Forecast - by Types
- 9.2.1. Water-Based
- 9.2.2. Silicone-Based
- 9.1. Market Analysis, Insights and Forecast - by Application
- 10. Asia Pacific Ceramic Boost Sprays Analysis, Insights and Forecast, 2020-2032
- 10.1. Market Analysis, Insights and Forecast - by Application
- 10.1.1. Household
- 10.1.2. Commercial
- 10.1.3. Industrial
- 10.2. Market Analysis, Insights and Forecast - by Types
- 10.2.1. Water-Based
- 10.2.2. Silicone-Based
- 10.1. Market Analysis, Insights and Forecast - by Application
- 11. Competitive Analysis
- 11.1. Global Market Share Analysis 2025
- 11.2. Company Profiles
- 11.2.1 3M
- 11.2.1.1. Overview
- 11.2.1.2. Products
- 11.2.1.3. SWOT Analysis
- 11.2.1.4. Recent Developments
- 11.2.1.5. Financials (Based on Availability)
- 11.2.2 Adam's Polishes
- 11.2.2.1. Overview
- 11.2.2.2. Products
- 11.2.2.3. SWOT Analysis
- 11.2.2.4. Recent Developments
- 11.2.2.5. Financials (Based on Availability)
- 11.2.3 XPEL Inc
- 11.2.3.1. Overview
- 11.2.3.2. Products
- 11.2.3.3. SWOT Analysis
- 11.2.3.4. Recent Developments
- 11.2.3.5. Financials (Based on Availability)
- 11.2.4 NANOSKIN Car Care Products
- 11.2.4.1. Overview
- 11.2.4.2. Products
- 11.2.4.3. SWOT Analysis
- 11.2.4.4. Recent Developments
- 11.2.4.5. Financials (Based on Availability)
- 11.2.5 Meguiar's
- 11.2.5.1. Overview
- 11.2.5.2. Products
- 11.2.5.3. SWOT Analysis
- 11.2.5.4. Recent Developments
- 11.2.5.5. Financials (Based on Availability)
- 11.2.6 Chemical Guys
- 11.2.6.1. Overview
- 11.2.6.2. Products
- 11.2.6.3. SWOT Analysis
- 11.2.6.4. Recent Developments
- 11.2.6.5. Financials (Based on Availability)
- 11.2.7 Flynn’s Auto Detailing
- 11.2.7.1. Overview
- 11.2.7.2. Products
- 11.2.7.3. SWOT Analysis
- 11.2.7.4. Recent Developments
- 11.2.7.5. Financials (Based on Availability)
- 11.2.8 Sam's Detailing
- 11.2.8.1. Overview
- 11.2.8.2. Products
- 11.2.8.3. SWOT Analysis
- 11.2.8.4. Recent Developments
- 11.2.8.5. Financials (Based on Availability)
- 11.2.9 Vvash Auto Care
- 11.2.9.1. Overview
- 11.2.9.2. Products
- 11.2.9.3. SWOT Analysis
- 11.2.9.4. Recent Developments
- 11.2.9.5. Financials (Based on Availability)
- 11.2.10 Wizards Products
- 11.2.10.1. Overview
- 11.2.10.2. Products
- 11.2.10.3. SWOT Analysis
- 11.2.10.4. Recent Developments
- 11.2.10.5. Financials (Based on Availability)
- 11.2.11 Supreme Detail Supply
- 11.2.11.1. Overview
- 11.2.11.2. Products
- 11.2.11.3. SWOT Analysis
- 11.2.11.4. Recent Developments
- 11.2.11.5. Financials (Based on Availability)
- 11.2.12 FEYNLAB Inc
- 11.2.12.1. Overview
- 11.2.12.2. Products
- 11.2.12.3. SWOT Analysis
- 11.2.12.4. Recent Developments
- 11.2.12.5. Financials (Based on Availability)
- 11.2.13 Naked Bikes
- 11.2.13.1. Overview
- 11.2.13.2. Products
- 11.2.13.3. SWOT Analysis
- 11.2.13.4. Recent Developments
- 11.2.13.5. Financials (Based on Availability)
- 11.2.14 VEROS PREMIUM CAR CARE
- 11.2.14.1. Overview
- 11.2.14.2. Products
- 11.2.14.3. SWOT Analysis
- 11.2.14.4. Recent Developments
- 11.2.14.5. Financials (Based on Availability)
- 11.2.1 3M
List of Figures
- Figure 1: Global Ceramic Boost Sprays Revenue Breakdown (billion, %) by Region 2025 & 2033
- Figure 2: Global Ceramic Boost Sprays Volume Breakdown (K, %) by Region 2025 & 2033
- Figure 3: North America Ceramic Boost Sprays Revenue (billion), by Application 2025 & 2033
- Figure 4: North America Ceramic Boost Sprays Volume (K), by Application 2025 & 2033
- Figure 5: North America Ceramic Boost Sprays Revenue Share (%), by Application 2025 & 2033
- Figure 6: North America Ceramic Boost Sprays Volume Share (%), by Application 2025 & 2033
- Figure 7: North America Ceramic Boost Sprays Revenue (billion), by Types 2025 & 2033
- Figure 8: North America Ceramic Boost Sprays Volume (K), by Types 2025 & 2033
- Figure 9: North America Ceramic Boost Sprays Revenue Share (%), by Types 2025 & 2033
- Figure 10: North America Ceramic Boost Sprays Volume Share (%), by Types 2025 & 2033
- Figure 11: North America Ceramic Boost Sprays Revenue (billion), by Country 2025 & 2033
- Figure 12: North America Ceramic Boost Sprays Volume (K), by Country 2025 & 2033
- Figure 13: North America Ceramic Boost Sprays Revenue Share (%), by Country 2025 & 2033
- Figure 14: North America Ceramic Boost Sprays Volume Share (%), by Country 2025 & 2033
- Figure 15: South America Ceramic Boost Sprays Revenue (billion), by Application 2025 & 2033
- Figure 16: South America Ceramic Boost Sprays Volume (K), by Application 2025 & 2033
- Figure 17: South America Ceramic Boost Sprays Revenue Share (%), by Application 2025 & 2033
- Figure 18: South America Ceramic Boost Sprays Volume Share (%), by Application 2025 & 2033
- Figure 19: South America Ceramic Boost Sprays Revenue (billion), by Types 2025 & 2033
- Figure 20: South America Ceramic Boost Sprays Volume (K), by Types 2025 & 2033
- Figure 21: South America Ceramic Boost Sprays Revenue Share (%), by Types 2025 & 2033
- Figure 22: South America Ceramic Boost Sprays Volume Share (%), by Types 2025 & 2033
- Figure 23: South America Ceramic Boost Sprays Revenue (billion), by Country 2025 & 2033
- Figure 24: South America Ceramic Boost Sprays Volume (K), by Country 2025 & 2033
- Figure 25: South America Ceramic Boost Sprays Revenue Share (%), by Country 2025 & 2033
- Figure 26: South America Ceramic Boost Sprays Volume Share (%), by Country 2025 & 2033
- Figure 27: Europe Ceramic Boost Sprays Revenue (billion), by Application 2025 & 2033
- Figure 28: Europe Ceramic Boost Sprays Volume (K), by Application 2025 & 2033
- Figure 29: Europe Ceramic Boost Sprays Revenue Share (%), by Application 2025 & 2033
- Figure 30: Europe Ceramic Boost Sprays Volume Share (%), by Application 2025 & 2033
- Figure 31: Europe Ceramic Boost Sprays Revenue (billion), by Types 2025 & 2033
- Figure 32: Europe Ceramic Boost Sprays Volume (K), by Types 2025 & 2033
- Figure 33: Europe Ceramic Boost Sprays Revenue Share (%), by Types 2025 & 2033
- Figure 34: Europe Ceramic Boost Sprays Volume Share (%), by Types 2025 & 2033
- Figure 35: Europe Ceramic Boost Sprays Revenue (billion), by Country 2025 & 2033
- Figure 36: Europe Ceramic Boost Sprays Volume (K), by Country 2025 & 2033
- Figure 37: Europe Ceramic Boost Sprays Revenue Share (%), by Country 2025 & 2033
- Figure 38: Europe Ceramic Boost Sprays Volume Share (%), by Country 2025 & 2033
- Figure 39: Middle East & Africa Ceramic Boost Sprays Revenue (billion), by Application 2025 & 2033
- Figure 40: Middle East & Africa Ceramic Boost Sprays Volume (K), by Application 2025 & 2033
- Figure 41: Middle East & Africa Ceramic Boost Sprays Revenue Share (%), by Application 2025 & 2033
- Figure 42: Middle East & Africa Ceramic Boost Sprays Volume Share (%), by Application 2025 & 2033
- Figure 43: Middle East & Africa Ceramic Boost Sprays Revenue (billion), by Types 2025 & 2033
- Figure 44: Middle East & Africa Ceramic Boost Sprays Volume (K), by Types 2025 & 2033
- Figure 45: Middle East & Africa Ceramic Boost Sprays Revenue Share (%), by Types 2025 & 2033
- Figure 46: Middle East & Africa Ceramic Boost Sprays Volume Share (%), by Types 2025 & 2033
- Figure 47: Middle East & Africa Ceramic Boost Sprays Revenue (billion), by Country 2025 & 2033
- Figure 48: Middle East & Africa Ceramic Boost Sprays Volume (K), by Country 2025 & 2033
- Figure 49: Middle East & Africa Ceramic Boost Sprays Revenue Share (%), by Country 2025 & 2033
- Figure 50: Middle East & Africa Ceramic Boost Sprays Volume Share (%), by Country 2025 & 2033
- Figure 51: Asia Pacific Ceramic Boost Sprays Revenue (billion), by Application 2025 & 2033
- Figure 52: Asia Pacific Ceramic Boost Sprays Volume (K), by Application 2025 & 2033
- Figure 53: Asia Pacific Ceramic Boost Sprays Revenue Share (%), by Application 2025 & 2033
- Figure 54: Asia Pacific Ceramic Boost Sprays Volume Share (%), by Application 2025 & 2033
- Figure 55: Asia Pacific Ceramic Boost Sprays Revenue (billion), by Types 2025 & 2033
- Figure 56: Asia Pacific Ceramic Boost Sprays Volume (K), by Types 2025 & 2033
- Figure 57: Asia Pacific Ceramic Boost Sprays Revenue Share (%), by Types 2025 & 2033
- Figure 58: Asia Pacific Ceramic Boost Sprays Volume Share (%), by Types 2025 & 2033
- Figure 59: Asia Pacific Ceramic Boost Sprays Revenue (billion), by Country 2025 & 2033
- Figure 60: Asia Pacific Ceramic Boost Sprays Volume (K), by Country 2025 & 2033
- Figure 61: Asia Pacific Ceramic Boost Sprays Revenue Share (%), by Country 2025 & 2033
- Figure 62: Asia Pacific Ceramic Boost Sprays Volume Share (%), by Country 2025 & 2033
List of Tables
- Table 1: Global Ceramic Boost Sprays Revenue billion Forecast, by Application 2020 & 2033
- Table 2: Global Ceramic Boost Sprays Volume K Forecast, by Application 2020 & 2033
- Table 3: Global Ceramic Boost Sprays Revenue billion Forecast, by Types 2020 & 2033
- Table 4: Global Ceramic Boost Sprays Volume K Forecast, by Types 2020 & 2033
- Table 5: Global Ceramic Boost Sprays Revenue billion Forecast, by Region 2020 & 2033
- Table 6: Global Ceramic Boost Sprays Volume K Forecast, by Region 2020 & 2033
- Table 7: Global Ceramic Boost Sprays Revenue billion Forecast, by Application 2020 & 2033
- Table 8: Global Ceramic Boost Sprays Volume K Forecast, by Application 2020 & 2033
- Table 9: Global Ceramic Boost Sprays Revenue billion Forecast, by Types 2020 & 2033
- Table 10: Global Ceramic Boost Sprays Volume K Forecast, by Types 2020 & 2033
- Table 11: Global Ceramic Boost Sprays Revenue billion Forecast, by Country 2020 & 2033
- Table 12: Global Ceramic Boost Sprays Volume K Forecast, by Country 2020 & 2033
- Table 13: United States Ceramic Boost Sprays Revenue (billion) Forecast, by Application 2020 & 2033
- Table 14: United States Ceramic Boost Sprays Volume (K) Forecast, by Application 2020 & 2033
- Table 15: Canada Ceramic Boost Sprays Revenue (billion) Forecast, by Application 2020 & 2033
- Table 16: Canada Ceramic Boost Sprays Volume (K) Forecast, by Application 2020 & 2033
- Table 17: Mexico Ceramic Boost Sprays Revenue (billion) Forecast, by Application 2020 & 2033
- Table 18: Mexico Ceramic Boost Sprays Volume (K) Forecast, by Application 2020 & 2033
- Table 19: Global Ceramic Boost Sprays Revenue billion Forecast, by Application 2020 & 2033
- Table 20: Global Ceramic Boost Sprays Volume K Forecast, by Application 2020 & 2033
- Table 21: Global Ceramic Boost Sprays Revenue billion Forecast, by Types 2020 & 2033
- Table 22: Global Ceramic Boost Sprays Volume K Forecast, by Types 2020 & 2033
- Table 23: Global Ceramic Boost Sprays Revenue billion Forecast, by Country 2020 & 2033
- Table 24: Global Ceramic Boost Sprays Volume K Forecast, by Country 2020 & 2033
- Table 25: Brazil Ceramic Boost Sprays Revenue (billion) Forecast, by Application 2020 & 2033
- Table 26: Brazil Ceramic Boost Sprays Volume (K) Forecast, by Application 2020 & 2033
- Table 27: Argentina Ceramic Boost Sprays Revenue (billion) Forecast, by Application 2020 & 2033
- Table 28: Argentina Ceramic Boost Sprays Volume (K) Forecast, by Application 2020 & 2033
- Table 29: Rest of South America Ceramic Boost Sprays Revenue (billion) Forecast, by Application 2020 & 2033
- Table 30: Rest of South America Ceramic Boost Sprays Volume (K) Forecast, by Application 2020 & 2033
- Table 31: Global Ceramic Boost Sprays Revenue billion Forecast, by Application 2020 & 2033
- Table 32: Global Ceramic Boost Sprays Volume K Forecast, by Application 2020 & 2033
- Table 33: Global Ceramic Boost Sprays Revenue billion Forecast, by Types 2020 & 2033
- Table 34: Global Ceramic Boost Sprays Volume K Forecast, by Types 2020 & 2033
- Table 35: Global Ceramic Boost Sprays Revenue billion Forecast, by Country 2020 & 2033
- Table 36: Global Ceramic Boost Sprays Volume K Forecast, by Country 2020 & 2033
- Table 37: United Kingdom Ceramic Boost Sprays Revenue (billion) Forecast, by Application 2020 & 2033
- Table 38: United Kingdom Ceramic Boost Sprays Volume (K) Forecast, by Application 2020 & 2033
- Table 39: Germany Ceramic Boost Sprays Revenue (billion) Forecast, by Application 2020 & 2033
- Table 40: Germany Ceramic Boost Sprays Volume (K) Forecast, by Application 2020 & 2033
- Table 41: France Ceramic Boost Sprays Revenue (billion) Forecast, by Application 2020 & 2033
- Table 42: France Ceramic Boost Sprays Volume (K) Forecast, by Application 2020 & 2033
- Table 43: Italy Ceramic Boost Sprays Revenue (billion) Forecast, by Application 2020 & 2033
- Table 44: Italy Ceramic Boost Sprays Volume (K) Forecast, by Application 2020 & 2033
- Table 45: Spain Ceramic Boost Sprays Revenue (billion) Forecast, by Application 2020 & 2033
- Table 46: Spain Ceramic Boost Sprays Volume (K) Forecast, by Application 2020 & 2033
- Table 47: Russia Ceramic Boost Sprays Revenue (billion) Forecast, by Application 2020 & 2033
- Table 48: Russia Ceramic Boost Sprays Volume (K) Forecast, by Application 2020 & 2033
- Table 49: Benelux Ceramic Boost Sprays Revenue (billion) Forecast, by Application 2020 & 2033
- Table 50: Benelux Ceramic Boost Sprays Volume (K) Forecast, by Application 2020 & 2033
- Table 51: Nordics Ceramic Boost Sprays Revenue (billion) Forecast, by Application 2020 & 2033
- Table 52: Nordics Ceramic Boost Sprays Volume (K) Forecast, by Application 2020 & 2033
- Table 53: Rest of Europe Ceramic Boost Sprays Revenue (billion) Forecast, by Application 2020 & 2033
- Table 54: Rest of Europe Ceramic Boost Sprays Volume (K) Forecast, by Application 2020 & 2033
- Table 55: Global Ceramic Boost Sprays Revenue billion Forecast, by Application 2020 & 2033
- Table 56: Global Ceramic Boost Sprays Volume K Forecast, by Application 2020 & 2033
- Table 57: Global Ceramic Boost Sprays Revenue billion Forecast, by Types 2020 & 2033
- Table 58: Global Ceramic Boost Sprays Volume K Forecast, by Types 2020 & 2033
- Table 59: Global Ceramic Boost Sprays Revenue billion Forecast, by Country 2020 & 2033
- Table 60: Global Ceramic Boost Sprays Volume K Forecast, by Country 2020 & 2033
- Table 61: Turkey Ceramic Boost Sprays Revenue (billion) Forecast, by Application 2020 & 2033
- Table 62: Turkey Ceramic Boost Sprays Volume (K) Forecast, by Application 2020 & 2033
- Table 63: Israel Ceramic Boost Sprays Revenue (billion) Forecast, by Application 2020 & 2033
- Table 64: Israel Ceramic Boost Sprays Volume (K) Forecast, by Application 2020 & 2033
- Table 65: GCC Ceramic Boost Sprays Revenue (billion) Forecast, by Application 2020 & 2033
- Table 66: GCC Ceramic Boost Sprays Volume (K) Forecast, by Application 2020 & 2033
- Table 67: North Africa Ceramic Boost Sprays Revenue (billion) Forecast, by Application 2020 & 2033
- Table 68: North Africa Ceramic Boost Sprays Volume (K) Forecast, by Application 2020 & 2033
- Table 69: South Africa Ceramic Boost Sprays Revenue (billion) Forecast, by Application 2020 & 2033
- Table 70: South Africa Ceramic Boost Sprays Volume (K) Forecast, by Application 2020 & 2033
- Table 71: Rest of Middle East & Africa Ceramic Boost Sprays Revenue (billion) Forecast, by Application 2020 & 2033
- Table 72: Rest of Middle East & Africa Ceramic Boost Sprays Volume (K) Forecast, by Application 2020 & 2033
- Table 73: Global Ceramic Boost Sprays Revenue billion Forecast, by Application 2020 & 2033
- Table 74: Global Ceramic Boost Sprays Volume K Forecast, by Application 2020 & 2033
- Table 75: Global Ceramic Boost Sprays Revenue billion Forecast, by Types 2020 & 2033
- Table 76: Global Ceramic Boost Sprays Volume K Forecast, by Types 2020 & 2033
- Table 77: Global Ceramic Boost Sprays Revenue billion Forecast, by Country 2020 & 2033
- Table 78: Global Ceramic Boost Sprays Volume K Forecast, by Country 2020 & 2033
- Table 79: China Ceramic Boost Sprays Revenue (billion) Forecast, by Application 2020 & 2033
- Table 80: China Ceramic Boost Sprays Volume (K) Forecast, by Application 2020 & 2033
- Table 81: India Ceramic Boost Sprays Revenue (billion) Forecast, by Application 2020 & 2033
- Table 82: India Ceramic Boost Sprays Volume (K) Forecast, by Application 2020 & 2033
- Table 83: Japan Ceramic Boost Sprays Revenue (billion) Forecast, by Application 2020 & 2033
- Table 84: Japan Ceramic Boost Sprays Volume (K) Forecast, by Application 2020 & 2033
- Table 85: South Korea Ceramic Boost Sprays Revenue (billion) Forecast, by Application 2020 & 2033
- Table 86: South Korea Ceramic Boost Sprays Volume (K) Forecast, by Application 2020 & 2033
- Table 87: ASEAN Ceramic Boost Sprays Revenue (billion) Forecast, by Application 2020 & 2033
- Table 88: ASEAN Ceramic Boost Sprays Volume (K) Forecast, by Application 2020 & 2033
- Table 89: Oceania Ceramic Boost Sprays Revenue (billion) Forecast, by Application 2020 & 2033
- Table 90: Oceania Ceramic Boost Sprays Volume (K) Forecast, by Application 2020 & 2033
- Table 91: Rest of Asia Pacific Ceramic Boost Sprays Revenue (billion) Forecast, by Application 2020 & 2033
- Table 92: Rest of Asia Pacific Ceramic Boost Sprays Volume (K) Forecast, by Application 2020 & 2033
Frequently Asked Questions
1. What is the projected Compound Annual Growth Rate (CAGR) of the Ceramic Boost Sprays?
The projected CAGR is approximately 15.91%.
2. Which companies are prominent players in the Ceramic Boost Sprays?
Key companies in the market include 3M, Adam's Polishes, XPEL Inc, NANOSKIN Car Care Products, Meguiar's, Chemical Guys, Flynn’s Auto Detailing, Sam's Detailing, Vvash Auto Care, Wizards Products, Supreme Detail Supply, FEYNLAB Inc, Naked Bikes, VEROS PREMIUM CAR CARE.
3. What are the main segments of the Ceramic Boost Sprays?
The market segments include Application, Types.
4. Can you provide details about the market size?
The market size is estimated to be USD 9.75 billion as of 2022.
5. What are some drivers contributing to market growth?
N/A
6. What are the notable trends driving market growth?
N/A
7. Are there any restraints impacting market growth?
N/A
8. Can you provide examples of recent developments in the market?
N/A
9. What pricing options are available for accessing the report?
Pricing options include single-user, multi-user, and enterprise licenses priced at USD 3350.00, USD 5025.00, and USD 6700.00 respectively.
10. Is the market size provided in terms of value or volume?
The market size is provided in terms of value, measured in billion and volume, measured in K.
11. Are there any specific market keywords associated with the report?
Yes, the market keyword associated with the report is "Ceramic Boost Sprays," which aids in identifying and referencing the specific market segment covered.
12. How do I determine which pricing option suits my needs best?
The pricing options vary based on user requirements and access needs. Individual users may opt for single-user licenses, while businesses requiring broader access may choose multi-user or enterprise licenses for cost-effective access to the report.
13. Are there any additional resources or data provided in the Ceramic Boost Sprays report?
While the report offers comprehensive insights, it's advisable to review the specific contents or supplementary materials provided to ascertain if additional resources or data are available.
14. How can I stay updated on further developments or reports in the Ceramic Boost Sprays?
To stay informed about further developments, trends, and reports in the Ceramic Boost Sprays, consider subscribing to industry newsletters, following relevant companies and organizations, or regularly checking reputable industry news sources and publications.
Methodology
Step 1 - Identification of Relevant Samples Size from Population Database


Step 2 - Approaches for Defining Global Market Size (Value, Volume* & Price*)

Note*: In applicable scenarios
Step 3 - Data Sources
Primary Research
- Web Analytics
- Survey Reports
- Research Institute
- Latest Research Reports
- Opinion Leaders
Secondary Research
- Annual Reports
- White Paper
- Latest Press Release
- Industry Association
- Paid Database
- Investor Presentations

Step 4 - Data Triangulation
Involves using different sources of information in order to increase the validity of a study
These sources are likely to be stakeholders in a program - participants, other researchers, program staff, other community members, and so on.
Then we put all data in single framework & apply various statistical tools to find out the dynamic on the market.
During the analysis stage, feedback from the stakeholder groups would be compared to determine areas of agreement as well as areas of divergence