

Key Insights
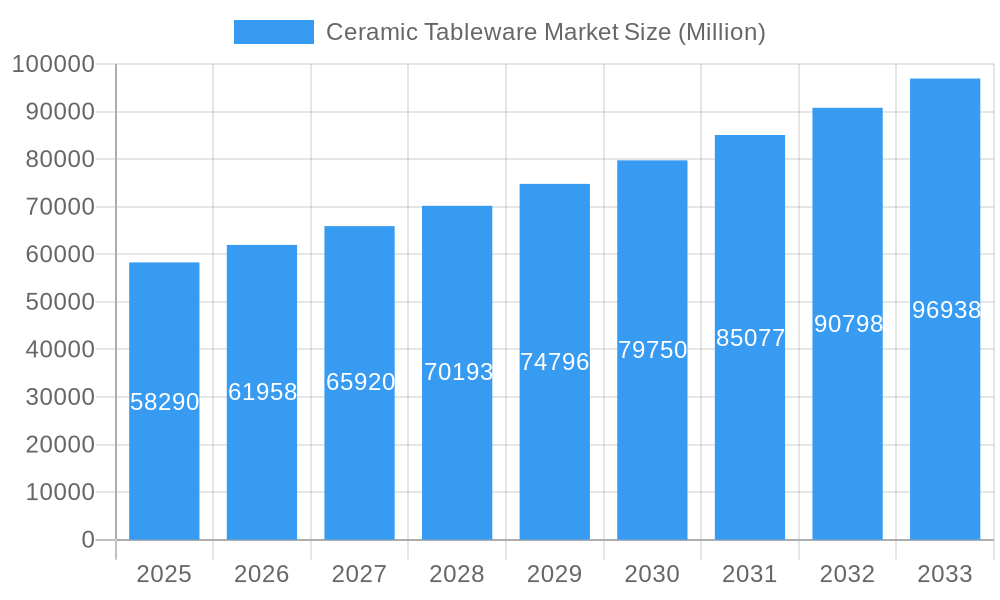
The global ceramic tableware market, valued at $58.29 billion in 2025, is projected to experience robust growth, driven by a Compound Annual Growth Rate (CAGR) of 6.21% from 2025 to 2033. This expansion is fueled by several key factors. Firstly, the rising disposable incomes in emerging economies, particularly in Asia-Pacific, are boosting consumer spending on premium tableware, enhancing the market's potential. Secondly, the growing popularity of casual dining and home entertaining is driving demand for aesthetically pleasing and functional ceramic tableware. The shift towards healthier lifestyles also plays a role, with consumers increasingly opting for durable and microwave-safe ceramic options. Furthermore, innovation in designs, materials, and finishes continues to attract consumers seeking unique and personalized tableware. The market is segmented by type (porcelain, bone china, stoneware, and others), end-user (household and commercial), and distribution channel (supermarkets, specialty stores, wholesalers, and online). The online channel's rapid expansion offers significant growth opportunities for manufacturers and retailers.
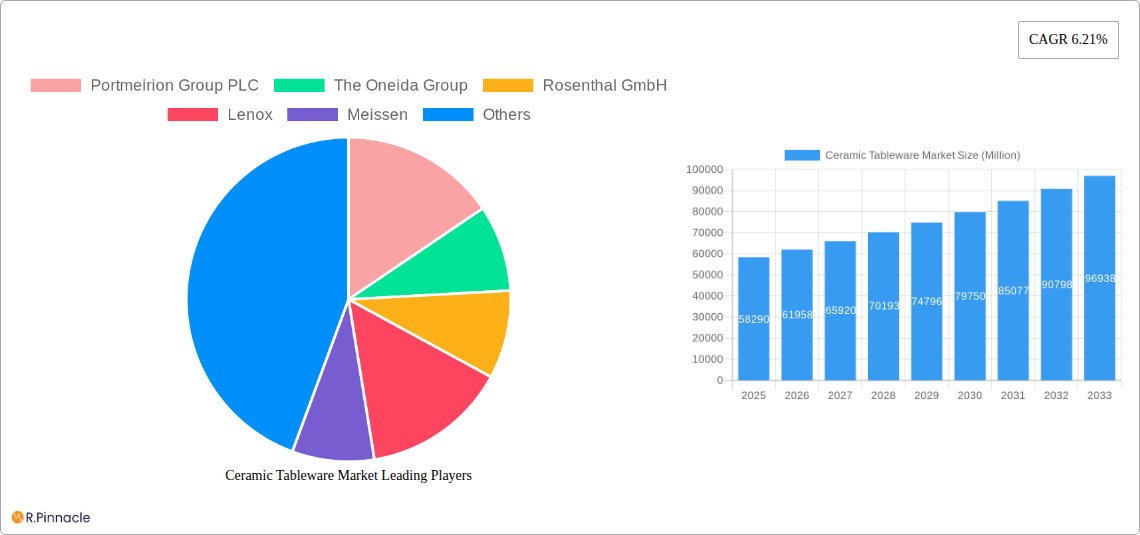
Ceramic Tableware Market Market Size (In Billion)
However, certain factors could restrain market growth. Fluctuations in raw material prices, particularly clay and glaze, can impact profitability. Increasing competition from alternative materials, such as melamine and plastic, presents a challenge. Moreover, environmental concerns related to ceramic production and disposal necessitate sustainable practices to ensure long-term market sustainability. Despite these challenges, the market’s inherent appeal—versatility, durability, and aesthetic value—will continue to underpin its growth, with a projected market size exceeding $100 billion by 2033. Significant regional variations are expected, with Asia-Pacific and North America likely to dominate, reflecting their higher disposable incomes and established consumer preferences.
Ceramic Tableware Market Company Market Share
Ceramic Tableware Market: A Comprehensive Report (2019-2033)
This in-depth report provides a comprehensive analysis of the global Ceramic Tableware Market, offering invaluable insights for industry professionals, investors, and strategic decision-makers. Covering the period 2019-2033, with a focus on 2025, this report dissects market dynamics, growth drivers, competitive landscapes, and future trends, empowering you to make informed decisions. The study period (2019-2024) provides historical context, while the forecast period (2025-2033) projects future market trajectories. The base year for this analysis is 2025.
Ceramic Tableware Market Structure & Innovation Trends
This section analyzes the competitive landscape of the Ceramic Tableware Market, examining market concentration, innovation drivers, regulatory frameworks, product substitutes, and M&A activities. Key players such as Portmeirion Group PLC, The Oneida Group, Rosenthal GmbH, Lenox, Meissen, Libbey, Seltmann Weiden, RAK Porcelain, Narumi, KAHLA Porzellan, WMF, SCHONWALD, Churchill China, Villeroy & Boch, TATA ceramics, Sitong Group, and Fiskars Group are assessed for their market share and strategic moves.
- Market Concentration: The market exhibits a moderately concentrated structure with a few dominant players commanding significant market share (xx%). Smaller players focus on niche segments or regional markets.
- Innovation Drivers: Technological advancements in materials science (e.g., development of stronger, lighter, and more durable ceramics) and design aesthetics are driving innovation. Sustainability concerns are also influencing product development with a focus on eco-friendly materials and manufacturing processes.
- Regulatory Framework: Regulations concerning food safety, material composition, and environmental impact shape manufacturing and distribution practices. Variations in these regulations across regions impact market dynamics.
- Product Substitutes: Alternative materials like melamine and plastic tableware compete in certain segments, particularly in the lower-priced market. However, the superior aesthetics and perceived quality of ceramic tableware maintain its strong position.
- M&A Activities: The past five years have witnessed xx M&A deals with a total estimated value of $xx Million, primarily focused on expanding product portfolios and geographic reach. These activities have influenced market consolidation and competitive dynamics.
Ceramic Tableware Market Dynamics & Trends
This section delves into the key factors shaping the Ceramic Tableware Market's growth trajectory. The market is projected to experience a Compound Annual Growth Rate (CAGR) of xx% during the forecast period (2025-2033). Market penetration is expected to reach xx% by 2033.
The market's growth is fuelled by several factors including rising disposable incomes in developing economies, increasing urbanization, and a growing preference for aesthetically pleasing and functional tableware. Technological disruptions, such as the adoption of 3D printing in ceramic manufacturing, are creating new opportunities for innovation and customization. Consumer preferences are shifting towards sustainable and ethically sourced products, which is impacting the demand for eco-friendly ceramic tableware. Competitive dynamics are characterized by product differentiation, branding, and pricing strategies.
Dominant Regions & Segments in Ceramic Tableware Market
This section identifies the leading regions, countries, and market segments within the Ceramic Tableware Market.
Leading Region: The [Region Name] region holds the largest market share, driven by [Specific Factors, e.g., strong economic growth, high consumer spending].
Leading Country: [Country Name] dominates within the [Region Name] region due to [Specific Factors, e.g., established manufacturing base, favorable government policies].
Leading Type Segment: Porcelain and Bone China commands the largest share due to its superior aesthetics and perceived quality, though Stoneware (Ceramic) shows robust growth driven by affordability and durability.
Leading End-User Segment: The Household segment holds a significant market share, followed by Commercial, influenced by hospitality and food service industry trends.
Leading Distribution Channel: Supermarkets & Hypermarkets hold a dominant position, offering convenient access to a wide range of ceramic tableware options. Online channels are gaining traction due to increased e-commerce adoption.
Key Drivers (by segment):
- Porcelain and Bone China: High perceived value, aesthetic appeal.
- Stoneware (Ceramic): Durability, affordability.
- Household: Rising disposable incomes, changing lifestyles.
- Commercial: Growth of the food service industry.
- Supermarkets & Hypermarkets: Convenience, wide product selection.
Ceramic Tableware Market Product Innovations
Recent innovations include the development of lightweight yet durable ceramic materials, improved glaze technologies for enhanced durability and hygiene, and the incorporation of sustainable materials in production. 3D printing is enabling customized designs and personalized tableware, catering to niche markets and increasing customer engagement. These innovations enhance the functional and aesthetic appeal of ceramic tableware, improving market fit and competitiveness.
Report Scope & Segmentation Analysis
This report segments the Ceramic Tableware Market based on Type (Porcelain and Bone China, Stoneware (Ceramic), Others), End User (Household, Commercial), and Distribution Channel (Supermarkets & Hypermarkets, Specialty Stores, Wholesalers, Online, Others). Each segment's growth projections, market sizes, and competitive dynamics are analyzed, offering granular insights into market opportunities. The market size for Porcelain and Bone China is estimated at $xx Million in 2025, projected to grow to $xx Million by 2033. Stoneware (Ceramic) is expected to witness substantial growth, driven by its cost-effectiveness and durability. The Household segment is projected to retain its dominant position, with substantial growth anticipated in the Commercial segment.
Key Drivers of Ceramic Tableware Market Growth
Key growth drivers include increasing disposable incomes, particularly in developing economies; a rising preference for aesthetically pleasing and high-quality tableware; and the expanding food service industry. Technological advancements in materials and manufacturing processes are also contributing to market expansion. Government initiatives promoting sustainable practices and locally sourced materials further influence the market.
Challenges in the Ceramic Tableware Market Sector
Challenges include fluctuations in raw material prices, increasing energy costs, and intense competition from substitutes. Supply chain disruptions and environmental concerns related to manufacturing processes pose further obstacles. Stricter regulations concerning food safety and material composition can also impact profitability. These factors collectively present challenges to market growth, potentially reducing profit margins by an estimated xx% in the next few years.
Emerging Opportunities in Ceramic Tableware Market
Emerging opportunities lie in the increasing demand for personalized and customized tableware, driven by rising consumer preferences for unique designs. The adoption of sustainable manufacturing practices, using eco-friendly materials, presents a strong growth avenue. Expansion into new markets and regions with rising disposable incomes offers significant potential.
Leading Players in the Ceramic Tableware Market Market
- Portmeirion Group PLC
- The Oneida Group
- Rosenthal GmbH
- Lenox
- Meissen
- Libbey
- Seltmann Weiden
- RAK Porcelain
- Narumi
- KAHLA Porzellan
- WMF
- SCHONWALD
- Churchill China
- Villeroy & Boch
- TATA ceramics
- Sitong Group
- Fiskars Group
Key Developments in Ceramic Tableware Market Industry
- January 2023: [Company Name] launched a new line of sustainable ceramic tableware.
- June 2022: [Company Name] acquired [Company Name], expanding its market reach.
- October 2021: A significant technological advancement in ceramic glaze technology was announced, improving durability and hygiene.
- (Further developments to be added with specific details)
Future Outlook for Ceramic Tableware Market Market
The Ceramic Tableware Market is poised for continued growth, driven by sustained demand from both household and commercial sectors. Further innovation in materials, designs, and manufacturing processes will be key to maintaining competitiveness. Strategic partnerships and expansions into new markets, coupled with a focus on sustainability, will be crucial for players seeking to capitalize on future opportunities. The market is expected to reach a value of $xx Million by 2033.
Ceramic Tableware Market Segmentation
-
1. Type
- 1.1. Porcelain and Bone China
- 1.2. Stoneware (Ceramic)
- 1.3. Others
-
2. End User
- 2.1. Household
-
2.2. Commercial
- 2.2.1. Accommodation and Hospitality Segment
- 2.2.2. Food Service Segment
- 2.2.3. Others
-
3. Distribution Channel
- 3.1. Supermarkets & Hypermarkets
- 3.2. Specialty Stores
- 3.3. Wholesalers
- 3.4. Online
- 3.5. Others
Ceramic Tableware Market Segmentation By Geography
- 1. North America
- 2. Asia Pacific
- 3. Europe
- 4. Latin America
- 5. Middle East and Africa
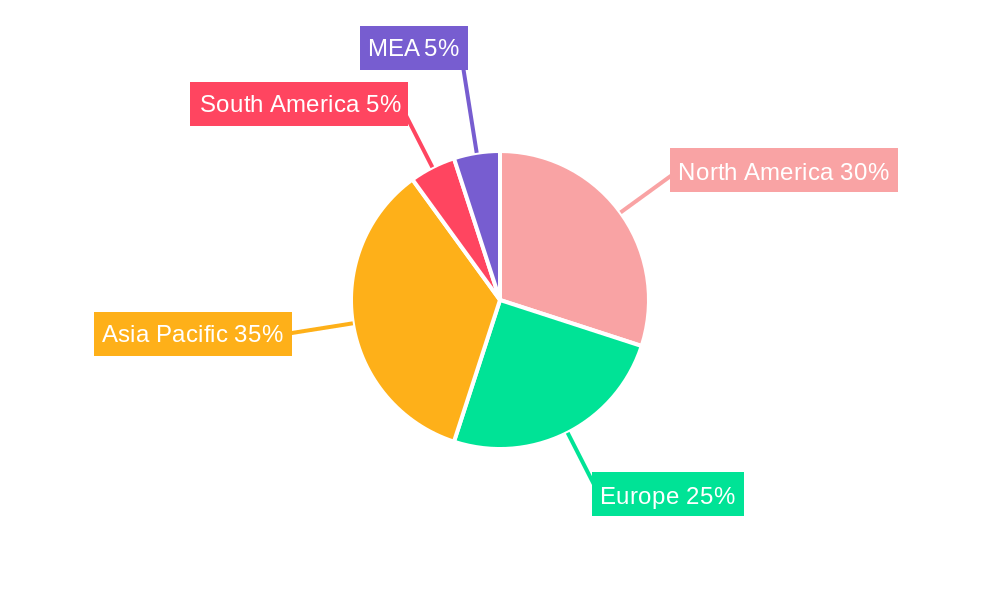
Ceramic Tableware Market Regional Market Share
Geographic Coverage of Ceramic Tableware Market
Ceramic Tableware Market REPORT HIGHLIGHTS
| Aspects | Details |
|---|---|
| Study Period | 2020-2034 |
| Base Year | 2025 |
| Estimated Year | 2026 |
| Forecast Period | 2026-2034 |
| Historical Period | 2020-2025 |
| Growth Rate | CAGR of 6.21% from 2020-2034 |
| Segmentation |
|
Table of Contents
- 1. Introduction
- 1.1. Research Scope
- 1.2. Market Segmentation
- 1.3. Research Objective
- 1.4. Definitions and Assumptions
- 2. Executive Summary
- 2.1. Market Snapshot
- 3. Market Dynamics
- 3.1. Market Drivers
- 3.2. Market Restrains
- 3.3. Market Trends
- 3.4. Market Opportunities
- 4. Market Factor Analysis
- 4.1. Porters Five Forces
- 4.1.1. Bargaining Power of Suppliers
- 4.1.2. Bargaining Power of Buyers
- 4.1.3. Threat of New Entrants
- 4.1.4. Threat of Substitutes
- 4.1.5. Competitive Rivalry
- 4.2. PESTEL analysis
- 4.3. BCG Analysis
- 4.3.1. Stars (High Growth, High Market Share)
- 4.3.2. Cash Cows (Low Growth, High Market Share)
- 4.3.3. Question Mark (High Growth, Low Market Share)
- 4.3.4. Dogs (Low Growth, Low Market Share)
- 4.4. Ansoff Matrix Analysis
- 4.5. Supply Chain Analysis
- 4.6. Regulatory Landscape
- 4.7. Current Market Potential and Opportunity Assessment (TAM–SAM–SOM Framework)
- 4.8. PRI Analyst Note
- 4.1. Porters Five Forces
- 5. Market Analysis, Insights and Forecast 2021-2033
- 5.1. Market Analysis, Insights and Forecast - by Type
- 5.1.1. Porcelain and Bone China
- 5.1.2. Stoneware (Ceramic)
- 5.1.3. Others
- 5.2. Market Analysis, Insights and Forecast - by End User
- 5.2.1. Household
- 5.2.2. Commercial
- 5.2.2.1. Accommodation and Hospitality Segment
- 5.2.2.2. Food Service Segment
- 5.2.2.3. Others
- 5.3. Market Analysis, Insights and Forecast - by Distribution Channel
- 5.3.1. Supermarkets & Hypermarkets
- 5.3.2. Specialty Stores
- 5.3.3. Wholesalers
- 5.3.4. Online
- 5.3.5. Others
- 5.4. Market Analysis, Insights and Forecast - by Region
- 5.4.1. North America
- 5.4.2. Asia Pacific
- 5.4.3. Europe
- 5.4.4. Latin America
- 5.4.5. Middle East and Africa
- 5.1. Market Analysis, Insights and Forecast - by Type
- 6. Global Ceramic Tableware Market Analysis, Insights and Forecast, 2021-2033
- 6.1. Market Analysis, Insights and Forecast - by Type
- 6.1.1. Porcelain and Bone China
- 6.1.2. Stoneware (Ceramic)
- 6.1.3. Others
- 6.2. Market Analysis, Insights and Forecast - by End User
- 6.2.1. Household
- 6.2.2. Commercial
- 6.2.2.1. Accommodation and Hospitality Segment
- 6.2.2.2. Food Service Segment
- 6.2.2.3. Others
- 6.3. Market Analysis, Insights and Forecast - by Distribution Channel
- 6.3.1. Supermarkets & Hypermarkets
- 6.3.2. Specialty Stores
- 6.3.3. Wholesalers
- 6.3.4. Online
- 6.3.5. Others
- 6.1. Market Analysis, Insights and Forecast - by Type
- 7. North America Ceramic Tableware Market Analysis, Insights and Forecast, 2020-2032
- 7.1. Market Analysis, Insights and Forecast - by Type
- 7.1.1. Porcelain and Bone China
- 7.1.2. Stoneware (Ceramic)
- 7.1.3. Others
- 7.2. Market Analysis, Insights and Forecast - by End User
- 7.2.1. Household
- 7.2.2. Commercial
- 7.2.2.1. Accommodation and Hospitality Segment
- 7.2.2.2. Food Service Segment
- 7.2.2.3. Others
- 7.3. Market Analysis, Insights and Forecast - by Distribution Channel
- 7.3.1. Supermarkets & Hypermarkets
- 7.3.2. Specialty Stores
- 7.3.3. Wholesalers
- 7.3.4. Online
- 7.3.5. Others
- 7.1. Market Analysis, Insights and Forecast - by Type
- 8. Asia Pacific Ceramic Tableware Market Analysis, Insights and Forecast, 2020-2032
- 8.1. Market Analysis, Insights and Forecast - by Type
- 8.1.1. Porcelain and Bone China
- 8.1.2. Stoneware (Ceramic)
- 8.1.3. Others
- 8.2. Market Analysis, Insights and Forecast - by End User
- 8.2.1. Household
- 8.2.2. Commercial
- 8.2.2.1. Accommodation and Hospitality Segment
- 8.2.2.2. Food Service Segment
- 8.2.2.3. Others
- 8.3. Market Analysis, Insights and Forecast - by Distribution Channel
- 8.3.1. Supermarkets & Hypermarkets
- 8.3.2. Specialty Stores
- 8.3.3. Wholesalers
- 8.3.4. Online
- 8.3.5. Others
- 8.1. Market Analysis, Insights and Forecast - by Type
- 9. Europe Ceramic Tableware Market Analysis, Insights and Forecast, 2020-2032
- 9.1. Market Analysis, Insights and Forecast - by Type
- 9.1.1. Porcelain and Bone China
- 9.1.2. Stoneware (Ceramic)
- 9.1.3. Others
- 9.2. Market Analysis, Insights and Forecast - by End User
- 9.2.1. Household
- 9.2.2. Commercial
- 9.2.2.1. Accommodation and Hospitality Segment
- 9.2.2.2. Food Service Segment
- 9.2.2.3. Others
- 9.3. Market Analysis, Insights and Forecast - by Distribution Channel
- 9.3.1. Supermarkets & Hypermarkets
- 9.3.2. Specialty Stores
- 9.3.3. Wholesalers
- 9.3.4. Online
- 9.3.5. Others
- 9.1. Market Analysis, Insights and Forecast - by Type
- 10. Latin America Ceramic Tableware Market Analysis, Insights and Forecast, 2020-2032
- 10.1. Market Analysis, Insights and Forecast - by Type
- 10.1.1. Porcelain and Bone China
- 10.1.2. Stoneware (Ceramic)
- 10.1.3. Others
- 10.2. Market Analysis, Insights and Forecast - by End User
- 10.2.1. Household
- 10.2.2. Commercial
- 10.2.2.1. Accommodation and Hospitality Segment
- 10.2.2.2. Food Service Segment
- 10.2.2.3. Others
- 10.3. Market Analysis, Insights and Forecast - by Distribution Channel
- 10.3.1. Supermarkets & Hypermarkets
- 10.3.2. Specialty Stores
- 10.3.3. Wholesalers
- 10.3.4. Online
- 10.3.5. Others
- 10.1. Market Analysis, Insights and Forecast - by Type
- 11. Middle East and Africa Ceramic Tableware Market Analysis, Insights and Forecast, 2020-2032
- 11.1. Market Analysis, Insights and Forecast - by Type
- 11.1.1. Porcelain and Bone China
- 11.1.2. Stoneware (Ceramic)
- 11.1.3. Others
- 11.2. Market Analysis, Insights and Forecast - by End User
- 11.2.1. Household
- 11.2.2. Commercial
- 11.2.2.1. Accommodation and Hospitality Segment
- 11.2.2.2. Food Service Segment
- 11.2.2.3. Others
- 11.3. Market Analysis, Insights and Forecast - by Distribution Channel
- 11.3.1. Supermarkets & Hypermarkets
- 11.3.2. Specialty Stores
- 11.3.3. Wholesalers
- 11.3.4. Online
- 11.3.5. Others
- 11.1. Market Analysis, Insights and Forecast - by Type
- 12. Competitive Analysis
- 12.1. Company Profiles
- 12.1.1 Portmeirion Group PLC
- 12.1.1.1. Company Overview
- 12.1.1.2. Products
- 12.1.1.3. Company Financials
- 12.1.1.4. SWOT Analysis
- 12.1.2 The Oneida Group
- 12.1.2.1. Company Overview
- 12.1.2.2. Products
- 12.1.2.3. Company Financials
- 12.1.2.4. SWOT Analysis
- 12.1.3 Rosenthal GmbH
- 12.1.3.1. Company Overview
- 12.1.3.2. Products
- 12.1.3.3. Company Financials
- 12.1.3.4. SWOT Analysis
- 12.1.4 Lenox
- 12.1.4.1. Company Overview
- 12.1.4.2. Products
- 12.1.4.3. Company Financials
- 12.1.4.4. SWOT Analysis
- 12.1.5 Meissen
- 12.1.5.1. Company Overview
- 12.1.5.2. Products
- 12.1.5.3. Company Financials
- 12.1.5.4. SWOT Analysis
- 12.1.6 Libbey
- 12.1.6.1. Company Overview
- 12.1.6.2. Products
- 12.1.6.3. Company Financials
- 12.1.6.4. SWOT Analysis
- 12.1.7 Seltmann Weiden
- 12.1.7.1. Company Overview
- 12.1.7.2. Products
- 12.1.7.3. Company Financials
- 12.1.7.4. SWOT Analysis
- 12.1.8 RAK Porcelain
- 12.1.8.1. Company Overview
- 12.1.8.2. Products
- 12.1.8.3. Company Financials
- 12.1.8.4. SWOT Analysis
- 12.1.9 Narumi
- 12.1.9.1. Company Overview
- 12.1.9.2. Products
- 12.1.9.3. Company Financials
- 12.1.9.4. SWOT Analysis
- 12.1.10 KAHLA Porzellan
- 12.1.10.1. Company Overview
- 12.1.10.2. Products
- 12.1.10.3. Company Financials
- 12.1.10.4. SWOT Analysis
- 12.1.11 WMF
- 12.1.11.1. Company Overview
- 12.1.11.2. Products
- 12.1.11.3. Company Financials
- 12.1.11.4. SWOT Analysis
- 12.1.12 SCHONWALD
- 12.1.12.1. Company Overview
- 12.1.12.2. Products
- 12.1.12.3. Company Financials
- 12.1.12.4. SWOT Analysis
- 12.1.13 Churchill China
- 12.1.13.1. Company Overview
- 12.1.13.2. Products
- 12.1.13.3. Company Financials
- 12.1.13.4. SWOT Analysis
- 12.1.14 Villeroy & Boch
- 12.1.14.1. Company Overview
- 12.1.14.2. Products
- 12.1.14.3. Company Financials
- 12.1.14.4. SWOT Analysis
- 12.1.15 TATA ceramics
- 12.1.15.1. Company Overview
- 12.1.15.2. Products
- 12.1.15.3. Company Financials
- 12.1.15.4. SWOT Analysis
- 12.1.16 Sitong Group
- 12.1.16.1. Company Overview
- 12.1.16.2. Products
- 12.1.16.3. Company Financials
- 12.1.16.4. SWOT Analysis
- 12.1.17 Fiskars Group
- 12.1.17.1. Company Overview
- 12.1.17.2. Products
- 12.1.17.3. Company Financials
- 12.1.17.4. SWOT Analysis
- 12.1.1 Portmeirion Group PLC
- 12.2. Market Entropy
- 12.2.1 Company's Key Areas Served
- 12.2.2 Recent Developments
- 12.3. Company Market Share Analysis 2025
- 12.3.1 Top 5 Companies Market Share Analysis
- 12.3.2 Top 3 Companies Market Share Analysis
- 12.4. List of Potential Customers
- 13. Research Methodology
List of Figures
- Figure 1: Global Ceramic Tableware Market Revenue Breakdown (Million, %) by Region 2025 & 2033
- Figure 2: Global Ceramic Tableware Market Volume Breakdown (K Unit, %) by Region 2025 & 2033
- Figure 3: North America Ceramic Tableware Market Revenue (Million), by Type 2025 & 2033
- Figure 4: North America Ceramic Tableware Market Volume (K Unit), by Type 2025 & 2033
- Figure 5: North America Ceramic Tableware Market Revenue Share (%), by Type 2025 & 2033
- Figure 6: North America Ceramic Tableware Market Volume Share (%), by Type 2025 & 2033
- Figure 7: North America Ceramic Tableware Market Revenue (Million), by End User 2025 & 2033
- Figure 8: North America Ceramic Tableware Market Volume (K Unit), by End User 2025 & 2033
- Figure 9: North America Ceramic Tableware Market Revenue Share (%), by End User 2025 & 2033
- Figure 10: North America Ceramic Tableware Market Volume Share (%), by End User 2025 & 2033
- Figure 11: North America Ceramic Tableware Market Revenue (Million), by Distribution Channel 2025 & 2033
- Figure 12: North America Ceramic Tableware Market Volume (K Unit), by Distribution Channel 2025 & 2033
- Figure 13: North America Ceramic Tableware Market Revenue Share (%), by Distribution Channel 2025 & 2033
- Figure 14: North America Ceramic Tableware Market Volume Share (%), by Distribution Channel 2025 & 2033
- Figure 15: North America Ceramic Tableware Market Revenue (Million), by Country 2025 & 2033
- Figure 16: North America Ceramic Tableware Market Volume (K Unit), by Country 2025 & 2033
- Figure 17: North America Ceramic Tableware Market Revenue Share (%), by Country 2025 & 2033
- Figure 18: North America Ceramic Tableware Market Volume Share (%), by Country 2025 & 2033
- Figure 19: Asia Pacific Ceramic Tableware Market Revenue (Million), by Type 2025 & 2033
- Figure 20: Asia Pacific Ceramic Tableware Market Volume (K Unit), by Type 2025 & 2033
- Figure 21: Asia Pacific Ceramic Tableware Market Revenue Share (%), by Type 2025 & 2033
- Figure 22: Asia Pacific Ceramic Tableware Market Volume Share (%), by Type 2025 & 2033
- Figure 23: Asia Pacific Ceramic Tableware Market Revenue (Million), by End User 2025 & 2033
- Figure 24: Asia Pacific Ceramic Tableware Market Volume (K Unit), by End User 2025 & 2033
- Figure 25: Asia Pacific Ceramic Tableware Market Revenue Share (%), by End User 2025 & 2033
- Figure 26: Asia Pacific Ceramic Tableware Market Volume Share (%), by End User 2025 & 2033
- Figure 27: Asia Pacific Ceramic Tableware Market Revenue (Million), by Distribution Channel 2025 & 2033
- Figure 28: Asia Pacific Ceramic Tableware Market Volume (K Unit), by Distribution Channel 2025 & 2033
- Figure 29: Asia Pacific Ceramic Tableware Market Revenue Share (%), by Distribution Channel 2025 & 2033
- Figure 30: Asia Pacific Ceramic Tableware Market Volume Share (%), by Distribution Channel 2025 & 2033
- Figure 31: Asia Pacific Ceramic Tableware Market Revenue (Million), by Country 2025 & 2033
- Figure 32: Asia Pacific Ceramic Tableware Market Volume (K Unit), by Country 2025 & 2033
- Figure 33: Asia Pacific Ceramic Tableware Market Revenue Share (%), by Country 2025 & 2033
- Figure 34: Asia Pacific Ceramic Tableware Market Volume Share (%), by Country 2025 & 2033
- Figure 35: Europe Ceramic Tableware Market Revenue (Million), by Type 2025 & 2033
- Figure 36: Europe Ceramic Tableware Market Volume (K Unit), by Type 2025 & 2033
- Figure 37: Europe Ceramic Tableware Market Revenue Share (%), by Type 2025 & 2033
- Figure 38: Europe Ceramic Tableware Market Volume Share (%), by Type 2025 & 2033
- Figure 39: Europe Ceramic Tableware Market Revenue (Million), by End User 2025 & 2033
- Figure 40: Europe Ceramic Tableware Market Volume (K Unit), by End User 2025 & 2033
- Figure 41: Europe Ceramic Tableware Market Revenue Share (%), by End User 2025 & 2033
- Figure 42: Europe Ceramic Tableware Market Volume Share (%), by End User 2025 & 2033
- Figure 43: Europe Ceramic Tableware Market Revenue (Million), by Distribution Channel 2025 & 2033
- Figure 44: Europe Ceramic Tableware Market Volume (K Unit), by Distribution Channel 2025 & 2033
- Figure 45: Europe Ceramic Tableware Market Revenue Share (%), by Distribution Channel 2025 & 2033
- Figure 46: Europe Ceramic Tableware Market Volume Share (%), by Distribution Channel 2025 & 2033
- Figure 47: Europe Ceramic Tableware Market Revenue (Million), by Country 2025 & 2033
- Figure 48: Europe Ceramic Tableware Market Volume (K Unit), by Country 2025 & 2033
- Figure 49: Europe Ceramic Tableware Market Revenue Share (%), by Country 2025 & 2033
- Figure 50: Europe Ceramic Tableware Market Volume Share (%), by Country 2025 & 2033
- Figure 51: Latin America Ceramic Tableware Market Revenue (Million), by Type 2025 & 2033
- Figure 52: Latin America Ceramic Tableware Market Volume (K Unit), by Type 2025 & 2033
- Figure 53: Latin America Ceramic Tableware Market Revenue Share (%), by Type 2025 & 2033
- Figure 54: Latin America Ceramic Tableware Market Volume Share (%), by Type 2025 & 2033
- Figure 55: Latin America Ceramic Tableware Market Revenue (Million), by End User 2025 & 2033
- Figure 56: Latin America Ceramic Tableware Market Volume (K Unit), by End User 2025 & 2033
- Figure 57: Latin America Ceramic Tableware Market Revenue Share (%), by End User 2025 & 2033
- Figure 58: Latin America Ceramic Tableware Market Volume Share (%), by End User 2025 & 2033
- Figure 59: Latin America Ceramic Tableware Market Revenue (Million), by Distribution Channel 2025 & 2033
- Figure 60: Latin America Ceramic Tableware Market Volume (K Unit), by Distribution Channel 2025 & 2033
- Figure 61: Latin America Ceramic Tableware Market Revenue Share (%), by Distribution Channel 2025 & 2033
- Figure 62: Latin America Ceramic Tableware Market Volume Share (%), by Distribution Channel 2025 & 2033
- Figure 63: Latin America Ceramic Tableware Market Revenue (Million), by Country 2025 & 2033
- Figure 64: Latin America Ceramic Tableware Market Volume (K Unit), by Country 2025 & 2033
- Figure 65: Latin America Ceramic Tableware Market Revenue Share (%), by Country 2025 & 2033
- Figure 66: Latin America Ceramic Tableware Market Volume Share (%), by Country 2025 & 2033
- Figure 67: Middle East and Africa Ceramic Tableware Market Revenue (Million), by Type 2025 & 2033
- Figure 68: Middle East and Africa Ceramic Tableware Market Volume (K Unit), by Type 2025 & 2033
- Figure 69: Middle East and Africa Ceramic Tableware Market Revenue Share (%), by Type 2025 & 2033
- Figure 70: Middle East and Africa Ceramic Tableware Market Volume Share (%), by Type 2025 & 2033
- Figure 71: Middle East and Africa Ceramic Tableware Market Revenue (Million), by End User 2025 & 2033
- Figure 72: Middle East and Africa Ceramic Tableware Market Volume (K Unit), by End User 2025 & 2033
- Figure 73: Middle East and Africa Ceramic Tableware Market Revenue Share (%), by End User 2025 & 2033
- Figure 74: Middle East and Africa Ceramic Tableware Market Volume Share (%), by End User 2025 & 2033
- Figure 75: Middle East and Africa Ceramic Tableware Market Revenue (Million), by Distribution Channel 2025 & 2033
- Figure 76: Middle East and Africa Ceramic Tableware Market Volume (K Unit), by Distribution Channel 2025 & 2033
- Figure 77: Middle East and Africa Ceramic Tableware Market Revenue Share (%), by Distribution Channel 2025 & 2033
- Figure 78: Middle East and Africa Ceramic Tableware Market Volume Share (%), by Distribution Channel 2025 & 2033
- Figure 79: Middle East and Africa Ceramic Tableware Market Revenue (Million), by Country 2025 & 2033
- Figure 80: Middle East and Africa Ceramic Tableware Market Volume (K Unit), by Country 2025 & 2033
- Figure 81: Middle East and Africa Ceramic Tableware Market Revenue Share (%), by Country 2025 & 2033
- Figure 82: Middle East and Africa Ceramic Tableware Market Volume Share (%), by Country 2025 & 2033
List of Tables
- Table 1: Global Ceramic Tableware Market Revenue Million Forecast, by Type 2020 & 2033
- Table 2: Global Ceramic Tableware Market Volume K Unit Forecast, by Type 2020 & 2033
- Table 3: Global Ceramic Tableware Market Revenue Million Forecast, by End User 2020 & 2033
- Table 4: Global Ceramic Tableware Market Volume K Unit Forecast, by End User 2020 & 2033
- Table 5: Global Ceramic Tableware Market Revenue Million Forecast, by Distribution Channel 2020 & 2033
- Table 6: Global Ceramic Tableware Market Volume K Unit Forecast, by Distribution Channel 2020 & 2033
- Table 7: Global Ceramic Tableware Market Revenue Million Forecast, by Region 2020 & 2033
- Table 8: Global Ceramic Tableware Market Volume K Unit Forecast, by Region 2020 & 2033
- Table 9: Global Ceramic Tableware Market Revenue Million Forecast, by Type 2020 & 2033
- Table 10: Global Ceramic Tableware Market Volume K Unit Forecast, by Type 2020 & 2033
- Table 11: Global Ceramic Tableware Market Revenue Million Forecast, by End User 2020 & 2033
- Table 12: Global Ceramic Tableware Market Volume K Unit Forecast, by End User 2020 & 2033
- Table 13: Global Ceramic Tableware Market Revenue Million Forecast, by Distribution Channel 2020 & 2033
- Table 14: Global Ceramic Tableware Market Volume K Unit Forecast, by Distribution Channel 2020 & 2033
- Table 15: Global Ceramic Tableware Market Revenue Million Forecast, by Country 2020 & 2033
- Table 16: Global Ceramic Tableware Market Volume K Unit Forecast, by Country 2020 & 2033
- Table 17: Global Ceramic Tableware Market Revenue Million Forecast, by Type 2020 & 2033
- Table 18: Global Ceramic Tableware Market Volume K Unit Forecast, by Type 2020 & 2033
- Table 19: Global Ceramic Tableware Market Revenue Million Forecast, by End User 2020 & 2033
- Table 20: Global Ceramic Tableware Market Volume K Unit Forecast, by End User 2020 & 2033
- Table 21: Global Ceramic Tableware Market Revenue Million Forecast, by Distribution Channel 2020 & 2033
- Table 22: Global Ceramic Tableware Market Volume K Unit Forecast, by Distribution Channel 2020 & 2033
- Table 23: Global Ceramic Tableware Market Revenue Million Forecast, by Country 2020 & 2033
- Table 24: Global Ceramic Tableware Market Volume K Unit Forecast, by Country 2020 & 2033
- Table 25: Global Ceramic Tableware Market Revenue Million Forecast, by Type 2020 & 2033
- Table 26: Global Ceramic Tableware Market Volume K Unit Forecast, by Type 2020 & 2033
- Table 27: Global Ceramic Tableware Market Revenue Million Forecast, by End User 2020 & 2033
- Table 28: Global Ceramic Tableware Market Volume K Unit Forecast, by End User 2020 & 2033
- Table 29: Global Ceramic Tableware Market Revenue Million Forecast, by Distribution Channel 2020 & 2033
- Table 30: Global Ceramic Tableware Market Volume K Unit Forecast, by Distribution Channel 2020 & 2033
- Table 31: Global Ceramic Tableware Market Revenue Million Forecast, by Country 2020 & 2033
- Table 32: Global Ceramic Tableware Market Volume K Unit Forecast, by Country 2020 & 2033
- Table 33: Global Ceramic Tableware Market Revenue Million Forecast, by Type 2020 & 2033
- Table 34: Global Ceramic Tableware Market Volume K Unit Forecast, by Type 2020 & 2033
- Table 35: Global Ceramic Tableware Market Revenue Million Forecast, by End User 2020 & 2033
- Table 36: Global Ceramic Tableware Market Volume K Unit Forecast, by End User 2020 & 2033
- Table 37: Global Ceramic Tableware Market Revenue Million Forecast, by Distribution Channel 2020 & 2033
- Table 38: Global Ceramic Tableware Market Volume K Unit Forecast, by Distribution Channel 2020 & 2033
- Table 39: Global Ceramic Tableware Market Revenue Million Forecast, by Country 2020 & 2033
- Table 40: Global Ceramic Tableware Market Volume K Unit Forecast, by Country 2020 & 2033
- Table 41: Global Ceramic Tableware Market Revenue Million Forecast, by Type 2020 & 2033
- Table 42: Global Ceramic Tableware Market Volume K Unit Forecast, by Type 2020 & 2033
- Table 43: Global Ceramic Tableware Market Revenue Million Forecast, by End User 2020 & 2033
- Table 44: Global Ceramic Tableware Market Volume K Unit Forecast, by End User 2020 & 2033
- Table 45: Global Ceramic Tableware Market Revenue Million Forecast, by Distribution Channel 2020 & 2033
- Table 46: Global Ceramic Tableware Market Volume K Unit Forecast, by Distribution Channel 2020 & 2033
- Table 47: Global Ceramic Tableware Market Revenue Million Forecast, by Country 2020 & 2033
- Table 48: Global Ceramic Tableware Market Volume K Unit Forecast, by Country 2020 & 2033
Frequently Asked Questions
1. What is the projected Compound Annual Growth Rate (CAGR) of the Ceramic Tableware Market?
The projected CAGR is approximately 6.21%.
2. Which companies are prominent players in the Ceramic Tableware Market?
Key companies in the market include Portmeirion Group PLC, The Oneida Group, Rosenthal GmbH, Lenox, Meissen, Libbey, Seltmann Weiden, RAK Porcelain, Narumi, KAHLA Porzellan, WMF, SCHONWALD, Churchill China, Villeroy & Boch, TATA ceramics, Sitong Group, Fiskars Group.
3. What are the main segments of the Ceramic Tableware Market?
The market segments include Type, End User, Distribution Channel.
4. Can you provide details about the market size?
The market size is estimated to be USD 58.29 Million as of 2022.
5. What are some drivers contributing to market growth?
Increasing Demand for Office Supplies; Growing E-commerce Trends.
6. What are the notable trends driving market growth?
Rapid Growth of Online Sales is Driving the Market.
7. Are there any restraints impacting market growth?
Increasing Digitization of Work and Communication.
8. Can you provide examples of recent developments in the market?
N/A
9. What pricing options are available for accessing the report?
Pricing options include single-user, multi-user, and enterprise licenses priced at USD 4750, USD 5250, and USD 8750 respectively.
10. Is the market size provided in terms of value or volume?
The market size is provided in terms of value, measured in Million and volume, measured in K Unit.
11. Are there any specific market keywords associated with the report?
Yes, the market keyword associated with the report is "Ceramic Tableware Market," which aids in identifying and referencing the specific market segment covered.
12. How do I determine which pricing option suits my needs best?
The pricing options vary based on user requirements and access needs. Individual users may opt for single-user licenses, while businesses requiring broader access may choose multi-user or enterprise licenses for cost-effective access to the report.
13. Are there any additional resources or data provided in the Ceramic Tableware Market report?
While the report offers comprehensive insights, it's advisable to review the specific contents or supplementary materials provided to ascertain if additional resources or data are available.
14. How can I stay updated on further developments or reports in the Ceramic Tableware Market?
To stay informed about further developments, trends, and reports in the Ceramic Tableware Market, consider subscribing to industry newsletters, following relevant companies and organizations, or regularly checking reputable industry news sources and publications.
Methodology
Step 1 - Identification of Relevant Samples Size from Population Database


Step 2 - Approaches for Defining Global Market Size (Value, Volume* & Price*)

Note*: In applicable scenarios
Step 3 - Data Sources
Primary Research
- Web Analytics
- Survey Reports
- Research Institute
- Latest Research Reports
- Opinion Leaders
Secondary Research
- Annual Reports
- White Paper
- Latest Press Release
- Industry Association
- Paid Database
- Investor Presentations

Step 4 - Data Triangulation
Involves using different sources of information in order to increase the validity of a study
These sources are likely to be stakeholders in a program - participants, other researchers, program staff, other community members, and so on.
Then we put all data in single framework & apply various statistical tools to find out the dynamic on the market.
During the analysis stage, feedback from the stakeholder groups would be compared to determine areas of agreement as well as areas of divergence