

Key Insights
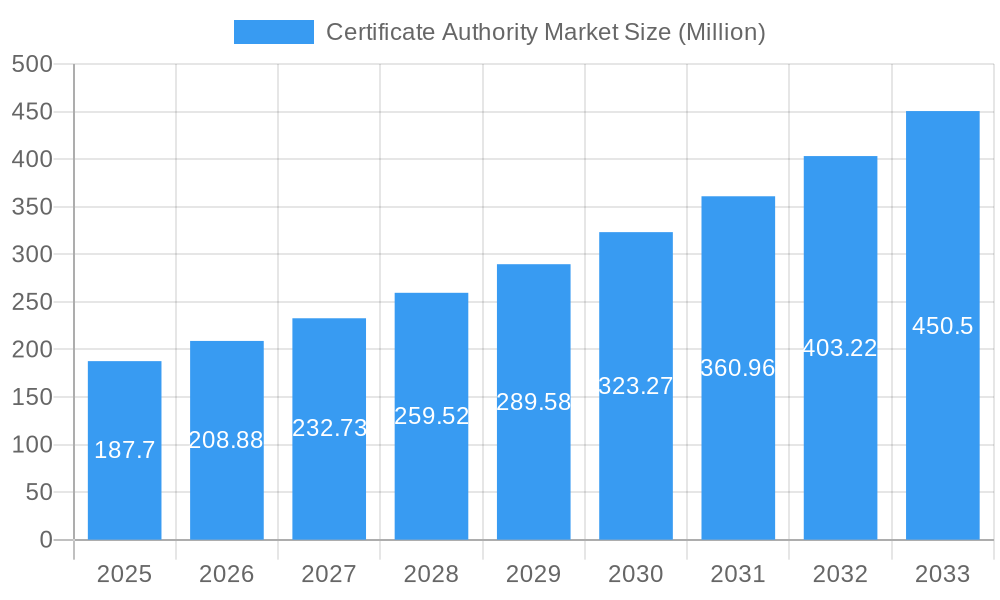
The Certificate Authority (CA) market, valued at $187.70 million in 2025, is experiencing robust growth, projected to expand at a Compound Annual Growth Rate (CAGR) of 11.18% from 2025 to 2033. This expansion is driven by the increasing demand for secure digital transactions and the rising adoption of digital certificates across various sectors. The surge in e-commerce, online banking, and the Internet of Things (IoT) necessitates robust digital identity and data security solutions, fueling the demand for CA services. Furthermore, stricter government regulations regarding data privacy and security are compelling organizations to adopt advanced certificate management systems, contributing significantly to market growth. Segmentation reveals a strong presence of large enterprises within the market, reflecting their higher security needs and budgets. The BFSI (Banking, Financial Services, and Insurance) sector, owing to its sensitivity to security breaches, represents a dominant end-user vertical. Competition within the market is intense, with established players like DigiCert, GlobalSign, and Sectigo vying for market share alongside emerging CA providers specializing in niche areas like IoT security. The market's future growth hinges on continued technological advancements in certificate management, the expanding adoption of cloud-based security solutions, and the evolving regulatory landscape around data protection and digital identity verification.
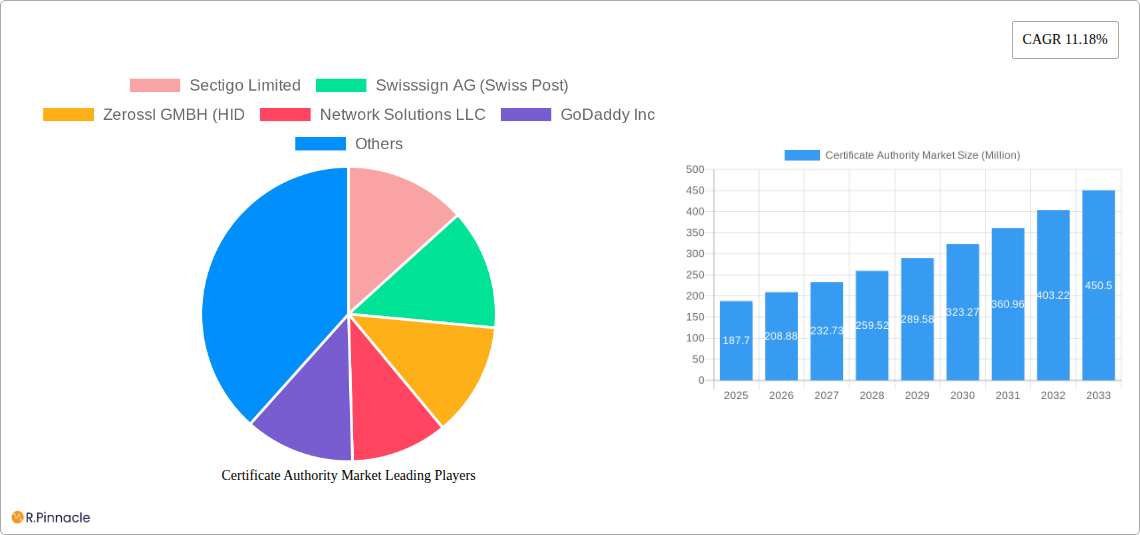
Certificate Authority Market Market Size (In Million)
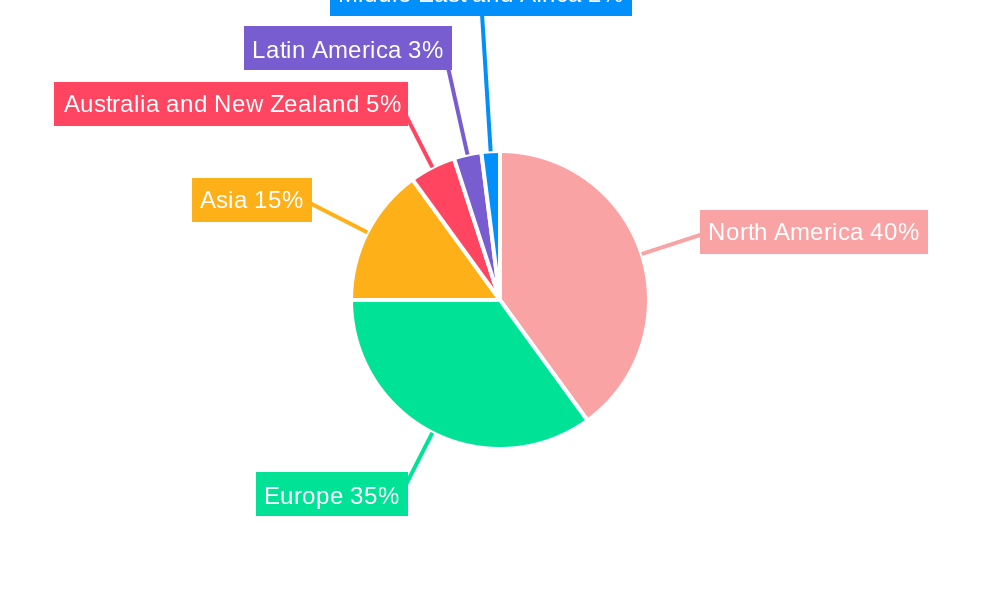
The geographical distribution of the CA market shows a substantial presence in North America and Europe, driven by established digital infrastructures and a high concentration of large enterprises. However, Asia-Pacific is anticipated to witness significant growth in the coming years, propelled by rapid digitalization and increasing internet penetration in developing economies. The rising adoption of cloud-based services and the increasing prevalence of cyber threats in these regions will act as catalysts for market growth. The market is expected to benefit from increased government investment in cybersecurity infrastructure and the rising awareness of the importance of data security among businesses and individuals. While challenges such as the complexity of certificate management and the potential for certificate-related vulnerabilities exist, the overall growth outlook for the CA market remains positive, indicating a significant potential for investment and expansion in the foreseeable future.
Certificate Authority Market Company Market Share
Certificate Authority Market Report: 2019-2033
This comprehensive report provides a detailed analysis of the Certificate Authority market, offering invaluable insights for industry professionals, investors, and strategic decision-makers. Covering the period from 2019 to 2033, with a focus on 2025, this report unveils the market's structure, dynamics, leading players, and future outlook. The study period is 2019-2033, the base year is 2025, the estimated year is 2025, and the forecast period is 2025-2033, with a historical period of 2019-2024. The market is segmented by component (Certificate Types, Authentication Certificates, Services), organization size (Large Enterprises, Small and Medium-Sized Enterprises), and end-user vertical (BFSI, Retail, Healthcare, IT and Telecom, Other End-user Verticals). The report's value is xx Million.
Certificate Authority Market Market Structure & Innovation Trends
The Certificate Authority market exhibits a moderately consolidated structure, with several key players holding significant market share. The market share of the top five players is estimated to be around xx%. Innovation is driven by the increasing need for robust digital security, particularly with the rise of cloud computing, IoT, and other digital transformations. Regulatory frameworks, such as those concerning data privacy and cybersecurity, significantly influence market practices. Product substitutes, while limited, include self-signed certificates; however, these lack the trust and reliability of certificates issued by established CAs. The end-user demographics are diverse, ranging from large enterprises to SMEs across various sectors. M&A activity has been relatively high, with several significant deals recorded in recent years, totaling an estimated xx Million in value. Key examples include:
- Consolidation among smaller CAs to achieve economies of scale.
- Acquisitions by larger technology companies to enhance their security offerings.
Certificate Authority Market Market Dynamics & Trends
The Certificate Authority market is experiencing robust growth, driven by several key factors. The increasing adoption of digital technologies across various sectors fuels demand for secure digital identities and transactions. The global CAGR for the market is projected to be xx% during the forecast period. Technological disruptions, such as the evolution of quantum-resistant cryptography, are shaping the market's future. Consumer preference is shifting towards more user-friendly and automated certificate management solutions. Competitive dynamics are characterized by a mix of established players and emerging competitors, leading to innovation in pricing, service offerings, and technological advancements. Market penetration is currently estimated at xx%, with significant growth potential across various regions and verticals.
Dominant Regions & Segments in Certificate Authority Market
The North American region currently holds the largest market share, driven by a high concentration of technology companies and stringent cybersecurity regulations. However, the Asia-Pacific region is expected to witness the highest growth rate during the forecast period, fueled by rapid digitalization and expanding internet penetration.
- Key Drivers for North America: Strong regulatory environment, high adoption of digital technologies.
- Key Drivers for Asia-Pacific: Rapid digitalization, rising internet penetration, increasing government investment in cybersecurity.
By component, Authentication Certificates hold a significant market share, followed by Certificate Types and Services. Large Enterprises dominate the market by organization size, due to their higher security needs and budgets. The BFSI sector is the leading end-user vertical, driven by stringent compliance requirements and the high value of financial transactions.
Certificate Authority Market Product Innovations
Recent product innovations focus on improving the efficiency and scalability of certificate management, including automated provisioning, lifecycle management tools, and integration with cloud platforms. The emphasis is on streamlining the issuance process and enhancing security features, such as incorporating advanced encryption algorithms and supporting emerging technologies like IoT and blockchain. These innovations provide competitive advantages by improving user experience, reducing operational costs, and strengthening security postures.
Report Scope & Segmentation Analysis
This report provides a comprehensive analysis of the Certificate Authority market across various segments:
By Component: Certificate Types, Authentication Certificates, and Services each represent distinct market segments with varying growth trajectories and competitive dynamics. The growth projection for each segment depends on factors such as technological advancements and industry adoption rates.
By Organization Size: Large Enterprises and Small and Medium-Sized Enterprises have different security needs and budgets, resulting in distinct market characteristics and growth prospects. Market sizes vary considerably between these segments.
By End-user Vertical: BFSI, Retail, Healthcare, IT and Telecom, and Other End-user Verticals showcase distinct security priorities and adoption rates for CA services, leading to varied market sizes and competitive landscapes.
Key Drivers of Certificate Authority Market Growth
The Certificate Authority market's growth is fueled by several factors. The rise of digital transactions necessitates secure authentication and encryption. Government regulations promoting data privacy and cybersecurity are driving adoption. The expansion of cloud computing and IoT further enhances demand. The increasing sophistication of cyber threats necessitates more advanced security solutions.
Challenges in the Certificate Authority Market Sector
The Certificate Authority market faces challenges including the increasing complexity of cyber threats, requiring continuous innovation in security technology. Regulatory compliance can be complex and costly. Competition among numerous players can create price pressure. Supply chain disruptions can impact the availability of certificates.
Emerging Opportunities in Certificate Authority Market
Emerging opportunities include growth in the IoT market, requiring secure authentication for billions of connected devices. The demand for quantum-resistant cryptography represents a significant opportunity for CA providers. Expansion into emerging markets with increasing digital adoption offers substantial potential.
Leading Players in the Certificate Authority Market Market
- Sectigo Limited
- Swisssign AG (Swiss Post)
- Zerossl GMBH
- Network Solutions LLC
- GoDaddy Inc
- Trustwave Holdings Inc (Chertoff Group)
- GlobalSign
- Actalis S p A
- Camerfirma SA
- WISeKey International Holdings Ltd
- DigiCert Inc
- OneSpan Inc
- Asseco Data Systems SA (Asseco Poland SA)
- Buypass AS
- Entrust Corporation
- SSL Com
Key Developments in Certificate Authority Market Industry
- February 2024: GlobalSign launched a new Kubernetes cert-manager issuer, simplifying certificate management for Kubernetes users.
- January 2024: Aquion partnered with Trustwave to enhance cybersecurity solutions in Australia and New Zealand.
Future Outlook for Certificate Authority Market Market
The Certificate Authority market is poised for continued growth, driven by increasing digitalization, stringent security regulations, and the emergence of new technologies. Strategic partnerships, technological innovations, and expansion into new markets will be key success factors. The market is expected to reach xx Million by 2033.
Certificate Authority Market Segmentation
-
1. Component
-
1.1. Certificate Types
- 1.1.1. SSL Certificates
- 1.1.2. Code Signing Certificates
- 1.1.3. Secure Email Certificates
- 1.1.4. Authentication Certificates
- 1.2. Services
-
1.1. Certificate Types
-
2. Organization Size
- 2.1. Large Enterprises
- 2.2. Small and Medium-Sized Enterprises
-
3. End-user Vertical
- 3.1. BFSI
- 3.2. Retail
- 3.3. Healthcare
- 3.4. IT and Telecom
- 3.5. Other End-user Verticals
Certificate Authority Market Segmentation By Geography
- 1. North America
- 2. Europe
- 3. Asia
- 4. Australia and New Zealand
- 5. Latin America
- 6. Middle East and Africa
Certificate Authority Market Regional Market Share
Geographic Coverage of Certificate Authority Market
Certificate Authority Market REPORT HIGHLIGHTS
| Aspects | Details |
|---|---|
| Study Period | 2020-2034 |
| Base Year | 2025 |
| Estimated Year | 2026 |
| Forecast Period | 2026-2034 |
| Historical Period | 2020-2025 |
| Growth Rate | CAGR of 11.18% from 2020-2034 |
| Segmentation |
|
Table of Contents
- 1. Introduction
- 1.1. Research Scope
- 1.2. Market Segmentation
- 1.3. Research Objective
- 1.4. Definitions and Assumptions
- 2. Executive Summary
- 2.1. Market Snapshot
- 3. Market Dynamics
- 3.1. Market Drivers
- 3.2. Market Restrains
- 3.3. Market Trends
- 3.4. Market Opportunities
- 4. Market Factor Analysis
- 4.1. Porters Five Forces
- 4.1.1. Bargaining Power of Suppliers
- 4.1.2. Bargaining Power of Buyers
- 4.1.3. Threat of New Entrants
- 4.1.4. Threat of Substitutes
- 4.1.5. Competitive Rivalry
- 4.2. PESTEL analysis
- 4.3. BCG Analysis
- 4.3.1. Stars (High Growth, High Market Share)
- 4.3.2. Cash Cows (Low Growth, High Market Share)
- 4.3.3. Question Mark (High Growth, Low Market Share)
- 4.3.4. Dogs (Low Growth, Low Market Share)
- 4.4. Ansoff Matrix Analysis
- 4.5. Supply Chain Analysis
- 4.6. Regulatory Landscape
- 4.7. Current Market Potential and Opportunity Assessment (TAM–SAM–SOM Framework)
- 4.8. PRI Analyst Note
- 4.1. Porters Five Forces
- 5. Market Analysis, Insights and Forecast 2021-2033
- 5.1. Market Analysis, Insights and Forecast - by Component
- 5.1.1. Certificate Types
- 5.1.1.1. SSL Certificates
- 5.1.1.2. Code Signing Certificates
- 5.1.1.3. Secure Email Certificates
- 5.1.1.4. Authentication Certificates
- 5.1.2. Services
- 5.1.1. Certificate Types
- 5.2. Market Analysis, Insights and Forecast - by Organization Size
- 5.2.1. Large Enterprises
- 5.2.2. Small and Medium-Sized Enterprises
- 5.3. Market Analysis, Insights and Forecast - by End-user Vertical
- 5.3.1. BFSI
- 5.3.2. Retail
- 5.3.3. Healthcare
- 5.3.4. IT and Telecom
- 5.3.5. Other End-user Verticals
- 5.4. Market Analysis, Insights and Forecast - by Region
- 5.4.1. North America
- 5.4.2. Europe
- 5.4.3. Asia
- 5.4.4. Australia and New Zealand
- 5.4.5. Latin America
- 5.4.6. Middle East and Africa
- 5.1. Market Analysis, Insights and Forecast - by Component
- 6. Global Certificate Authority Market Analysis, Insights and Forecast, 2021-2033
- 6.1. Market Analysis, Insights and Forecast - by Component
- 6.1.1. Certificate Types
- 6.1.1.1. SSL Certificates
- 6.1.1.2. Code Signing Certificates
- 6.1.1.3. Secure Email Certificates
- 6.1.1.4. Authentication Certificates
- 6.1.2. Services
- 6.1.1. Certificate Types
- 6.2. Market Analysis, Insights and Forecast - by Organization Size
- 6.2.1. Large Enterprises
- 6.2.2. Small and Medium-Sized Enterprises
- 6.3. Market Analysis, Insights and Forecast - by End-user Vertical
- 6.3.1. BFSI
- 6.3.2. Retail
- 6.3.3. Healthcare
- 6.3.4. IT and Telecom
- 6.3.5. Other End-user Verticals
- 6.1. Market Analysis, Insights and Forecast - by Component
- 7. North America Certificate Authority Market Analysis, Insights and Forecast, 2020-2032
- 7.1. Market Analysis, Insights and Forecast - by Component
- 7.1.1. Certificate Types
- 7.1.1.1. SSL Certificates
- 7.1.1.2. Code Signing Certificates
- 7.1.1.3. Secure Email Certificates
- 7.1.1.4. Authentication Certificates
- 7.1.2. Services
- 7.1.1. Certificate Types
- 7.2. Market Analysis, Insights and Forecast - by Organization Size
- 7.2.1. Large Enterprises
- 7.2.2. Small and Medium-Sized Enterprises
- 7.3. Market Analysis, Insights and Forecast - by End-user Vertical
- 7.3.1. BFSI
- 7.3.2. Retail
- 7.3.3. Healthcare
- 7.3.4. IT and Telecom
- 7.3.5. Other End-user Verticals
- 7.1. Market Analysis, Insights and Forecast - by Component
- 8. Europe Certificate Authority Market Analysis, Insights and Forecast, 2020-2032
- 8.1. Market Analysis, Insights and Forecast - by Component
- 8.1.1. Certificate Types
- 8.1.1.1. SSL Certificates
- 8.1.1.2. Code Signing Certificates
- 8.1.1.3. Secure Email Certificates
- 8.1.1.4. Authentication Certificates
- 8.1.2. Services
- 8.1.1. Certificate Types
- 8.2. Market Analysis, Insights and Forecast - by Organization Size
- 8.2.1. Large Enterprises
- 8.2.2. Small and Medium-Sized Enterprises
- 8.3. Market Analysis, Insights and Forecast - by End-user Vertical
- 8.3.1. BFSI
- 8.3.2. Retail
- 8.3.3. Healthcare
- 8.3.4. IT and Telecom
- 8.3.5. Other End-user Verticals
- 8.1. Market Analysis, Insights and Forecast - by Component
- 9. Asia Certificate Authority Market Analysis, Insights and Forecast, 2020-2032
- 9.1. Market Analysis, Insights and Forecast - by Component
- 9.1.1. Certificate Types
- 9.1.1.1. SSL Certificates
- 9.1.1.2. Code Signing Certificates
- 9.1.1.3. Secure Email Certificates
- 9.1.1.4. Authentication Certificates
- 9.1.2. Services
- 9.1.1. Certificate Types
- 9.2. Market Analysis, Insights and Forecast - by Organization Size
- 9.2.1. Large Enterprises
- 9.2.2. Small and Medium-Sized Enterprises
- 9.3. Market Analysis, Insights and Forecast - by End-user Vertical
- 9.3.1. BFSI
- 9.3.2. Retail
- 9.3.3. Healthcare
- 9.3.4. IT and Telecom
- 9.3.5. Other End-user Verticals
- 9.1. Market Analysis, Insights and Forecast - by Component
- 10. Australia and New Zealand Certificate Authority Market Analysis, Insights and Forecast, 2020-2032
- 10.1. Market Analysis, Insights and Forecast - by Component
- 10.1.1. Certificate Types
- 10.1.1.1. SSL Certificates
- 10.1.1.2. Code Signing Certificates
- 10.1.1.3. Secure Email Certificates
- 10.1.1.4. Authentication Certificates
- 10.1.2. Services
- 10.1.1. Certificate Types
- 10.2. Market Analysis, Insights and Forecast - by Organization Size
- 10.2.1. Large Enterprises
- 10.2.2. Small and Medium-Sized Enterprises
- 10.3. Market Analysis, Insights and Forecast - by End-user Vertical
- 10.3.1. BFSI
- 10.3.2. Retail
- 10.3.3. Healthcare
- 10.3.4. IT and Telecom
- 10.3.5. Other End-user Verticals
- 10.1. Market Analysis, Insights and Forecast - by Component
- 11. Latin America Certificate Authority Market Analysis, Insights and Forecast, 2020-2032
- 11.1. Market Analysis, Insights and Forecast - by Component
- 11.1.1. Certificate Types
- 11.1.1.1. SSL Certificates
- 11.1.1.2. Code Signing Certificates
- 11.1.1.3. Secure Email Certificates
- 11.1.1.4. Authentication Certificates
- 11.1.2. Services
- 11.1.1. Certificate Types
- 11.2. Market Analysis, Insights and Forecast - by Organization Size
- 11.2.1. Large Enterprises
- 11.2.2. Small and Medium-Sized Enterprises
- 11.3. Market Analysis, Insights and Forecast - by End-user Vertical
- 11.3.1. BFSI
- 11.3.2. Retail
- 11.3.3. Healthcare
- 11.3.4. IT and Telecom
- 11.3.5. Other End-user Verticals
- 11.1. Market Analysis, Insights and Forecast - by Component
- 12. Middle East and Africa Certificate Authority Market Analysis, Insights and Forecast, 2020-2032
- 12.1. Market Analysis, Insights and Forecast - by Component
- 12.1.1. Certificate Types
- 12.1.1.1. SSL Certificates
- 12.1.1.2. Code Signing Certificates
- 12.1.1.3. Secure Email Certificates
- 12.1.1.4. Authentication Certificates
- 12.1.2. Services
- 12.1.1. Certificate Types
- 12.2. Market Analysis, Insights and Forecast - by Organization Size
- 12.2.1. Large Enterprises
- 12.2.2. Small and Medium-Sized Enterprises
- 12.3. Market Analysis, Insights and Forecast - by End-user Vertical
- 12.3.1. BFSI
- 12.3.2. Retail
- 12.3.3. Healthcare
- 12.3.4. IT and Telecom
- 12.3.5. Other End-user Verticals
- 12.1. Market Analysis, Insights and Forecast - by Component
- 13. Competitive Analysis
- 13.1. Company Profiles
- 13.1.1 Sectigo Limited
- 13.1.1.1. Company Overview
- 13.1.1.2. Products
- 13.1.1.3. Company Financials
- 13.1.1.4. SWOT Analysis
- 13.1.2 Swisssign AG (Swiss Post)
- 13.1.2.1. Company Overview
- 13.1.2.2. Products
- 13.1.2.3. Company Financials
- 13.1.2.4. SWOT Analysis
- 13.1.3 Zerossl GMBH (HID
- 13.1.3.1. Company Overview
- 13.1.3.2. Products
- 13.1.3.3. Company Financials
- 13.1.3.4. SWOT Analysis
- 13.1.4 Network Solutions LLC
- 13.1.4.1. Company Overview
- 13.1.4.2. Products
- 13.1.4.3. Company Financials
- 13.1.4.4. SWOT Analysis
- 13.1.5 GoDaddy Inc
- 13.1.5.1. Company Overview
- 13.1.5.2. Products
- 13.1.5.3. Company Financials
- 13.1.5.4. SWOT Analysis
- 13.1.6 Trustwave Holdings Inc (Chertoff Group)
- 13.1.6.1. Company Overview
- 13.1.6.2. Products
- 13.1.6.3. Company Financials
- 13.1.6.4. SWOT Analysis
- 13.1.7 GlobalSign
- 13.1.7.1. Company Overview
- 13.1.7.2. Products
- 13.1.7.3. Company Financials
- 13.1.7.4. SWOT Analysis
- 13.1.8 Actalis S p A
- 13.1.8.1. Company Overview
- 13.1.8.2. Products
- 13.1.8.3. Company Financials
- 13.1.8.4. SWOT Analysis
- 13.1.9 Camerfirma SA
- 13.1.9.1. Company Overview
- 13.1.9.2. Products
- 13.1.9.3. Company Financials
- 13.1.9.4. SWOT Analysis
- 13.1.10 WISeKey International Holdings Ltd
- 13.1.10.1. Company Overview
- 13.1.10.2. Products
- 13.1.10.3. Company Financials
- 13.1.10.4. SWOT Analysis
- 13.1.11 DigiCert Inc
- 13.1.11.1. Company Overview
- 13.1.11.2. Products
- 13.1.11.3. Company Financials
- 13.1.11.4. SWOT Analysis
- 13.1.12 OneSpan Inc
- 13.1.12.1. Company Overview
- 13.1.12.2. Products
- 13.1.12.3. Company Financials
- 13.1.12.4. SWOT Analysis
- 13.1.13 Asseco Data Systems SA (Asseco Poland SA)
- 13.1.13.1. Company Overview
- 13.1.13.2. Products
- 13.1.13.3. Company Financials
- 13.1.13.4. SWOT Analysis
- 13.1.14 Buypass AS
- 13.1.14.1. Company Overview
- 13.1.14.2. Products
- 13.1.14.3. Company Financials
- 13.1.14.4. SWOT Analysis
- 13.1.15 Entrust Corporation
- 13.1.15.1. Company Overview
- 13.1.15.2. Products
- 13.1.15.3. Company Financials
- 13.1.15.4. SWOT Analysis
- 13.1.16 SSL Com
- 13.1.16.1. Company Overview
- 13.1.16.2. Products
- 13.1.16.3. Company Financials
- 13.1.16.4. SWOT Analysis
- 13.1.1 Sectigo Limited
- 13.2. Market Entropy
- 13.2.1 Company's Key Areas Served
- 13.2.2 Recent Developments
- 13.3. Company Market Share Analysis 2025
- 13.3.1 Top 5 Companies Market Share Analysis
- 13.3.2 Top 3 Companies Market Share Analysis
- 13.4. List of Potential Customers
- 14. Research Methodology
List of Figures
- Figure 1: Global Certificate Authority Market Revenue Breakdown (Million, %) by Region 2025 & 2033
- Figure 2: Global Certificate Authority Market Volume Breakdown (K Unit, %) by Region 2025 & 2033
- Figure 3: North America Certificate Authority Market Revenue (Million), by Component 2025 & 2033
- Figure 4: North America Certificate Authority Market Volume (K Unit), by Component 2025 & 2033
- Figure 5: North America Certificate Authority Market Revenue Share (%), by Component 2025 & 2033
- Figure 6: North America Certificate Authority Market Volume Share (%), by Component 2025 & 2033
- Figure 7: North America Certificate Authority Market Revenue (Million), by Organization Size 2025 & 2033
- Figure 8: North America Certificate Authority Market Volume (K Unit), by Organization Size 2025 & 2033
- Figure 9: North America Certificate Authority Market Revenue Share (%), by Organization Size 2025 & 2033
- Figure 10: North America Certificate Authority Market Volume Share (%), by Organization Size 2025 & 2033
- Figure 11: North America Certificate Authority Market Revenue (Million), by End-user Vertical 2025 & 2033
- Figure 12: North America Certificate Authority Market Volume (K Unit), by End-user Vertical 2025 & 2033
- Figure 13: North America Certificate Authority Market Revenue Share (%), by End-user Vertical 2025 & 2033
- Figure 14: North America Certificate Authority Market Volume Share (%), by End-user Vertical 2025 & 2033
- Figure 15: North America Certificate Authority Market Revenue (Million), by Country 2025 & 2033
- Figure 16: North America Certificate Authority Market Volume (K Unit), by Country 2025 & 2033
- Figure 17: North America Certificate Authority Market Revenue Share (%), by Country 2025 & 2033
- Figure 18: North America Certificate Authority Market Volume Share (%), by Country 2025 & 2033
- Figure 19: Europe Certificate Authority Market Revenue (Million), by Component 2025 & 2033
- Figure 20: Europe Certificate Authority Market Volume (K Unit), by Component 2025 & 2033
- Figure 21: Europe Certificate Authority Market Revenue Share (%), by Component 2025 & 2033
- Figure 22: Europe Certificate Authority Market Volume Share (%), by Component 2025 & 2033
- Figure 23: Europe Certificate Authority Market Revenue (Million), by Organization Size 2025 & 2033
- Figure 24: Europe Certificate Authority Market Volume (K Unit), by Organization Size 2025 & 2033
- Figure 25: Europe Certificate Authority Market Revenue Share (%), by Organization Size 2025 & 2033
- Figure 26: Europe Certificate Authority Market Volume Share (%), by Organization Size 2025 & 2033
- Figure 27: Europe Certificate Authority Market Revenue (Million), by End-user Vertical 2025 & 2033
- Figure 28: Europe Certificate Authority Market Volume (K Unit), by End-user Vertical 2025 & 2033
- Figure 29: Europe Certificate Authority Market Revenue Share (%), by End-user Vertical 2025 & 2033
- Figure 30: Europe Certificate Authority Market Volume Share (%), by End-user Vertical 2025 & 2033
- Figure 31: Europe Certificate Authority Market Revenue (Million), by Country 2025 & 2033
- Figure 32: Europe Certificate Authority Market Volume (K Unit), by Country 2025 & 2033
- Figure 33: Europe Certificate Authority Market Revenue Share (%), by Country 2025 & 2033
- Figure 34: Europe Certificate Authority Market Volume Share (%), by Country 2025 & 2033
- Figure 35: Asia Certificate Authority Market Revenue (Million), by Component 2025 & 2033
- Figure 36: Asia Certificate Authority Market Volume (K Unit), by Component 2025 & 2033
- Figure 37: Asia Certificate Authority Market Revenue Share (%), by Component 2025 & 2033
- Figure 38: Asia Certificate Authority Market Volume Share (%), by Component 2025 & 2033
- Figure 39: Asia Certificate Authority Market Revenue (Million), by Organization Size 2025 & 2033
- Figure 40: Asia Certificate Authority Market Volume (K Unit), by Organization Size 2025 & 2033
- Figure 41: Asia Certificate Authority Market Revenue Share (%), by Organization Size 2025 & 2033
- Figure 42: Asia Certificate Authority Market Volume Share (%), by Organization Size 2025 & 2033
- Figure 43: Asia Certificate Authority Market Revenue (Million), by End-user Vertical 2025 & 2033
- Figure 44: Asia Certificate Authority Market Volume (K Unit), by End-user Vertical 2025 & 2033
- Figure 45: Asia Certificate Authority Market Revenue Share (%), by End-user Vertical 2025 & 2033
- Figure 46: Asia Certificate Authority Market Volume Share (%), by End-user Vertical 2025 & 2033
- Figure 47: Asia Certificate Authority Market Revenue (Million), by Country 2025 & 2033
- Figure 48: Asia Certificate Authority Market Volume (K Unit), by Country 2025 & 2033
- Figure 49: Asia Certificate Authority Market Revenue Share (%), by Country 2025 & 2033
- Figure 50: Asia Certificate Authority Market Volume Share (%), by Country 2025 & 2033
- Figure 51: Australia and New Zealand Certificate Authority Market Revenue (Million), by Component 2025 & 2033
- Figure 52: Australia and New Zealand Certificate Authority Market Volume (K Unit), by Component 2025 & 2033
- Figure 53: Australia and New Zealand Certificate Authority Market Revenue Share (%), by Component 2025 & 2033
- Figure 54: Australia and New Zealand Certificate Authority Market Volume Share (%), by Component 2025 & 2033
- Figure 55: Australia and New Zealand Certificate Authority Market Revenue (Million), by Organization Size 2025 & 2033
- Figure 56: Australia and New Zealand Certificate Authority Market Volume (K Unit), by Organization Size 2025 & 2033
- Figure 57: Australia and New Zealand Certificate Authority Market Revenue Share (%), by Organization Size 2025 & 2033
- Figure 58: Australia and New Zealand Certificate Authority Market Volume Share (%), by Organization Size 2025 & 2033
- Figure 59: Australia and New Zealand Certificate Authority Market Revenue (Million), by End-user Vertical 2025 & 2033
- Figure 60: Australia and New Zealand Certificate Authority Market Volume (K Unit), by End-user Vertical 2025 & 2033
- Figure 61: Australia and New Zealand Certificate Authority Market Revenue Share (%), by End-user Vertical 2025 & 2033
- Figure 62: Australia and New Zealand Certificate Authority Market Volume Share (%), by End-user Vertical 2025 & 2033
- Figure 63: Australia and New Zealand Certificate Authority Market Revenue (Million), by Country 2025 & 2033
- Figure 64: Australia and New Zealand Certificate Authority Market Volume (K Unit), by Country 2025 & 2033
- Figure 65: Australia and New Zealand Certificate Authority Market Revenue Share (%), by Country 2025 & 2033
- Figure 66: Australia and New Zealand Certificate Authority Market Volume Share (%), by Country 2025 & 2033
- Figure 67: Latin America Certificate Authority Market Revenue (Million), by Component 2025 & 2033
- Figure 68: Latin America Certificate Authority Market Volume (K Unit), by Component 2025 & 2033
- Figure 69: Latin America Certificate Authority Market Revenue Share (%), by Component 2025 & 2033
- Figure 70: Latin America Certificate Authority Market Volume Share (%), by Component 2025 & 2033
- Figure 71: Latin America Certificate Authority Market Revenue (Million), by Organization Size 2025 & 2033
- Figure 72: Latin America Certificate Authority Market Volume (K Unit), by Organization Size 2025 & 2033
- Figure 73: Latin America Certificate Authority Market Revenue Share (%), by Organization Size 2025 & 2033
- Figure 74: Latin America Certificate Authority Market Volume Share (%), by Organization Size 2025 & 2033
- Figure 75: Latin America Certificate Authority Market Revenue (Million), by End-user Vertical 2025 & 2033
- Figure 76: Latin America Certificate Authority Market Volume (K Unit), by End-user Vertical 2025 & 2033
- Figure 77: Latin America Certificate Authority Market Revenue Share (%), by End-user Vertical 2025 & 2033
- Figure 78: Latin America Certificate Authority Market Volume Share (%), by End-user Vertical 2025 & 2033
- Figure 79: Latin America Certificate Authority Market Revenue (Million), by Country 2025 & 2033
- Figure 80: Latin America Certificate Authority Market Volume (K Unit), by Country 2025 & 2033
- Figure 81: Latin America Certificate Authority Market Revenue Share (%), by Country 2025 & 2033
- Figure 82: Latin America Certificate Authority Market Volume Share (%), by Country 2025 & 2033
- Figure 83: Middle East and Africa Certificate Authority Market Revenue (Million), by Component 2025 & 2033
- Figure 84: Middle East and Africa Certificate Authority Market Volume (K Unit), by Component 2025 & 2033
- Figure 85: Middle East and Africa Certificate Authority Market Revenue Share (%), by Component 2025 & 2033
- Figure 86: Middle East and Africa Certificate Authority Market Volume Share (%), by Component 2025 & 2033
- Figure 87: Middle East and Africa Certificate Authority Market Revenue (Million), by Organization Size 2025 & 2033
- Figure 88: Middle East and Africa Certificate Authority Market Volume (K Unit), by Organization Size 2025 & 2033
- Figure 89: Middle East and Africa Certificate Authority Market Revenue Share (%), by Organization Size 2025 & 2033
- Figure 90: Middle East and Africa Certificate Authority Market Volume Share (%), by Organization Size 2025 & 2033
- Figure 91: Middle East and Africa Certificate Authority Market Revenue (Million), by End-user Vertical 2025 & 2033
- Figure 92: Middle East and Africa Certificate Authority Market Volume (K Unit), by End-user Vertical 2025 & 2033
- Figure 93: Middle East and Africa Certificate Authority Market Revenue Share (%), by End-user Vertical 2025 & 2033
- Figure 94: Middle East and Africa Certificate Authority Market Volume Share (%), by End-user Vertical 2025 & 2033
- Figure 95: Middle East and Africa Certificate Authority Market Revenue (Million), by Country 2025 & 2033
- Figure 96: Middle East and Africa Certificate Authority Market Volume (K Unit), by Country 2025 & 2033
- Figure 97: Middle East and Africa Certificate Authority Market Revenue Share (%), by Country 2025 & 2033
- Figure 98: Middle East and Africa Certificate Authority Market Volume Share (%), by Country 2025 & 2033
List of Tables
- Table 1: Global Certificate Authority Market Revenue Million Forecast, by Component 2020 & 2033
- Table 2: Global Certificate Authority Market Volume K Unit Forecast, by Component 2020 & 2033
- Table 3: Global Certificate Authority Market Revenue Million Forecast, by Organization Size 2020 & 2033
- Table 4: Global Certificate Authority Market Volume K Unit Forecast, by Organization Size 2020 & 2033
- Table 5: Global Certificate Authority Market Revenue Million Forecast, by End-user Vertical 2020 & 2033
- Table 6: Global Certificate Authority Market Volume K Unit Forecast, by End-user Vertical 2020 & 2033
- Table 7: Global Certificate Authority Market Revenue Million Forecast, by Region 2020 & 2033
- Table 8: Global Certificate Authority Market Volume K Unit Forecast, by Region 2020 & 2033
- Table 9: Global Certificate Authority Market Revenue Million Forecast, by Component 2020 & 2033
- Table 10: Global Certificate Authority Market Volume K Unit Forecast, by Component 2020 & 2033
- Table 11: Global Certificate Authority Market Revenue Million Forecast, by Organization Size 2020 & 2033
- Table 12: Global Certificate Authority Market Volume K Unit Forecast, by Organization Size 2020 & 2033
- Table 13: Global Certificate Authority Market Revenue Million Forecast, by End-user Vertical 2020 & 2033
- Table 14: Global Certificate Authority Market Volume K Unit Forecast, by End-user Vertical 2020 & 2033
- Table 15: Global Certificate Authority Market Revenue Million Forecast, by Country 2020 & 2033
- Table 16: Global Certificate Authority Market Volume K Unit Forecast, by Country 2020 & 2033
- Table 17: Global Certificate Authority Market Revenue Million Forecast, by Component 2020 & 2033
- Table 18: Global Certificate Authority Market Volume K Unit Forecast, by Component 2020 & 2033
- Table 19: Global Certificate Authority Market Revenue Million Forecast, by Organization Size 2020 & 2033
- Table 20: Global Certificate Authority Market Volume K Unit Forecast, by Organization Size 2020 & 2033
- Table 21: Global Certificate Authority Market Revenue Million Forecast, by End-user Vertical 2020 & 2033
- Table 22: Global Certificate Authority Market Volume K Unit Forecast, by End-user Vertical 2020 & 2033
- Table 23: Global Certificate Authority Market Revenue Million Forecast, by Country 2020 & 2033
- Table 24: Global Certificate Authority Market Volume K Unit Forecast, by Country 2020 & 2033
- Table 25: Global Certificate Authority Market Revenue Million Forecast, by Component 2020 & 2033
- Table 26: Global Certificate Authority Market Volume K Unit Forecast, by Component 2020 & 2033
- Table 27: Global Certificate Authority Market Revenue Million Forecast, by Organization Size 2020 & 2033
- Table 28: Global Certificate Authority Market Volume K Unit Forecast, by Organization Size 2020 & 2033
- Table 29: Global Certificate Authority Market Revenue Million Forecast, by End-user Vertical 2020 & 2033
- Table 30: Global Certificate Authority Market Volume K Unit Forecast, by End-user Vertical 2020 & 2033
- Table 31: Global Certificate Authority Market Revenue Million Forecast, by Country 2020 & 2033
- Table 32: Global Certificate Authority Market Volume K Unit Forecast, by Country 2020 & 2033
- Table 33: Global Certificate Authority Market Revenue Million Forecast, by Component 2020 & 2033
- Table 34: Global Certificate Authority Market Volume K Unit Forecast, by Component 2020 & 2033
- Table 35: Global Certificate Authority Market Revenue Million Forecast, by Organization Size 2020 & 2033
- Table 36: Global Certificate Authority Market Volume K Unit Forecast, by Organization Size 2020 & 2033
- Table 37: Global Certificate Authority Market Revenue Million Forecast, by End-user Vertical 2020 & 2033
- Table 38: Global Certificate Authority Market Volume K Unit Forecast, by End-user Vertical 2020 & 2033
- Table 39: Global Certificate Authority Market Revenue Million Forecast, by Country 2020 & 2033
- Table 40: Global Certificate Authority Market Volume K Unit Forecast, by Country 2020 & 2033
- Table 41: Global Certificate Authority Market Revenue Million Forecast, by Component 2020 & 2033
- Table 42: Global Certificate Authority Market Volume K Unit Forecast, by Component 2020 & 2033
- Table 43: Global Certificate Authority Market Revenue Million Forecast, by Organization Size 2020 & 2033
- Table 44: Global Certificate Authority Market Volume K Unit Forecast, by Organization Size 2020 & 2033
- Table 45: Global Certificate Authority Market Revenue Million Forecast, by End-user Vertical 2020 & 2033
- Table 46: Global Certificate Authority Market Volume K Unit Forecast, by End-user Vertical 2020 & 2033
- Table 47: Global Certificate Authority Market Revenue Million Forecast, by Country 2020 & 2033
- Table 48: Global Certificate Authority Market Volume K Unit Forecast, by Country 2020 & 2033
- Table 49: Global Certificate Authority Market Revenue Million Forecast, by Component 2020 & 2033
- Table 50: Global Certificate Authority Market Volume K Unit Forecast, by Component 2020 & 2033
- Table 51: Global Certificate Authority Market Revenue Million Forecast, by Organization Size 2020 & 2033
- Table 52: Global Certificate Authority Market Volume K Unit Forecast, by Organization Size 2020 & 2033
- Table 53: Global Certificate Authority Market Revenue Million Forecast, by End-user Vertical 2020 & 2033
- Table 54: Global Certificate Authority Market Volume K Unit Forecast, by End-user Vertical 2020 & 2033
- Table 55: Global Certificate Authority Market Revenue Million Forecast, by Country 2020 & 2033
- Table 56: Global Certificate Authority Market Volume K Unit Forecast, by Country 2020 & 2033
Frequently Asked Questions
1. What is the projected Compound Annual Growth Rate (CAGR) of the Certificate Authority Market?
The projected CAGR is approximately 11.18%.
2. Which companies are prominent players in the Certificate Authority Market?
Key companies in the market include Sectigo Limited, Swisssign AG (Swiss Post), Zerossl GMBH (HID, Network Solutions LLC, GoDaddy Inc, Trustwave Holdings Inc (Chertoff Group), GlobalSign, Actalis S p A, Camerfirma SA, WISeKey International Holdings Ltd, DigiCert Inc, OneSpan Inc, Asseco Data Systems SA (Asseco Poland SA), Buypass AS, Entrust Corporation, SSL Com.
3. What are the main segments of the Certificate Authority Market?
The market segments include Component, Organization Size, End-user Vertical.
4. Can you provide details about the market size?
The market size is estimated to be USD 187.70 Million as of 2022.
5. What are some drivers contributing to market growth?
Growing Awareness Among Internet Users About Secure Web Access; Managing Strict Regulations and Compliance.
6. What are the notable trends driving market growth?
BFSI Sector to be the Largest End-user Industry.
7. Are there any restraints impacting market growth?
Lack of Awareness About the Importance of Security Certificates; Using of Self-Signed Certificates.
8. Can you provide examples of recent developments in the market?
February 2024 - The availability of an issuer for the Kubernetes cert-manager was confirmed by GlobalSign, Inc., a global Certificate Authority providing identity security, digital signature, and Internet of Things solutions. Made from an integration from GMO GlobalSign's certificate management platform, Atlas, the new Issuer enables cert-manager users to quickly obtain trusted TLS (X.509) certificates, improving the security of Kubernetes workflows. With over 5 million daily downloads, the open-source enterprise tool simplifies the certificate issuance and management process in Kubernetes.
9. What pricing options are available for accessing the report?
Pricing options include single-user, multi-user, and enterprise licenses priced at USD 4750, USD 5250, and USD 8750 respectively.
10. Is the market size provided in terms of value or volume?
The market size is provided in terms of value, measured in Million and volume, measured in K Unit.
11. Are there any specific market keywords associated with the report?
Yes, the market keyword associated with the report is "Certificate Authority Market," which aids in identifying and referencing the specific market segment covered.
12. How do I determine which pricing option suits my needs best?
The pricing options vary based on user requirements and access needs. Individual users may opt for single-user licenses, while businesses requiring broader access may choose multi-user or enterprise licenses for cost-effective access to the report.
13. Are there any additional resources or data provided in the Certificate Authority Market report?
While the report offers comprehensive insights, it's advisable to review the specific contents or supplementary materials provided to ascertain if additional resources or data are available.
14. How can I stay updated on further developments or reports in the Certificate Authority Market?
To stay informed about further developments, trends, and reports in the Certificate Authority Market, consider subscribing to industry newsletters, following relevant companies and organizations, or regularly checking reputable industry news sources and publications.
Methodology
Step 1 - Identification of Relevant Samples Size from Population Database


Step 2 - Approaches for Defining Global Market Size (Value, Volume* & Price*)

Note*: In applicable scenarios
Step 3 - Data Sources
Primary Research
- Web Analytics
- Survey Reports
- Research Institute
- Latest Research Reports
- Opinion Leaders
Secondary Research
- Annual Reports
- White Paper
- Latest Press Release
- Industry Association
- Paid Database
- Investor Presentations

Step 4 - Data Triangulation
Involves using different sources of information in order to increase the validity of a study
These sources are likely to be stakeholders in a program - participants, other researchers, program staff, other community members, and so on.
Then we put all data in single framework & apply various statistical tools to find out the dynamic on the market.
During the analysis stage, feedback from the stakeholder groups would be compared to determine areas of agreement as well as areas of divergence