

Key Insights
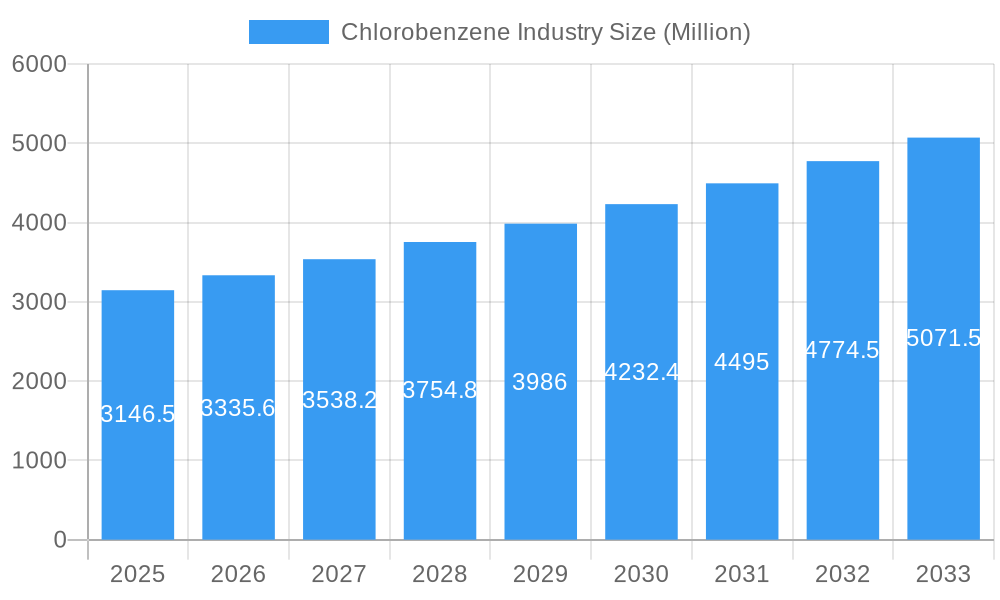
The chlorobenzene market, valued at $2,357 million in 2025 (base year), is projected for substantial growth. With a projected Compound Annual Growth Rate (CAGR) of 3.5% from 2025 to 2033, the market anticipates significant expansion. Key drivers include robust demand from applications such as moth control, nitrobenzene production for various industrial uses, and the manufacturing of advanced polymers like polyphenylene sulfide and polysulfone. Growing pharmaceutical and textile sectors, alongside increasing consumer demand for hygiene products like deodorants, are also fueling market expansion. While regulatory challenges and substitute chemicals present potential constraints, the market outlook is positive, particularly in the rapidly industrializing Asia-Pacific region. The competitive landscape comprises established global and regional players, fostering both consolidation and innovation.
Chlorobenzene Industry Market Size (In Billion)
Geographically, North America and Europe currently lead in market share, supported by mature manufacturing and consumption. However, the Asia-Pacific region is expected to exhibit the fastest growth, driven by expanding chemical manufacturing and strong demand from emerging economies like China and India. South America and the Middle East & Africa are forecast to experience moderate expansion due to increasing industrialization. Market segmentation by chlorobenzene types (monochlorobenzene, dichlorobenzene isomers) caters to specific industry needs, influencing distinct market dynamics and growth trajectories. Ongoing innovation in polymer chemistry and the exploration of novel applications will continue to shape the chlorobenzene market.
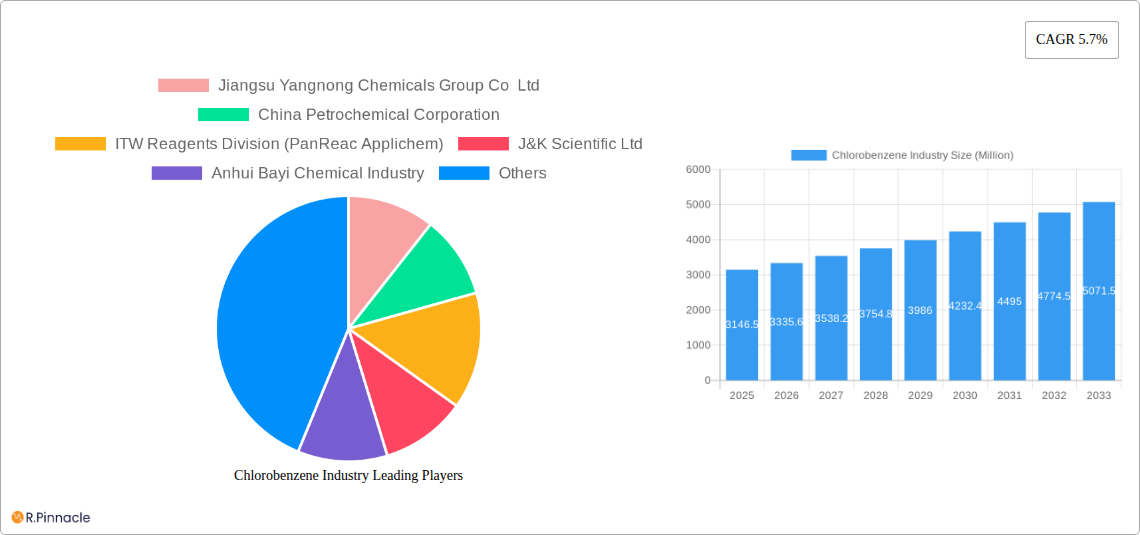
Chlorobenzene Industry Company Market Share
Chlorobenzene Industry Market Report: 2019-2033
This comprehensive report provides an in-depth analysis of the global chlorobenzene industry, offering crucial insights for industry professionals, investors, and strategic decision-makers. Covering the period from 2019 to 2033, with a base year of 2025 and a forecast period of 2025-2033, this report leverages extensive market research to deliver actionable intelligence. The report features detailed segmentation by type (Monochlorobenzene, o-dichlorobenzene, p-dichlorobenzene, m-Dichlorobenzene, Other Types), application (Moth Control, Nitrochlorobenzenes, Polyphenylene Sulfide, Polysulfone Polymers, Solvents, Room and Sanitary Deodorants, Other Applications), and industry vertical (Agriculture, Textile, Pharmaceutical, Chemical, Paint & Coating, Cosmetic & Personal Care, Others). Key players such as Jiangsu Yangnong Chemicals Group Co Ltd, China Petrochemical Corporation, ITW Reagents Division (PanReac Applichem), J&K Scientific Ltd, Anhui Bayi Chemical Industry, Chemada Fine Chemicals, Kureha Corporation, Tianjin Bohai Chemical Industry Co Ltd, Meryer (Shanghai) Chemical Technology Co Ltd, and Lanxess are profiled, providing a competitive landscape analysis.
Chlorobenzene Industry Market Structure & Innovation Trends
The chlorobenzene market exhibits a moderately concentrated structure, with the top 10 players holding an estimated xx% market share in 2025. Innovation is driven by the need for more environmentally friendly alternatives and the development of higher-performance materials in target applications. Stringent environmental regulations are shaping industry practices, leading to increased investment in cleaner production technologies. Product substitutes, such as alternative solvents and bio-based materials, present a challenge, although their market penetration remains relatively low (xx% in 2025). The end-user demographics are diverse, spanning various industries, with significant growth expected in the pharmaceutical and advanced materials sectors. M&A activities have been moderate in recent years, with total deal values estimated at xx Million in 2024. Notable examples include [Insert specific examples of M&A activities, if available; otherwise, state "No major M&A activity reported"].
- Market Concentration: xx% held by top 10 players (2025)
- Innovation Drivers: Environmental regulations, performance enhancements
- Regulatory Framework: Stringent emission standards, safety regulations
- Product Substitutes: Alternative solvents, bio-based materials (xx% market penetration in 2025)
- M&A Activity (2024): xx Million
Chlorobenzene Industry Market Dynamics & Trends
The global chlorobenzene market is projected to experience a CAGR of xx% during the forecast period (2025-2033). This growth is primarily driven by increasing demand from the pharmaceutical and advanced materials industries, fueled by technological advancements in these sectors. The rising adoption of chlorobenzene derivatives in high-performance polymers like polysulfone and polyphenylene sulfide further contributes to market expansion. Consumer preferences towards sustainable and eco-friendly products are influencing the demand for greener chlorobenzene production methods. Competitive dynamics are characterized by intense competition among major players, focusing on pricing strategies, product innovation, and market expansion. Market penetration in emerging economies is also expected to increase significantly, driven by growing industrialization and infrastructure development. Technological disruptions, particularly in production processes, are expected to enhance efficiency and reduce environmental impact.
Dominant Regions & Segments in Chlorobenzene Industry
The Asia-Pacific region holds the dominant position in the global chlorobenzene market, accounting for approximately xx% of the total market share in 2025. This dominance is largely attributed to rapid industrialization, especially in countries like China and India.
- Leading Region: Asia-Pacific (xx% market share in 2025)
- Key Drivers (Asia-Pacific): Rapid industrialization, robust infrastructure development, favorable government policies.
Dominant Segments:
- Type: Monochlorobenzene holds the largest segment share due to its wide applications across various industries.
- Application: Solvents segment is projected to maintain its leading position owing to its extensive usage in various industrial processes.
- Industry Vertical: The chemical industry is the largest consumer of chlorobenzene, with significant contributions from the pharmaceutical and paint & coating industries.
The detailed analysis within the report includes thorough breakdowns of each segment and their contributing factors.
Chlorobenzene Industry Product Innovations
Recent innovations in the chlorobenzene industry have focused on developing more efficient and environmentally friendly production processes, reducing waste and emissions. New applications are being explored in advanced materials and specialized chemicals, driven by the need for high-performance materials with specific properties. Companies are also focusing on developing innovative formulations to enhance product performance and cater to specific market needs. These innovations are contributing to the growth and competitiveness of the chlorobenzene market.
Report Scope & Segmentation Analysis
This report provides a comprehensive analysis of the chlorobenzene market segmented by Type (Monochlorobenzene, o-dichlorobenzene, p-dichlorobenzene, m-Dichlorobenzene, Other Types), Application (Moth Control, Nitrochlorobenzenes, Polyphenylene Sulfide, Polysulfone Polymers, Solvents, Room and Sanitary Deodorants, Other Applications), and Industry Vertical (Agriculture, Textile, Pharmaceutical, Chemical, Paint & Coating, Cosmetic & Personal Care, Others). Each segment's growth projection, market size, and competitive dynamics are meticulously analyzed. The report offers a detailed understanding of the market's current structure and future trends.
Key Drivers of Chlorobenzene Industry Growth
The growth of the chlorobenzene industry is primarily driven by the rising demand from the chemical industry, particularly for the production of various intermediates and specialty chemicals. Technological advancements in production processes lead to enhanced efficiency and reduced costs. Favorable government policies and investments in infrastructure in several emerging economies are boosting the market's expansion. The increasing use of chlorobenzene in advanced materials and high-performance polymers also contributes to the overall growth.
Challenges in the Chlorobenzene Industry Sector
The chlorobenzene industry faces challenges related to stringent environmental regulations, which increase production costs and necessitate investments in cleaner technologies. Fluctuations in raw material prices and supply chain disruptions can impact profitability. Intense competition among established players also puts pressure on profit margins. These factors necessitate strategic planning and adaptation to maintain market competitiveness. The estimated cost of compliance with new regulations is projected at xx Million annually by 2030.
Emerging Opportunities in Chlorobenzene Industry
Emerging opportunities exist in the development of new applications for chlorobenzene in high-growth sectors like renewable energy and advanced electronics. The exploration of novel production methods using sustainable and renewable resources offers significant potential for growth. Expanding into emerging markets with developing infrastructure and industrialization creates further opportunities for market expansion.
Leading Players in the Chlorobenzene Industry Market
- Jiangsu Yangnong Chemicals Group Co Ltd
- China Petrochemical Corporation
- ITW Reagents Division (PanReac Applichem)
- J&K Scientific Ltd
- Anhui Bayi Chemical Industry
- Chemada Fine Chemicals
- Kureha Corporation
- Tianjin Bohai Chemical Industry Co Ltd
- Meryer (Shanghai) Chemical Technology Co Ltd
- Lanxess
Key Developments in Chlorobenzene Industry
- 2022 Q3: Lanxess announced a new production facility for specialized chlorobenzene derivatives.
- 2021 Q4: Jiangsu Yangnong Chemicals Group Co Ltd invested xx Million in upgrading its chlorobenzene production line.
- [Add further key developments with year/month and impact on market dynamics]
Future Outlook for Chlorobenzene Industry Market
The future of the chlorobenzene industry looks promising, with continued growth driven by increasing demand from key applications and the development of innovative technologies. Strategic investments in research and development, along with sustainable manufacturing practices, will be crucial for maintaining competitiveness and meeting evolving market demands. The potential for expansion into emerging markets and new applications offers significant growth opportunities for industry players.
Chlorobenzene Industry Segmentation
-
1. Type
- 1.1. Monochlorobenzene
- 1.2. o-dichlorobenzene
- 1.3. p-dichlorobenzene
- 1.4. m-Dichlorobenzene
- 1.5. Other Types
-
2. Application
- 2.1. Moth Control
- 2.2. Nitrochlorobenzenes
- 2.3. Polyphenylene Sulfide
- 2.4. Polysulfone Polymers
- 2.5. Solvents
- 2.6. Room and Sanitary Deodorants
- 2.7. Other Applications
Chlorobenzene Industry Segmentation By Geography
-
1. Asia Pacific
- 1.1. China
- 1.2. India
- 1.3. Japan
- 1.4. South Korea
- 1.5. Malaysia
- 1.6. Thailand
- 1.7. Indonesia
- 1.8. Vietnam
- 1.9. Rest of Asia Pacific
-
2. North America
- 2.1. United States
- 2.2. Canada
- 2.3. Mexico
-
3. Europe
- 3.1. Germany
- 3.2. United Kingdom
- 3.3. France
- 3.4. Italy
- 3.5. Spain
- 3.6. Nordic
- 3.7. Turkey
- 3.8. Russia
- 3.9. Rest of Europe
-
4. South America
- 4.1. Brazil
- 4.2. Argentina
- 4.3. Colombia
- 4.4. Rest of South America
- 5. Middle East
-
6. Saudi Arabia
- 6.1. South Africa
- 6.2. Nigeria
- 6.3. Qatar
- 6.4. Egypt
- 6.5. United Arab Emirates
- 6.6. Rest of Middle East
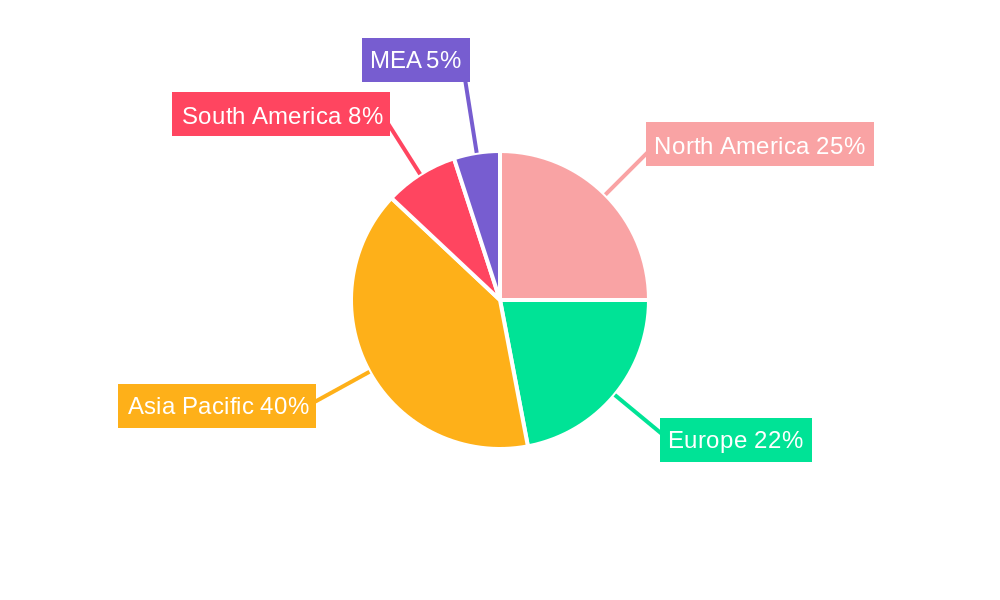
Chlorobenzene Industry Regional Market Share
Geographic Coverage of Chlorobenzene Industry
Chlorobenzene Industry REPORT HIGHLIGHTS
| Aspects | Details |
|---|---|
| Study Period | 2020-2034 |
| Base Year | 2025 |
| Estimated Year | 2026 |
| Forecast Period | 2026-2034 |
| Historical Period | 2020-2025 |
| Growth Rate | CAGR of 3.5% from 2020-2034 |
| Segmentation |
|
Table of Contents
- 1. Introduction
- 1.1. Research Scope
- 1.2. Market Segmentation
- 1.3. Research Objective
- 1.4. Definitions and Assumptions
- 2. Executive Summary
- 2.1. Market Snapshot
- 3. Market Dynamics
- 3.1. Market Drivers
- 3.2. Market Restrains
- 3.3. Market Trends
- 3.4. Market Opportunities
- 4. Market Factor Analysis
- 4.1. Porters Five Forces
- 4.1.1. Bargaining Power of Suppliers
- 4.1.2. Bargaining Power of Buyers
- 4.1.3. Threat of New Entrants
- 4.1.4. Threat of Substitutes
- 4.1.5. Competitive Rivalry
- 4.2. PESTEL analysis
- 4.3. BCG Analysis
- 4.3.1. Stars (High Growth, High Market Share)
- 4.3.2. Cash Cows (Low Growth, High Market Share)
- 4.3.3. Question Mark (High Growth, Low Market Share)
- 4.3.4. Dogs (Low Growth, Low Market Share)
- 4.4. Ansoff Matrix Analysis
- 4.5. Supply Chain Analysis
- 4.6. Regulatory Landscape
- 4.7. Current Market Potential and Opportunity Assessment (TAM–SAM–SOM Framework)
- 4.8. PRI Analyst Note
- 4.1. Porters Five Forces
- 5. Market Analysis, Insights and Forecast 2021-2033
- 5.1. Market Analysis, Insights and Forecast - by Type
- 5.1.1. Monochlorobenzene
- 5.1.2. o-dichlorobenzene
- 5.1.3. p-dichlorobenzene
- 5.1.4. m-Dichlorobenzene
- 5.1.5. Other Types
- 5.2. Market Analysis, Insights and Forecast - by Application
- 5.2.1. Moth Control
- 5.2.2. Nitrochlorobenzenes
- 5.2.3. Polyphenylene Sulfide
- 5.2.4. Polysulfone Polymers
- 5.2.5. Solvents
- 5.2.6. Room and Sanitary Deodorants
- 5.2.7. Other Applications
- 5.3. Market Analysis, Insights and Forecast - by Region
- 5.3.1. Asia Pacific
- 5.3.2. North America
- 5.3.3. Europe
- 5.3.4. South America
- 5.3.5. Middle East
- 5.3.6. Saudi Arabia
- 5.1. Market Analysis, Insights and Forecast - by Type
- 6. Global Chlorobenzene Industry Analysis, Insights and Forecast, 2021-2033
- 6.1. Market Analysis, Insights and Forecast - by Type
- 6.1.1. Monochlorobenzene
- 6.1.2. o-dichlorobenzene
- 6.1.3. p-dichlorobenzene
- 6.1.4. m-Dichlorobenzene
- 6.1.5. Other Types
- 6.2. Market Analysis, Insights and Forecast - by Application
- 6.2.1. Moth Control
- 6.2.2. Nitrochlorobenzenes
- 6.2.3. Polyphenylene Sulfide
- 6.2.4. Polysulfone Polymers
- 6.2.5. Solvents
- 6.2.6. Room and Sanitary Deodorants
- 6.2.7. Other Applications
- 6.1. Market Analysis, Insights and Forecast - by Type
- 7. Asia Pacific Chlorobenzene Industry Analysis, Insights and Forecast, 2020-2032
- 7.1. Market Analysis, Insights and Forecast - by Type
- 7.1.1. Monochlorobenzene
- 7.1.2. o-dichlorobenzene
- 7.1.3. p-dichlorobenzene
- 7.1.4. m-Dichlorobenzene
- 7.1.5. Other Types
- 7.2. Market Analysis, Insights and Forecast - by Application
- 7.2.1. Moth Control
- 7.2.2. Nitrochlorobenzenes
- 7.2.3. Polyphenylene Sulfide
- 7.2.4. Polysulfone Polymers
- 7.2.5. Solvents
- 7.2.6. Room and Sanitary Deodorants
- 7.2.7. Other Applications
- 7.1. Market Analysis, Insights and Forecast - by Type
- 8. North America Chlorobenzene Industry Analysis, Insights and Forecast, 2020-2032
- 8.1. Market Analysis, Insights and Forecast - by Type
- 8.1.1. Monochlorobenzene
- 8.1.2. o-dichlorobenzene
- 8.1.3. p-dichlorobenzene
- 8.1.4. m-Dichlorobenzene
- 8.1.5. Other Types
- 8.2. Market Analysis, Insights and Forecast - by Application
- 8.2.1. Moth Control
- 8.2.2. Nitrochlorobenzenes
- 8.2.3. Polyphenylene Sulfide
- 8.2.4. Polysulfone Polymers
- 8.2.5. Solvents
- 8.2.6. Room and Sanitary Deodorants
- 8.2.7. Other Applications
- 8.1. Market Analysis, Insights and Forecast - by Type
- 9. Europe Chlorobenzene Industry Analysis, Insights and Forecast, 2020-2032
- 9.1. Market Analysis, Insights and Forecast - by Type
- 9.1.1. Monochlorobenzene
- 9.1.2. o-dichlorobenzene
- 9.1.3. p-dichlorobenzene
- 9.1.4. m-Dichlorobenzene
- 9.1.5. Other Types
- 9.2. Market Analysis, Insights and Forecast - by Application
- 9.2.1. Moth Control
- 9.2.2. Nitrochlorobenzenes
- 9.2.3. Polyphenylene Sulfide
- 9.2.4. Polysulfone Polymers
- 9.2.5. Solvents
- 9.2.6. Room and Sanitary Deodorants
- 9.2.7. Other Applications
- 9.1. Market Analysis, Insights and Forecast - by Type
- 10. South America Chlorobenzene Industry Analysis, Insights and Forecast, 2020-2032
- 10.1. Market Analysis, Insights and Forecast - by Type
- 10.1.1. Monochlorobenzene
- 10.1.2. o-dichlorobenzene
- 10.1.3. p-dichlorobenzene
- 10.1.4. m-Dichlorobenzene
- 10.1.5. Other Types
- 10.2. Market Analysis, Insights and Forecast - by Application
- 10.2.1. Moth Control
- 10.2.2. Nitrochlorobenzenes
- 10.2.3. Polyphenylene Sulfide
- 10.2.4. Polysulfone Polymers
- 10.2.5. Solvents
- 10.2.6. Room and Sanitary Deodorants
- 10.2.7. Other Applications
- 10.1. Market Analysis, Insights and Forecast - by Type
- 11. Middle East Chlorobenzene Industry Analysis, Insights and Forecast, 2020-2032
- 11.1. Market Analysis, Insights and Forecast - by Type
- 11.1.1. Monochlorobenzene
- 11.1.2. o-dichlorobenzene
- 11.1.3. p-dichlorobenzene
- 11.1.4. m-Dichlorobenzene
- 11.1.5. Other Types
- 11.2. Market Analysis, Insights and Forecast - by Application
- 11.2.1. Moth Control
- 11.2.2. Nitrochlorobenzenes
- 11.2.3. Polyphenylene Sulfide
- 11.2.4. Polysulfone Polymers
- 11.2.5. Solvents
- 11.2.6. Room and Sanitary Deodorants
- 11.2.7. Other Applications
- 11.1. Market Analysis, Insights and Forecast - by Type
- 12. Saudi Arabia Chlorobenzene Industry Analysis, Insights and Forecast, 2020-2032
- 12.1. Market Analysis, Insights and Forecast - by Type
- 12.1.1. Monochlorobenzene
- 12.1.2. o-dichlorobenzene
- 12.1.3. p-dichlorobenzene
- 12.1.4. m-Dichlorobenzene
- 12.1.5. Other Types
- 12.2. Market Analysis, Insights and Forecast - by Application
- 12.2.1. Moth Control
- 12.2.2. Nitrochlorobenzenes
- 12.2.3. Polyphenylene Sulfide
- 12.2.4. Polysulfone Polymers
- 12.2.5. Solvents
- 12.2.6. Room and Sanitary Deodorants
- 12.2.7. Other Applications
- 12.1. Market Analysis, Insights and Forecast - by Type
- 13. Competitive Analysis
- 13.1. Company Profiles
- 13.1.1 Jiangsu Yangnong Chemicals Group Co Ltd
- 13.1.1.1. Company Overview
- 13.1.1.2. Products
- 13.1.1.3. Company Financials
- 13.1.1.4. SWOT Analysis
- 13.1.2 China Petrochemical Corporation
- 13.1.2.1. Company Overview
- 13.1.2.2. Products
- 13.1.2.3. Company Financials
- 13.1.2.4. SWOT Analysis
- 13.1.3 ITW Reagents Division (PanReac Applichem)
- 13.1.3.1. Company Overview
- 13.1.3.2. Products
- 13.1.3.3. Company Financials
- 13.1.3.4. SWOT Analysis
- 13.1.4 J&K Scientific Ltd
- 13.1.4.1. Company Overview
- 13.1.4.2. Products
- 13.1.4.3. Company Financials
- 13.1.4.4. SWOT Analysis
- 13.1.5 Anhui Bayi Chemical Industry
- 13.1.5.1. Company Overview
- 13.1.5.2. Products
- 13.1.5.3. Company Financials
- 13.1.5.4. SWOT Analysis
- 13.1.6 Chemada Fine Chemicals
- 13.1.6.1. Company Overview
- 13.1.6.2. Products
- 13.1.6.3. Company Financials
- 13.1.6.4. SWOT Analysis
- 13.1.7 Kureha Corporation
- 13.1.7.1. Company Overview
- 13.1.7.2. Products
- 13.1.7.3. Company Financials
- 13.1.7.4. SWOT Analysis
- 13.1.8 Tianjin Bohai Chemical Industry Co Ltd
- 13.1.8.1. Company Overview
- 13.1.8.2. Products
- 13.1.8.3. Company Financials
- 13.1.8.4. SWOT Analysis
- 13.1.9 Meryer (Shanghai) Chemical Technology Co Ltd
- 13.1.9.1. Company Overview
- 13.1.9.2. Products
- 13.1.9.3. Company Financials
- 13.1.9.4. SWOT Analysis
- 13.1.10 Lanxess
- 13.1.10.1. Company Overview
- 13.1.10.2. Products
- 13.1.10.3. Company Financials
- 13.1.10.4. SWOT Analysis
- 13.1.1 Jiangsu Yangnong Chemicals Group Co Ltd
- 13.2. Market Entropy
- 13.2.1 Company's Key Areas Served
- 13.2.2 Recent Developments
- 13.3. Company Market Share Analysis 2025
- 13.3.1 Top 5 Companies Market Share Analysis
- 13.3.2 Top 3 Companies Market Share Analysis
- 13.4. List of Potential Customers
- 14. Research Methodology
List of Figures
- Figure 1: Global Chlorobenzene Industry Revenue Breakdown (million, %) by Region 2025 & 2033
- Figure 2: Global Chlorobenzene Industry Volume Breakdown (K Tons, %) by Region 2025 & 2033
- Figure 3: Asia Pacific Chlorobenzene Industry Revenue (million), by Type 2025 & 2033
- Figure 4: Asia Pacific Chlorobenzene Industry Volume (K Tons), by Type 2025 & 2033
- Figure 5: Asia Pacific Chlorobenzene Industry Revenue Share (%), by Type 2025 & 2033
- Figure 6: Asia Pacific Chlorobenzene Industry Volume Share (%), by Type 2025 & 2033
- Figure 7: Asia Pacific Chlorobenzene Industry Revenue (million), by Application 2025 & 2033
- Figure 8: Asia Pacific Chlorobenzene Industry Volume (K Tons), by Application 2025 & 2033
- Figure 9: Asia Pacific Chlorobenzene Industry Revenue Share (%), by Application 2025 & 2033
- Figure 10: Asia Pacific Chlorobenzene Industry Volume Share (%), by Application 2025 & 2033
- Figure 11: Asia Pacific Chlorobenzene Industry Revenue (million), by Country 2025 & 2033
- Figure 12: Asia Pacific Chlorobenzene Industry Volume (K Tons), by Country 2025 & 2033
- Figure 13: Asia Pacific Chlorobenzene Industry Revenue Share (%), by Country 2025 & 2033
- Figure 14: Asia Pacific Chlorobenzene Industry Volume Share (%), by Country 2025 & 2033
- Figure 15: North America Chlorobenzene Industry Revenue (million), by Type 2025 & 2033
- Figure 16: North America Chlorobenzene Industry Volume (K Tons), by Type 2025 & 2033
- Figure 17: North America Chlorobenzene Industry Revenue Share (%), by Type 2025 & 2033
- Figure 18: North America Chlorobenzene Industry Volume Share (%), by Type 2025 & 2033
- Figure 19: North America Chlorobenzene Industry Revenue (million), by Application 2025 & 2033
- Figure 20: North America Chlorobenzene Industry Volume (K Tons), by Application 2025 & 2033
- Figure 21: North America Chlorobenzene Industry Revenue Share (%), by Application 2025 & 2033
- Figure 22: North America Chlorobenzene Industry Volume Share (%), by Application 2025 & 2033
- Figure 23: North America Chlorobenzene Industry Revenue (million), by Country 2025 & 2033
- Figure 24: North America Chlorobenzene Industry Volume (K Tons), by Country 2025 & 2033
- Figure 25: North America Chlorobenzene Industry Revenue Share (%), by Country 2025 & 2033
- Figure 26: North America Chlorobenzene Industry Volume Share (%), by Country 2025 & 2033
- Figure 27: Europe Chlorobenzene Industry Revenue (million), by Type 2025 & 2033
- Figure 28: Europe Chlorobenzene Industry Volume (K Tons), by Type 2025 & 2033
- Figure 29: Europe Chlorobenzene Industry Revenue Share (%), by Type 2025 & 2033
- Figure 30: Europe Chlorobenzene Industry Volume Share (%), by Type 2025 & 2033
- Figure 31: Europe Chlorobenzene Industry Revenue (million), by Application 2025 & 2033
- Figure 32: Europe Chlorobenzene Industry Volume (K Tons), by Application 2025 & 2033
- Figure 33: Europe Chlorobenzene Industry Revenue Share (%), by Application 2025 & 2033
- Figure 34: Europe Chlorobenzene Industry Volume Share (%), by Application 2025 & 2033
- Figure 35: Europe Chlorobenzene Industry Revenue (million), by Country 2025 & 2033
- Figure 36: Europe Chlorobenzene Industry Volume (K Tons), by Country 2025 & 2033
- Figure 37: Europe Chlorobenzene Industry Revenue Share (%), by Country 2025 & 2033
- Figure 38: Europe Chlorobenzene Industry Volume Share (%), by Country 2025 & 2033
- Figure 39: South America Chlorobenzene Industry Revenue (million), by Type 2025 & 2033
- Figure 40: South America Chlorobenzene Industry Volume (K Tons), by Type 2025 & 2033
- Figure 41: South America Chlorobenzene Industry Revenue Share (%), by Type 2025 & 2033
- Figure 42: South America Chlorobenzene Industry Volume Share (%), by Type 2025 & 2033
- Figure 43: South America Chlorobenzene Industry Revenue (million), by Application 2025 & 2033
- Figure 44: South America Chlorobenzene Industry Volume (K Tons), by Application 2025 & 2033
- Figure 45: South America Chlorobenzene Industry Revenue Share (%), by Application 2025 & 2033
- Figure 46: South America Chlorobenzene Industry Volume Share (%), by Application 2025 & 2033
- Figure 47: South America Chlorobenzene Industry Revenue (million), by Country 2025 & 2033
- Figure 48: South America Chlorobenzene Industry Volume (K Tons), by Country 2025 & 2033
- Figure 49: South America Chlorobenzene Industry Revenue Share (%), by Country 2025 & 2033
- Figure 50: South America Chlorobenzene Industry Volume Share (%), by Country 2025 & 2033
- Figure 51: Middle East Chlorobenzene Industry Revenue (million), by Type 2025 & 2033
- Figure 52: Middle East Chlorobenzene Industry Volume (K Tons), by Type 2025 & 2033
- Figure 53: Middle East Chlorobenzene Industry Revenue Share (%), by Type 2025 & 2033
- Figure 54: Middle East Chlorobenzene Industry Volume Share (%), by Type 2025 & 2033
- Figure 55: Middle East Chlorobenzene Industry Revenue (million), by Application 2025 & 2033
- Figure 56: Middle East Chlorobenzene Industry Volume (K Tons), by Application 2025 & 2033
- Figure 57: Middle East Chlorobenzene Industry Revenue Share (%), by Application 2025 & 2033
- Figure 58: Middle East Chlorobenzene Industry Volume Share (%), by Application 2025 & 2033
- Figure 59: Middle East Chlorobenzene Industry Revenue (million), by Country 2025 & 2033
- Figure 60: Middle East Chlorobenzene Industry Volume (K Tons), by Country 2025 & 2033
- Figure 61: Middle East Chlorobenzene Industry Revenue Share (%), by Country 2025 & 2033
- Figure 62: Middle East Chlorobenzene Industry Volume Share (%), by Country 2025 & 2033
- Figure 63: Saudi Arabia Chlorobenzene Industry Revenue (million), by Type 2025 & 2033
- Figure 64: Saudi Arabia Chlorobenzene Industry Volume (K Tons), by Type 2025 & 2033
- Figure 65: Saudi Arabia Chlorobenzene Industry Revenue Share (%), by Type 2025 & 2033
- Figure 66: Saudi Arabia Chlorobenzene Industry Volume Share (%), by Type 2025 & 2033
- Figure 67: Saudi Arabia Chlorobenzene Industry Revenue (million), by Application 2025 & 2033
- Figure 68: Saudi Arabia Chlorobenzene Industry Volume (K Tons), by Application 2025 & 2033
- Figure 69: Saudi Arabia Chlorobenzene Industry Revenue Share (%), by Application 2025 & 2033
- Figure 70: Saudi Arabia Chlorobenzene Industry Volume Share (%), by Application 2025 & 2033
- Figure 71: Saudi Arabia Chlorobenzene Industry Revenue (million), by Country 2025 & 2033
- Figure 72: Saudi Arabia Chlorobenzene Industry Volume (K Tons), by Country 2025 & 2033
- Figure 73: Saudi Arabia Chlorobenzene Industry Revenue Share (%), by Country 2025 & 2033
- Figure 74: Saudi Arabia Chlorobenzene Industry Volume Share (%), by Country 2025 & 2033
List of Tables
- Table 1: Global Chlorobenzene Industry Revenue million Forecast, by Type 2020 & 2033
- Table 2: Global Chlorobenzene Industry Volume K Tons Forecast, by Type 2020 & 2033
- Table 3: Global Chlorobenzene Industry Revenue million Forecast, by Application 2020 & 2033
- Table 4: Global Chlorobenzene Industry Volume K Tons Forecast, by Application 2020 & 2033
- Table 5: Global Chlorobenzene Industry Revenue million Forecast, by Region 2020 & 2033
- Table 6: Global Chlorobenzene Industry Volume K Tons Forecast, by Region 2020 & 2033
- Table 7: Global Chlorobenzene Industry Revenue million Forecast, by Type 2020 & 2033
- Table 8: Global Chlorobenzene Industry Volume K Tons Forecast, by Type 2020 & 2033
- Table 9: Global Chlorobenzene Industry Revenue million Forecast, by Application 2020 & 2033
- Table 10: Global Chlorobenzene Industry Volume K Tons Forecast, by Application 2020 & 2033
- Table 11: Global Chlorobenzene Industry Revenue million Forecast, by Country 2020 & 2033
- Table 12: Global Chlorobenzene Industry Volume K Tons Forecast, by Country 2020 & 2033
- Table 13: China Chlorobenzene Industry Revenue (million) Forecast, by Application 2020 & 2033
- Table 14: China Chlorobenzene Industry Volume (K Tons) Forecast, by Application 2020 & 2033
- Table 15: India Chlorobenzene Industry Revenue (million) Forecast, by Application 2020 & 2033
- Table 16: India Chlorobenzene Industry Volume (K Tons) Forecast, by Application 2020 & 2033
- Table 17: Japan Chlorobenzene Industry Revenue (million) Forecast, by Application 2020 & 2033
- Table 18: Japan Chlorobenzene Industry Volume (K Tons) Forecast, by Application 2020 & 2033
- Table 19: South Korea Chlorobenzene Industry Revenue (million) Forecast, by Application 2020 & 2033
- Table 20: South Korea Chlorobenzene Industry Volume (K Tons) Forecast, by Application 2020 & 2033
- Table 21: Malaysia Chlorobenzene Industry Revenue (million) Forecast, by Application 2020 & 2033
- Table 22: Malaysia Chlorobenzene Industry Volume (K Tons) Forecast, by Application 2020 & 2033
- Table 23: Thailand Chlorobenzene Industry Revenue (million) Forecast, by Application 2020 & 2033
- Table 24: Thailand Chlorobenzene Industry Volume (K Tons) Forecast, by Application 2020 & 2033
- Table 25: Indonesia Chlorobenzene Industry Revenue (million) Forecast, by Application 2020 & 2033
- Table 26: Indonesia Chlorobenzene Industry Volume (K Tons) Forecast, by Application 2020 & 2033
- Table 27: Vietnam Chlorobenzene Industry Revenue (million) Forecast, by Application 2020 & 2033
- Table 28: Vietnam Chlorobenzene Industry Volume (K Tons) Forecast, by Application 2020 & 2033
- Table 29: Rest of Asia Pacific Chlorobenzene Industry Revenue (million) Forecast, by Application 2020 & 2033
- Table 30: Rest of Asia Pacific Chlorobenzene Industry Volume (K Tons) Forecast, by Application 2020 & 2033
- Table 31: Global Chlorobenzene Industry Revenue million Forecast, by Type 2020 & 2033
- Table 32: Global Chlorobenzene Industry Volume K Tons Forecast, by Type 2020 & 2033
- Table 33: Global Chlorobenzene Industry Revenue million Forecast, by Application 2020 & 2033
- Table 34: Global Chlorobenzene Industry Volume K Tons Forecast, by Application 2020 & 2033
- Table 35: Global Chlorobenzene Industry Revenue million Forecast, by Country 2020 & 2033
- Table 36: Global Chlorobenzene Industry Volume K Tons Forecast, by Country 2020 & 2033
- Table 37: United States Chlorobenzene Industry Revenue (million) Forecast, by Application 2020 & 2033
- Table 38: United States Chlorobenzene Industry Volume (K Tons) Forecast, by Application 2020 & 2033
- Table 39: Canada Chlorobenzene Industry Revenue (million) Forecast, by Application 2020 & 2033
- Table 40: Canada Chlorobenzene Industry Volume (K Tons) Forecast, by Application 2020 & 2033
- Table 41: Mexico Chlorobenzene Industry Revenue (million) Forecast, by Application 2020 & 2033
- Table 42: Mexico Chlorobenzene Industry Volume (K Tons) Forecast, by Application 2020 & 2033
- Table 43: Global Chlorobenzene Industry Revenue million Forecast, by Type 2020 & 2033
- Table 44: Global Chlorobenzene Industry Volume K Tons Forecast, by Type 2020 & 2033
- Table 45: Global Chlorobenzene Industry Revenue million Forecast, by Application 2020 & 2033
- Table 46: Global Chlorobenzene Industry Volume K Tons Forecast, by Application 2020 & 2033
- Table 47: Global Chlorobenzene Industry Revenue million Forecast, by Country 2020 & 2033
- Table 48: Global Chlorobenzene Industry Volume K Tons Forecast, by Country 2020 & 2033
- Table 49: Germany Chlorobenzene Industry Revenue (million) Forecast, by Application 2020 & 2033
- Table 50: Germany Chlorobenzene Industry Volume (K Tons) Forecast, by Application 2020 & 2033
- Table 51: United Kingdom Chlorobenzene Industry Revenue (million) Forecast, by Application 2020 & 2033
- Table 52: United Kingdom Chlorobenzene Industry Volume (K Tons) Forecast, by Application 2020 & 2033
- Table 53: France Chlorobenzene Industry Revenue (million) Forecast, by Application 2020 & 2033
- Table 54: France Chlorobenzene Industry Volume (K Tons) Forecast, by Application 2020 & 2033
- Table 55: Italy Chlorobenzene Industry Revenue (million) Forecast, by Application 2020 & 2033
- Table 56: Italy Chlorobenzene Industry Volume (K Tons) Forecast, by Application 2020 & 2033
- Table 57: Spain Chlorobenzene Industry Revenue (million) Forecast, by Application 2020 & 2033
- Table 58: Spain Chlorobenzene Industry Volume (K Tons) Forecast, by Application 2020 & 2033
- Table 59: Nordic Chlorobenzene Industry Revenue (million) Forecast, by Application 2020 & 2033
- Table 60: Nordic Chlorobenzene Industry Volume (K Tons) Forecast, by Application 2020 & 2033
- Table 61: Turkey Chlorobenzene Industry Revenue (million) Forecast, by Application 2020 & 2033
- Table 62: Turkey Chlorobenzene Industry Volume (K Tons) Forecast, by Application 2020 & 2033
- Table 63: Russia Chlorobenzene Industry Revenue (million) Forecast, by Application 2020 & 2033
- Table 64: Russia Chlorobenzene Industry Volume (K Tons) Forecast, by Application 2020 & 2033
- Table 65: Rest of Europe Chlorobenzene Industry Revenue (million) Forecast, by Application 2020 & 2033
- Table 66: Rest of Europe Chlorobenzene Industry Volume (K Tons) Forecast, by Application 2020 & 2033
- Table 67: Global Chlorobenzene Industry Revenue million Forecast, by Type 2020 & 2033
- Table 68: Global Chlorobenzene Industry Volume K Tons Forecast, by Type 2020 & 2033
- Table 69: Global Chlorobenzene Industry Revenue million Forecast, by Application 2020 & 2033
- Table 70: Global Chlorobenzene Industry Volume K Tons Forecast, by Application 2020 & 2033
- Table 71: Global Chlorobenzene Industry Revenue million Forecast, by Country 2020 & 2033
- Table 72: Global Chlorobenzene Industry Volume K Tons Forecast, by Country 2020 & 2033
- Table 73: Brazil Chlorobenzene Industry Revenue (million) Forecast, by Application 2020 & 2033
- Table 74: Brazil Chlorobenzene Industry Volume (K Tons) Forecast, by Application 2020 & 2033
- Table 75: Argentina Chlorobenzene Industry Revenue (million) Forecast, by Application 2020 & 2033
- Table 76: Argentina Chlorobenzene Industry Volume (K Tons) Forecast, by Application 2020 & 2033
- Table 77: Colombia Chlorobenzene Industry Revenue (million) Forecast, by Application 2020 & 2033
- Table 78: Colombia Chlorobenzene Industry Volume (K Tons) Forecast, by Application 2020 & 2033
- Table 79: Rest of South America Chlorobenzene Industry Revenue (million) Forecast, by Application 2020 & 2033
- Table 80: Rest of South America Chlorobenzene Industry Volume (K Tons) Forecast, by Application 2020 & 2033
- Table 81: Global Chlorobenzene Industry Revenue million Forecast, by Type 2020 & 2033
- Table 82: Global Chlorobenzene Industry Volume K Tons Forecast, by Type 2020 & 2033
- Table 83: Global Chlorobenzene Industry Revenue million Forecast, by Application 2020 & 2033
- Table 84: Global Chlorobenzene Industry Volume K Tons Forecast, by Application 2020 & 2033
- Table 85: Global Chlorobenzene Industry Revenue million Forecast, by Country 2020 & 2033
- Table 86: Global Chlorobenzene Industry Volume K Tons Forecast, by Country 2020 & 2033
- Table 87: Global Chlorobenzene Industry Revenue million Forecast, by Type 2020 & 2033
- Table 88: Global Chlorobenzene Industry Volume K Tons Forecast, by Type 2020 & 2033
- Table 89: Global Chlorobenzene Industry Revenue million Forecast, by Application 2020 & 2033
- Table 90: Global Chlorobenzene Industry Volume K Tons Forecast, by Application 2020 & 2033
- Table 91: Global Chlorobenzene Industry Revenue million Forecast, by Country 2020 & 2033
- Table 92: Global Chlorobenzene Industry Volume K Tons Forecast, by Country 2020 & 2033
- Table 93: South Africa Chlorobenzene Industry Revenue (million) Forecast, by Application 2020 & 2033
- Table 94: South Africa Chlorobenzene Industry Volume (K Tons) Forecast, by Application 2020 & 2033
- Table 95: Nigeria Chlorobenzene Industry Revenue (million) Forecast, by Application 2020 & 2033
- Table 96: Nigeria Chlorobenzene Industry Volume (K Tons) Forecast, by Application 2020 & 2033
- Table 97: Qatar Chlorobenzene Industry Revenue (million) Forecast, by Application 2020 & 2033
- Table 98: Qatar Chlorobenzene Industry Volume (K Tons) Forecast, by Application 2020 & 2033
- Table 99: Egypt Chlorobenzene Industry Revenue (million) Forecast, by Application 2020 & 2033
- Table 100: Egypt Chlorobenzene Industry Volume (K Tons) Forecast, by Application 2020 & 2033
- Table 101: United Arab Emirates Chlorobenzene Industry Revenue (million) Forecast, by Application 2020 & 2033
- Table 102: United Arab Emirates Chlorobenzene Industry Volume (K Tons) Forecast, by Application 2020 & 2033
- Table 103: Rest of Middle East Chlorobenzene Industry Revenue (million) Forecast, by Application 2020 & 2033
- Table 104: Rest of Middle East Chlorobenzene Industry Volume (K Tons) Forecast, by Application 2020 & 2033
Frequently Asked Questions
1. What is the projected Compound Annual Growth Rate (CAGR) of the Chlorobenzene Industry?
The projected CAGR is approximately 3.5%.
2. Which companies are prominent players in the Chlorobenzene Industry?
Key companies in the market include Jiangsu Yangnong Chemicals Group Co Ltd, China Petrochemical Corporation, ITW Reagents Division (PanReac Applichem), J&K Scientific Ltd, Anhui Bayi Chemical Industry, Chemada Fine Chemicals, Kureha Corporation, Tianjin Bohai Chemical Industry Co Ltd , Meryer (Shanghai) Chemical Technology Co Ltd, Lanxess.
3. What are the main segments of the Chlorobenzene Industry?
The market segments include Type, Application.
4. Can you provide details about the market size?
The market size is estimated to be USD 2357 million as of 2022.
5. What are some drivers contributing to market growth?
Rising demand for Nitrochlorobenzene; Surging Application in the Chemical Industry; Other Drivers.
6. What are the notable trends driving market growth?
Nitrochlorobenzenes to Dominate the Market.
7. Are there any restraints impacting market growth?
Detrimental Effects of Chlorobenzene Exposure; Other Restraints.
8. Can you provide examples of recent developments in the market?
N/A
9. What pricing options are available for accessing the report?
Pricing options include single-user, multi-user, and enterprise licenses priced at USD 4750, USD 5250, and USD 8750 respectively.
10. Is the market size provided in terms of value or volume?
The market size is provided in terms of value, measured in million and volume, measured in K Tons.
11. Are there any specific market keywords associated with the report?
Yes, the market keyword associated with the report is "Chlorobenzene Industry," which aids in identifying and referencing the specific market segment covered.
12. How do I determine which pricing option suits my needs best?
The pricing options vary based on user requirements and access needs. Individual users may opt for single-user licenses, while businesses requiring broader access may choose multi-user or enterprise licenses for cost-effective access to the report.
13. Are there any additional resources or data provided in the Chlorobenzene Industry report?
While the report offers comprehensive insights, it's advisable to review the specific contents or supplementary materials provided to ascertain if additional resources or data are available.
14. How can I stay updated on further developments or reports in the Chlorobenzene Industry?
To stay informed about further developments, trends, and reports in the Chlorobenzene Industry, consider subscribing to industry newsletters, following relevant companies and organizations, or regularly checking reputable industry news sources and publications.
Methodology
Step 1 - Identification of Relevant Samples Size from Population Database


Step 2 - Approaches for Defining Global Market Size (Value, Volume* & Price*)

Note*: In applicable scenarios
Step 3 - Data Sources
Primary Research
- Web Analytics
- Survey Reports
- Research Institute
- Latest Research Reports
- Opinion Leaders
Secondary Research
- Annual Reports
- White Paper
- Latest Press Release
- Industry Association
- Paid Database
- Investor Presentations

Step 4 - Data Triangulation
Involves using different sources of information in order to increase the validity of a study
These sources are likely to be stakeholders in a program - participants, other researchers, program staff, other community members, and so on.
Then we put all data in single framework & apply various statistical tools to find out the dynamic on the market.
During the analysis stage, feedback from the stakeholder groups would be compared to determine areas of agreement as well as areas of divergence