

Key Insights
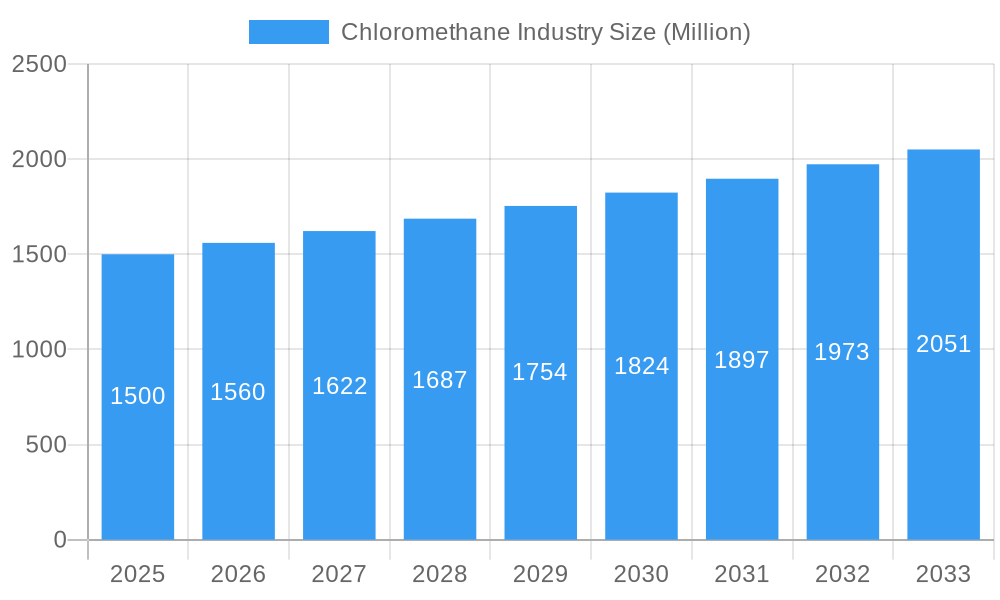
The global chloromethane market, valued at $6.1 billion in the base year 2025, is poised for substantial growth, exhibiting a Compound Annual Growth Rate (CAGR) of 5.2% through 2033. This expansion is primarily fueled by escalating demand from the silicones industry, where chloromethane is an essential feedstock for silicone polymer production, critical for sealants, adhesives, and personal care products. The agricultural chemicals sector also significantly contributes through chloromethane's role in synthesizing pesticides and herbicides. Pharmaceutical applications, utilizing chloromethane as a chemical intermediate for drug manufacturing, further bolster market growth. Innovations in production efficiency and cost reduction also support this positive trajectory.
Chloromethane Industry Market Size (In Billion)
Despite this promising outlook, market restraints include environmental regulations concerning chloromethane's use and handling, necessitating investments in emission control and safety measures. Fluctuations in raw material prices, such as methane and chlorine, can impact profitability. Furthermore, competition from alternative chemicals and the development of sustainable substitutes may affect market share. Nevertheless, robust demand from key industries and technological advancements ensure continued growth. Emerging economies, particularly in the Asia Pacific region, including China and India, present significant expansion opportunities. The increasing global demand for silicone-based products across diverse end-use sectors underpins the strong growth forecast.
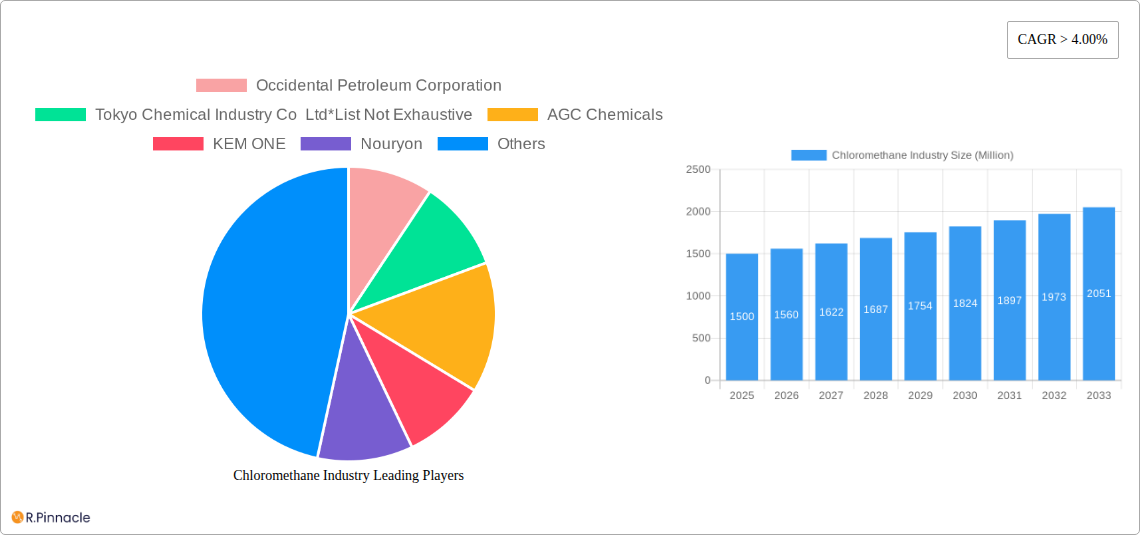
Chloromethane Industry Company Market Share
Chloromethane Industry Market Report: 2019-2033
This comprehensive report provides a detailed analysis of the Chloromethane industry, offering actionable insights for industry professionals and investors. With a study period spanning 2019-2033, a base year of 2025, and a forecast period of 2025-2033, this report meticulously examines market dynamics, growth drivers, challenges, and emerging opportunities. The report leverages extensive data analysis to deliver accurate market size estimations (in Millions) and forecasts, providing a robust foundation for strategic decision-making.
Chloromethane Industry Market Structure & Innovation Trends
This section analyzes the competitive landscape of the chloromethane market, including market concentration, innovation drivers, regulatory influences, and key M&A activities from 2019 to 2024. The report assesses the market share of leading players such as Occidental Petroleum Corporation, Tokyo Chemical Industry Co Ltd, AGC Chemicals, KEM ONE, Nouryon, Merck KGaA, Tokuyama Corporation, The Sanmar Group, Gujarat Alkalies and Chemical Limited, Shin-Etsu Chemical Co Ltd, and Gujarat Fluorochemicals Limited (list not exhaustive). The analysis considers the impact of mergers and acquisitions (M&A), quantifying deal values where available, and exploring their influence on market consolidation and innovation. Furthermore, the report examines the regulatory environment, the availability of product substitutes, and the evolving end-user demographics shaping industry trends. The analysis includes:
- Market Concentration: Assessment of market share held by top players and analysis of competitive intensity.
- Innovation Drivers: Identification of key technological advancements and their impact on market growth.
- Regulatory Frameworks: Examination of existing regulations and their influence on industry practices and market dynamics.
- Product Substitutes: Analysis of available alternatives and their potential impact on market share.
- M&A Activities: Detailed review of significant mergers and acquisitions, including deal values and strategic implications. Examples include the USD xx Million acquisition of a Poland-based supplier by Nouryon.
Chloromethane Industry Market Dynamics & Trends
This section delves into the key factors driving market growth, technological disruptions, evolving consumer preferences, and competitive dynamics within the chloromethane industry from 2019 to 2024. The report uses a detailed analysis to project the Compound Annual Growth Rate (CAGR) and market penetration rates for the forecast period (2025-2033). This analysis also considers emerging trends and shifts in consumer demands which may impact the market. Key aspects covered include:
- Market size and growth projections across different segments and regions.
- Analysis of technological advancements impacting production and application of chloromethane.
- Detailed examination of consumer preferences and their influence on market demand.
- Competitive landscape analysis including competitive strategies of key players.
Dominant Regions & Segments in Chloromethane Industry
This section identifies the leading geographical regions and product/application segments within the chloromethane market. Dominance analysis focuses on factors such as economic policies, infrastructure development, and consumer demand. For product types (Methylene Chloride, Methyl Chloride, Carbon Tetrachloride, Chloroform) and applications (Silicones, Agriculture Chemicals, Pharmaceutical, Chemical Intermediate, Personal Care, Other Applications), the analysis will pinpoint the leading segments based on market share and growth projections for the forecast period. The key drivers of dominance for each region and segment are identified using bullet points:
- Leading Region/Country: [Insert dominant region/country based on analysis]
- Key Drivers:
- [List key economic drivers]
- [List key infrastructural drivers]
- [List other relevant drivers]
- Key Drivers:
- Leading Product Type: [Insert dominant product type based on analysis]
- Key Drivers: [Paragraph explaining drivers]
- Leading Application: [Insert dominant application based on analysis]
- Key Drivers: [Paragraph explaining drivers]
Chloromethane Industry Product Innovations
This section summarizes recent product developments, emphasizing technological trends and market fit. This includes new formulations, enhanced performance characteristics, and other innovations that have improved the functionality, efficiency, or sustainability of chloromethane products. The competitive advantages conferred by these innovations are also explored.
Report Scope & Segmentation Analysis
This report segments the Chloromethane market by Product Type (Methylene Chloride, Methyl Chloride, Carbon Tetrachloride, Chloroform) and Application (Silicones, Agriculture Chemicals, Pharmaceutical, Chemical Intermediate, Personal Care, Other Applications). Each segment's analysis includes growth projections, market size estimations for the historical period (2019-2024) and the forecast period (2025-2033), and competitive dynamics.
- Product Type Segmentation: [Paragraph detailing each product type, market size, and growth projections]
- Application Segmentation: [Paragraph detailing each application, market size, and growth projections]
Key Drivers of Chloromethane Industry Growth
Several factors contribute to the growth of the chloromethane industry. These include:
- Technological advancements in production processes leading to increased efficiency and reduced costs.
- Growing demand from key application sectors such as silicones and agricultural chemicals.
- Favorable economic conditions in key regions driving industrial activity and infrastructure development.
Challenges in the Chloromethane Industry Sector
The chloromethane industry faces several challenges:
- Stringent environmental regulations limiting production and impacting profitability.
- Fluctuations in raw material prices affecting production costs and margins.
- Intense competition amongst existing players and the potential entry of new players.
Emerging Opportunities in Chloromethane Industry
The chloromethane industry presents several emerging opportunities:
- Expansion into new and growing markets in developing economies.
- Development of innovative applications in emerging sectors such as renewable energy.
- Adoption of sustainable production practices to meet environmental regulations and enhance brand image.
Leading Players in the Chloromethane Industry Market
- Occidental Petroleum Corporation
- Tokyo Chemical Industry Co Ltd
- AGC Chemicals
- KEM ONE
- Nouryon
- Merck KGaA
- Tokuyama Corporation
- The Sanmar Group
- Gujarat Alkalies and Chemical Limited
- Shin-Etsu Chemical Co Ltd
- Gujarat Fluorochemicals Limited
Key Developments in Chloromethane Industry
- May 2022: AGC Inc. invested USD 0.76 Billion to increase chlor-alkali production capacity in Indochina, impacting PVC and vinyl chloride monomer markets.
- January 2023: Nouryon acquired a Polish supplier of agricultural solutions, expanding its presence in the agricultural chemicals market.
Future Outlook for Chloromethane Industry Market
The chloromethane market is poised for continued growth, driven by increasing demand from key application sectors and technological advancements. Strategic investments in research and development, expansion into new markets, and adoption of sustainable practices will be key to success in the coming years. The market is expected to see a [Insert predicted growth percentage]% CAGR during the forecast period.
Chloromethane Industry Segmentation
-
1. Product Type
- 1.1. Methylene Chloride
- 1.2. Methyl Chloride
- 1.3. Carbon Tetrachloride
- 1.4. Chloroform
-
2. Application
- 2.1. Silicones
- 2.2. Agriculture Chemicals
- 2.3. Pharmaceutical
- 2.4. Chemical Intermediate
- 2.5. Personal Care
- 2.6. Other Applications
Chloromethane Industry Segmentation By Geography
-
1. Asia Pacific
- 1.1. China
- 1.2. India
- 1.3. Japan
- 1.4. South Korea
- 1.5. Rest of Asia Pacific
-
2. North America
- 2.1. United States
- 2.2. Canada
- 2.3. Mexico
-
3. Europe
- 3.1. Germany
- 3.2. United Kingdom
- 3.3. Italy
- 3.4. France
- 3.5. Rest of Europe
-
4. South America
- 4.1. Brazil
- 4.2. Argentina
- 4.3. Rest of South America
-
5. Middle East and Africa
- 5.1. Saudi Arabia
- 5.2. South Africa
- 5.3. Rest of Middle East and Africa
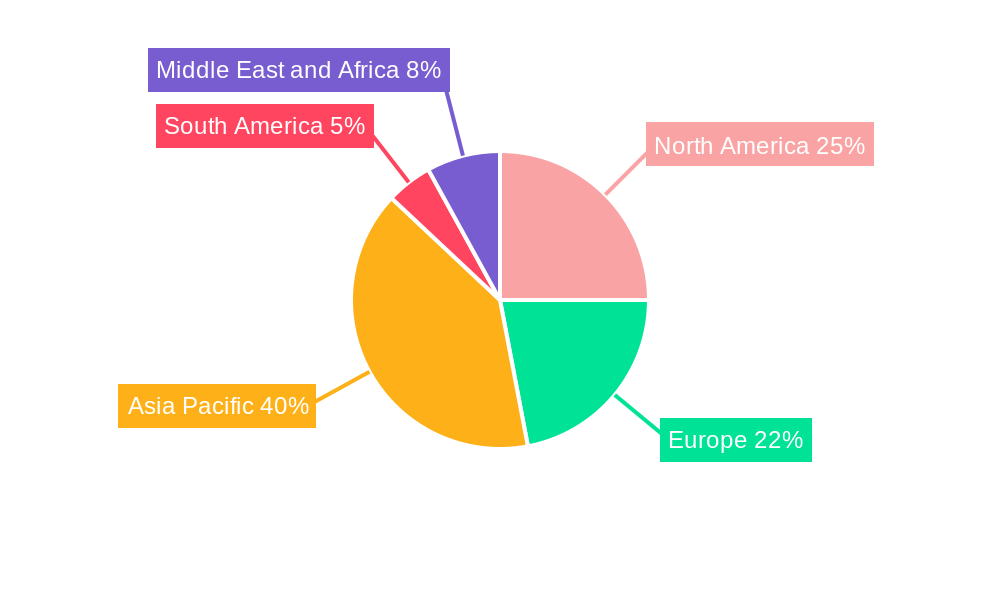
Chloromethane Industry Regional Market Share
Geographic Coverage of Chloromethane Industry
Chloromethane Industry REPORT HIGHLIGHTS
| Aspects | Details |
|---|---|
| Study Period | 2020-2034 |
| Base Year | 2025 |
| Estimated Year | 2026 |
| Forecast Period | 2026-2034 |
| Historical Period | 2020-2025 |
| Growth Rate | CAGR of 5.2% from 2020-2034 |
| Segmentation |
|
Table of Contents
- 1. Introduction
- 1.1. Research Scope
- 1.2. Market Segmentation
- 1.3. Research Objective
- 1.4. Definitions and Assumptions
- 2. Executive Summary
- 2.1. Market Snapshot
- 3. Market Dynamics
- 3.1. Market Drivers
- 3.2. Market Restrains
- 3.3. Market Trends
- 3.4. Market Opportunities
- 4. Market Factor Analysis
- 4.1. Porters Five Forces
- 4.1.1. Bargaining Power of Suppliers
- 4.1.2. Bargaining Power of Buyers
- 4.1.3. Threat of New Entrants
- 4.1.4. Threat of Substitutes
- 4.1.5. Competitive Rivalry
- 4.2. PESTEL analysis
- 4.3. BCG Analysis
- 4.3.1. Stars (High Growth, High Market Share)
- 4.3.2. Cash Cows (Low Growth, High Market Share)
- 4.3.3. Question Mark (High Growth, Low Market Share)
- 4.3.4. Dogs (Low Growth, Low Market Share)
- 4.4. Ansoff Matrix Analysis
- 4.5. Supply Chain Analysis
- 4.6. Regulatory Landscape
- 4.7. Current Market Potential and Opportunity Assessment (TAM–SAM–SOM Framework)
- 4.8. PRI Analyst Note
- 4.1. Porters Five Forces
- 5. Market Analysis, Insights and Forecast 2021-2033
- 5.1. Market Analysis, Insights and Forecast - by Product Type
- 5.1.1. Methylene Chloride
- 5.1.2. Methyl Chloride
- 5.1.3. Carbon Tetrachloride
- 5.1.4. Chloroform
- 5.2. Market Analysis, Insights and Forecast - by Application
- 5.2.1. Silicones
- 5.2.2. Agriculture Chemicals
- 5.2.3. Pharmaceutical
- 5.2.4. Chemical Intermediate
- 5.2.5. Personal Care
- 5.2.6. Other Applications
- 5.3. Market Analysis, Insights and Forecast - by Region
- 5.3.1. Asia Pacific
- 5.3.2. North America
- 5.3.3. Europe
- 5.3.4. South America
- 5.3.5. Middle East and Africa
- 5.1. Market Analysis, Insights and Forecast - by Product Type
- 6. Global Chloromethane Industry Analysis, Insights and Forecast, 2021-2033
- 6.1. Market Analysis, Insights and Forecast - by Product Type
- 6.1.1. Methylene Chloride
- 6.1.2. Methyl Chloride
- 6.1.3. Carbon Tetrachloride
- 6.1.4. Chloroform
- 6.2. Market Analysis, Insights and Forecast - by Application
- 6.2.1. Silicones
- 6.2.2. Agriculture Chemicals
- 6.2.3. Pharmaceutical
- 6.2.4. Chemical Intermediate
- 6.2.5. Personal Care
- 6.2.6. Other Applications
- 6.1. Market Analysis, Insights and Forecast - by Product Type
- 7. Asia Pacific Chloromethane Industry Analysis, Insights and Forecast, 2020-2032
- 7.1. Market Analysis, Insights and Forecast - by Product Type
- 7.1.1. Methylene Chloride
- 7.1.2. Methyl Chloride
- 7.1.3. Carbon Tetrachloride
- 7.1.4. Chloroform
- 7.2. Market Analysis, Insights and Forecast - by Application
- 7.2.1. Silicones
- 7.2.2. Agriculture Chemicals
- 7.2.3. Pharmaceutical
- 7.2.4. Chemical Intermediate
- 7.2.5. Personal Care
- 7.2.6. Other Applications
- 7.1. Market Analysis, Insights and Forecast - by Product Type
- 8. North America Chloromethane Industry Analysis, Insights and Forecast, 2020-2032
- 8.1. Market Analysis, Insights and Forecast - by Product Type
- 8.1.1. Methylene Chloride
- 8.1.2. Methyl Chloride
- 8.1.3. Carbon Tetrachloride
- 8.1.4. Chloroform
- 8.2. Market Analysis, Insights and Forecast - by Application
- 8.2.1. Silicones
- 8.2.2. Agriculture Chemicals
- 8.2.3. Pharmaceutical
- 8.2.4. Chemical Intermediate
- 8.2.5. Personal Care
- 8.2.6. Other Applications
- 8.1. Market Analysis, Insights and Forecast - by Product Type
- 9. Europe Chloromethane Industry Analysis, Insights and Forecast, 2020-2032
- 9.1. Market Analysis, Insights and Forecast - by Product Type
- 9.1.1. Methylene Chloride
- 9.1.2. Methyl Chloride
- 9.1.3. Carbon Tetrachloride
- 9.1.4. Chloroform
- 9.2. Market Analysis, Insights and Forecast - by Application
- 9.2.1. Silicones
- 9.2.2. Agriculture Chemicals
- 9.2.3. Pharmaceutical
- 9.2.4. Chemical Intermediate
- 9.2.5. Personal Care
- 9.2.6. Other Applications
- 9.1. Market Analysis, Insights and Forecast - by Product Type
- 10. South America Chloromethane Industry Analysis, Insights and Forecast, 2020-2032
- 10.1. Market Analysis, Insights and Forecast - by Product Type
- 10.1.1. Methylene Chloride
- 10.1.2. Methyl Chloride
- 10.1.3. Carbon Tetrachloride
- 10.1.4. Chloroform
- 10.2. Market Analysis, Insights and Forecast - by Application
- 10.2.1. Silicones
- 10.2.2. Agriculture Chemicals
- 10.2.3. Pharmaceutical
- 10.2.4. Chemical Intermediate
- 10.2.5. Personal Care
- 10.2.6. Other Applications
- 10.1. Market Analysis, Insights and Forecast - by Product Type
- 11. Middle East and Africa Chloromethane Industry Analysis, Insights and Forecast, 2020-2032
- 11.1. Market Analysis, Insights and Forecast - by Product Type
- 11.1.1. Methylene Chloride
- 11.1.2. Methyl Chloride
- 11.1.3. Carbon Tetrachloride
- 11.1.4. Chloroform
- 11.2. Market Analysis, Insights and Forecast - by Application
- 11.2.1. Silicones
- 11.2.2. Agriculture Chemicals
- 11.2.3. Pharmaceutical
- 11.2.4. Chemical Intermediate
- 11.2.5. Personal Care
- 11.2.6. Other Applications
- 11.1. Market Analysis, Insights and Forecast - by Product Type
- 12. Competitive Analysis
- 12.1. Company Profiles
- 12.1.1 Occidental Petroleum Corporation
- 12.1.1.1. Company Overview
- 12.1.1.2. Products
- 12.1.1.3. Company Financials
- 12.1.1.4. SWOT Analysis
- 12.1.2 Tokyo Chemical Industry Co Ltd*List Not Exhaustive
- 12.1.2.1. Company Overview
- 12.1.2.2. Products
- 12.1.2.3. Company Financials
- 12.1.2.4. SWOT Analysis
- 12.1.3 AGC Chemicals
- 12.1.3.1. Company Overview
- 12.1.3.2. Products
- 12.1.3.3. Company Financials
- 12.1.3.4. SWOT Analysis
- 12.1.4 KEM ONE
- 12.1.4.1. Company Overview
- 12.1.4.2. Products
- 12.1.4.3. Company Financials
- 12.1.4.4. SWOT Analysis
- 12.1.5 Nouryon
- 12.1.5.1. Company Overview
- 12.1.5.2. Products
- 12.1.5.3. Company Financials
- 12.1.5.4. SWOT Analysis
- 12.1.6 Merck KGaA
- 12.1.6.1. Company Overview
- 12.1.6.2. Products
- 12.1.6.3. Company Financials
- 12.1.6.4. SWOT Analysis
- 12.1.7 Tokuyama Corporation
- 12.1.7.1. Company Overview
- 12.1.7.2. Products
- 12.1.7.3. Company Financials
- 12.1.7.4. SWOT Analysis
- 12.1.8 The Sanmar Group
- 12.1.8.1. Company Overview
- 12.1.8.2. Products
- 12.1.8.3. Company Financials
- 12.1.8.4. SWOT Analysis
- 12.1.9 Gujarat Alkalies and Chemical Limited
- 12.1.9.1. Company Overview
- 12.1.9.2. Products
- 12.1.9.3. Company Financials
- 12.1.9.4. SWOT Analysis
- 12.1.10 Shin-Etsu Chemical Co Ltd
- 12.1.10.1. Company Overview
- 12.1.10.2. Products
- 12.1.10.3. Company Financials
- 12.1.10.4. SWOT Analysis
- 12.1.11 Gujarat Fluorochemicals Limited
- 12.1.11.1. Company Overview
- 12.1.11.2. Products
- 12.1.11.3. Company Financials
- 12.1.11.4. SWOT Analysis
- 12.1.1 Occidental Petroleum Corporation
- 12.2. Market Entropy
- 12.2.1 Company's Key Areas Served
- 12.2.2 Recent Developments
- 12.3. Company Market Share Analysis 2025
- 12.3.1 Top 5 Companies Market Share Analysis
- 12.3.2 Top 3 Companies Market Share Analysis
- 12.4. List of Potential Customers
- 13. Research Methodology
List of Figures
- Figure 1: Global Chloromethane Industry Revenue Breakdown (billion, %) by Region 2025 & 2033
- Figure 2: Asia Pacific Chloromethane Industry Revenue (billion), by Product Type 2025 & 2033
- Figure 3: Asia Pacific Chloromethane Industry Revenue Share (%), by Product Type 2025 & 2033
- Figure 4: Asia Pacific Chloromethane Industry Revenue (billion), by Application 2025 & 2033
- Figure 5: Asia Pacific Chloromethane Industry Revenue Share (%), by Application 2025 & 2033
- Figure 6: Asia Pacific Chloromethane Industry Revenue (billion), by Country 2025 & 2033
- Figure 7: Asia Pacific Chloromethane Industry Revenue Share (%), by Country 2025 & 2033
- Figure 8: North America Chloromethane Industry Revenue (billion), by Product Type 2025 & 2033
- Figure 9: North America Chloromethane Industry Revenue Share (%), by Product Type 2025 & 2033
- Figure 10: North America Chloromethane Industry Revenue (billion), by Application 2025 & 2033
- Figure 11: North America Chloromethane Industry Revenue Share (%), by Application 2025 & 2033
- Figure 12: North America Chloromethane Industry Revenue (billion), by Country 2025 & 2033
- Figure 13: North America Chloromethane Industry Revenue Share (%), by Country 2025 & 2033
- Figure 14: Europe Chloromethane Industry Revenue (billion), by Product Type 2025 & 2033
- Figure 15: Europe Chloromethane Industry Revenue Share (%), by Product Type 2025 & 2033
- Figure 16: Europe Chloromethane Industry Revenue (billion), by Application 2025 & 2033
- Figure 17: Europe Chloromethane Industry Revenue Share (%), by Application 2025 & 2033
- Figure 18: Europe Chloromethane Industry Revenue (billion), by Country 2025 & 2033
- Figure 19: Europe Chloromethane Industry Revenue Share (%), by Country 2025 & 2033
- Figure 20: South America Chloromethane Industry Revenue (billion), by Product Type 2025 & 2033
- Figure 21: South America Chloromethane Industry Revenue Share (%), by Product Type 2025 & 2033
- Figure 22: South America Chloromethane Industry Revenue (billion), by Application 2025 & 2033
- Figure 23: South America Chloromethane Industry Revenue Share (%), by Application 2025 & 2033
- Figure 24: South America Chloromethane Industry Revenue (billion), by Country 2025 & 2033
- Figure 25: South America Chloromethane Industry Revenue Share (%), by Country 2025 & 2033
- Figure 26: Middle East and Africa Chloromethane Industry Revenue (billion), by Product Type 2025 & 2033
- Figure 27: Middle East and Africa Chloromethane Industry Revenue Share (%), by Product Type 2025 & 2033
- Figure 28: Middle East and Africa Chloromethane Industry Revenue (billion), by Application 2025 & 2033
- Figure 29: Middle East and Africa Chloromethane Industry Revenue Share (%), by Application 2025 & 2033
- Figure 30: Middle East and Africa Chloromethane Industry Revenue (billion), by Country 2025 & 2033
- Figure 31: Middle East and Africa Chloromethane Industry Revenue Share (%), by Country 2025 & 2033
List of Tables
- Table 1: Global Chloromethane Industry Revenue billion Forecast, by Product Type 2020 & 2033
- Table 2: Global Chloromethane Industry Revenue billion Forecast, by Application 2020 & 2033
- Table 3: Global Chloromethane Industry Revenue billion Forecast, by Region 2020 & 2033
- Table 4: Global Chloromethane Industry Revenue billion Forecast, by Product Type 2020 & 2033
- Table 5: Global Chloromethane Industry Revenue billion Forecast, by Application 2020 & 2033
- Table 6: Global Chloromethane Industry Revenue billion Forecast, by Country 2020 & 2033
- Table 7: China Chloromethane Industry Revenue (billion) Forecast, by Application 2020 & 2033
- Table 8: India Chloromethane Industry Revenue (billion) Forecast, by Application 2020 & 2033
- Table 9: Japan Chloromethane Industry Revenue (billion) Forecast, by Application 2020 & 2033
- Table 10: South Korea Chloromethane Industry Revenue (billion) Forecast, by Application 2020 & 2033
- Table 11: Rest of Asia Pacific Chloromethane Industry Revenue (billion) Forecast, by Application 2020 & 2033
- Table 12: Global Chloromethane Industry Revenue billion Forecast, by Product Type 2020 & 2033
- Table 13: Global Chloromethane Industry Revenue billion Forecast, by Application 2020 & 2033
- Table 14: Global Chloromethane Industry Revenue billion Forecast, by Country 2020 & 2033
- Table 15: United States Chloromethane Industry Revenue (billion) Forecast, by Application 2020 & 2033
- Table 16: Canada Chloromethane Industry Revenue (billion) Forecast, by Application 2020 & 2033
- Table 17: Mexico Chloromethane Industry Revenue (billion) Forecast, by Application 2020 & 2033
- Table 18: Global Chloromethane Industry Revenue billion Forecast, by Product Type 2020 & 2033
- Table 19: Global Chloromethane Industry Revenue billion Forecast, by Application 2020 & 2033
- Table 20: Global Chloromethane Industry Revenue billion Forecast, by Country 2020 & 2033
- Table 21: Germany Chloromethane Industry Revenue (billion) Forecast, by Application 2020 & 2033
- Table 22: United Kingdom Chloromethane Industry Revenue (billion) Forecast, by Application 2020 & 2033
- Table 23: Italy Chloromethane Industry Revenue (billion) Forecast, by Application 2020 & 2033
- Table 24: France Chloromethane Industry Revenue (billion) Forecast, by Application 2020 & 2033
- Table 25: Rest of Europe Chloromethane Industry Revenue (billion) Forecast, by Application 2020 & 2033
- Table 26: Global Chloromethane Industry Revenue billion Forecast, by Product Type 2020 & 2033
- Table 27: Global Chloromethane Industry Revenue billion Forecast, by Application 2020 & 2033
- Table 28: Global Chloromethane Industry Revenue billion Forecast, by Country 2020 & 2033
- Table 29: Brazil Chloromethane Industry Revenue (billion) Forecast, by Application 2020 & 2033
- Table 30: Argentina Chloromethane Industry Revenue (billion) Forecast, by Application 2020 & 2033
- Table 31: Rest of South America Chloromethane Industry Revenue (billion) Forecast, by Application 2020 & 2033
- Table 32: Global Chloromethane Industry Revenue billion Forecast, by Product Type 2020 & 2033
- Table 33: Global Chloromethane Industry Revenue billion Forecast, by Application 2020 & 2033
- Table 34: Global Chloromethane Industry Revenue billion Forecast, by Country 2020 & 2033
- Table 35: Saudi Arabia Chloromethane Industry Revenue (billion) Forecast, by Application 2020 & 2033
- Table 36: South Africa Chloromethane Industry Revenue (billion) Forecast, by Application 2020 & 2033
- Table 37: Rest of Middle East and Africa Chloromethane Industry Revenue (billion) Forecast, by Application 2020 & 2033
Frequently Asked Questions
1. What is the projected Compound Annual Growth Rate (CAGR) of the Chloromethane Industry?
The projected CAGR is approximately 5.2%.
2. Which companies are prominent players in the Chloromethane Industry?
Key companies in the market include Occidental Petroleum Corporation, Tokyo Chemical Industry Co Ltd*List Not Exhaustive, AGC Chemicals, KEM ONE, Nouryon, Merck KGaA, Tokuyama Corporation, The Sanmar Group, Gujarat Alkalies and Chemical Limited, Shin-Etsu Chemical Co Ltd, Gujarat Fluorochemicals Limited.
3. What are the main segments of the Chloromethane Industry?
The market segments include Product Type, Application.
4. Can you provide details about the market size?
The market size is estimated to be USD 6.1 billion as of 2022.
5. What are some drivers contributing to market growth?
Increasing Usage of Silicone in Various End-user Industries; Growing Demand from the Pharmaceutical and Personal Care Industries.
6. What are the notable trends driving market growth?
Increasing Usage of Silicone in Various End-user Industries.
7. Are there any restraints impacting market growth?
Stringent Regulations on Chloromethane; Negative Impact of the COVID-19 Pandemic.
8. Can you provide examples of recent developments in the market?
January 2023: Nouryon, a global leader in specialty chemicals, announced the acquisition of a Poland-based supplier of chelated micronutrients, foliar, and other specialty agricultural solutions. With this acquisition, the company would be able to expand its services and product offerings for customers in the industry,
9. What pricing options are available for accessing the report?
Pricing options include single-user, multi-user, and enterprise licenses priced at USD 4750, USD 5250, and USD 8750 respectively.
10. Is the market size provided in terms of value or volume?
The market size is provided in terms of value, measured in billion.
11. Are there any specific market keywords associated with the report?
Yes, the market keyword associated with the report is "Chloromethane Industry," which aids in identifying and referencing the specific market segment covered.
12. How do I determine which pricing option suits my needs best?
The pricing options vary based on user requirements and access needs. Individual users may opt for single-user licenses, while businesses requiring broader access may choose multi-user or enterprise licenses for cost-effective access to the report.
13. Are there any additional resources or data provided in the Chloromethane Industry report?
While the report offers comprehensive insights, it's advisable to review the specific contents or supplementary materials provided to ascertain if additional resources or data are available.
14. How can I stay updated on further developments or reports in the Chloromethane Industry?
To stay informed about further developments, trends, and reports in the Chloromethane Industry, consider subscribing to industry newsletters, following relevant companies and organizations, or regularly checking reputable industry news sources and publications.
Methodology
Step 1 - Identification of Relevant Samples Size from Population Database


Step 2 - Approaches for Defining Global Market Size (Value, Volume* & Price*)

Note*: In applicable scenarios
Step 3 - Data Sources
Primary Research
- Web Analytics
- Survey Reports
- Research Institute
- Latest Research Reports
- Opinion Leaders
Secondary Research
- Annual Reports
- White Paper
- Latest Press Release
- Industry Association
- Paid Database
- Investor Presentations

Step 4 - Data Triangulation
Involves using different sources of information in order to increase the validity of a study
These sources are likely to be stakeholders in a program - participants, other researchers, program staff, other community members, and so on.
Then we put all data in single framework & apply various statistical tools to find out the dynamic on the market.
During the analysis stage, feedback from the stakeholder groups would be compared to determine areas of agreement as well as areas of divergence