

Key Insights
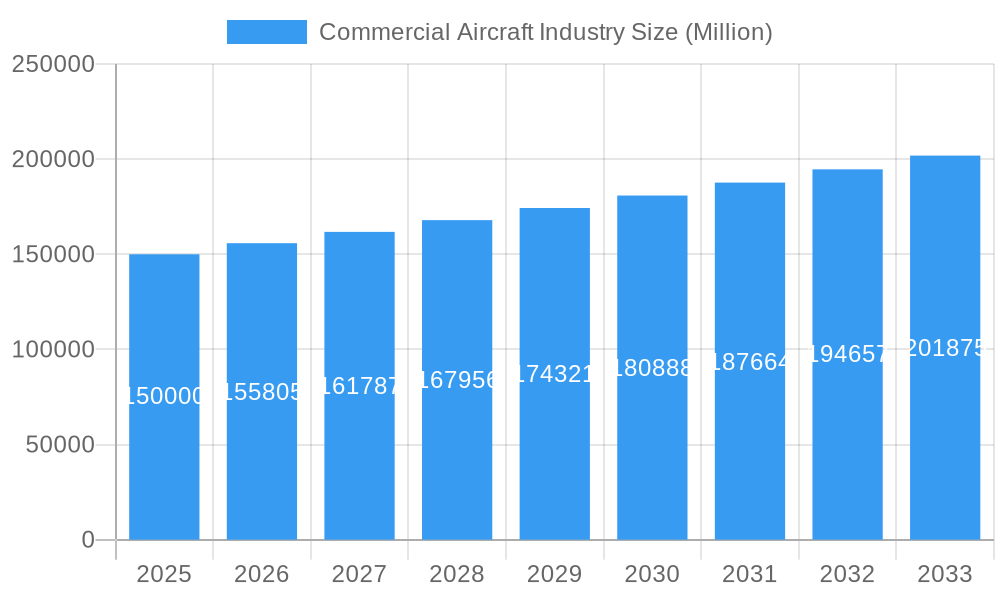
The global commercial aircraft market, projected to reach $233.3 billion by 2033, is poised for substantial expansion, driven by a Compound Annual Growth Rate (CAGR) of 6% from a base year of 2025. This growth is underpinned by escalating global demand for air travel, fueled by expanding middle classes in emerging economies. The continuous retirement and replacement of older aircraft with more fuel-efficient, technologically advanced models are also significant growth catalysts. Airlines are prioritizing operational efficiency and reduced environmental impact, stimulating demand for next-generation aircraft incorporating advanced materials and aerodynamic designs. Furthermore, a trend towards larger, more capable aircraft is enhancing economies of scale for operators. However, market growth may be constrained by global economic volatility and supply chain vulnerabilities affecting critical components and raw materials. Fuel price fluctuations also pose a considerable operational cost, influencing airline investment strategies.
Commercial Aircraft Industry Market Size (In Billion)
Market segmentation highlights the prominence of both freighter and passenger aircraft. Leading manufacturers such as Boeing, Airbus, Embraer, and COMAC continue to shape the competitive landscape through innovation and strategic alliances. Regional growth disparities are expected, with the Asia-Pacific region anticipated to outpace mature markets in North America and Europe due to robust air travel demand. The aviation industry's increasing emphasis on sustainability will likely drive future technological advancements and influence regulatory frameworks, thereby impacting long-term industry trajectories. The sector's outlook remains optimistic, supported by the enduring necessity of air connectivity, though its trajectory will be shaped by the industry's adeptness in overcoming economic and technological hurdles.
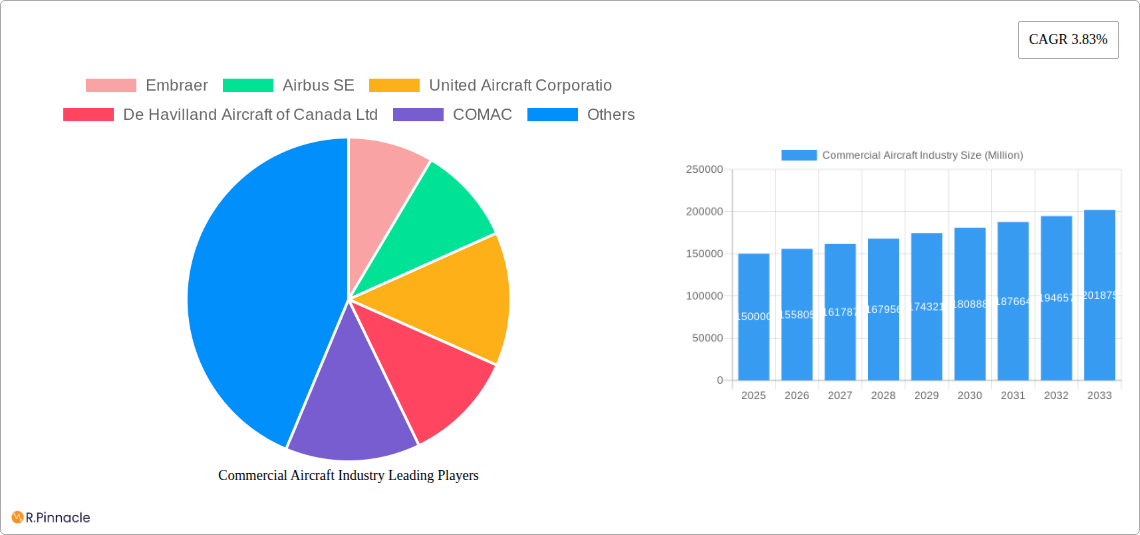
Commercial Aircraft Industry Company Market Share
Commercial Aircraft Industry Report: 2019-2033 Forecast
This comprehensive report provides an in-depth analysis of the Commercial Aircraft Industry, offering invaluable insights for industry professionals, investors, and strategic decision-makers. With a study period spanning 2019-2033, a base year of 2025, and a forecast period of 2025-2033, this report leverages historical data (2019-2024) to project future market trends and opportunities. The report delves into market structure, dynamics, leading players, and key developments, providing actionable intelligence for navigating this dynamic sector. The projected market size for 2025 is estimated at xx Million.
Commercial Aircraft Industry Market Structure & Innovation Trends
The commercial aircraft industry is characterized by high capital expenditure and a relatively concentrated market structure. Boeing and Airbus hold the lion's share of the global market, commanding approximately xx% and xx% respectively, in 2025. Other significant players like Embraer, COMAC, and United Aircraft Corporation contribute to the remaining market share. The industry is driven by continuous innovation, with a focus on fuel efficiency, advanced materials, and enhanced passenger experience. Stringent regulatory frameworks, particularly concerning safety and emissions, significantly influence industry practices. Product substitutes, while limited, include high-speed rail for shorter routes. The end-user demographics are largely focused on airlines, with leasing companies playing a crucial role. M&A activity has been substantial, with notable transactions totaling xx Million in the past five years, driven by consolidation and the pursuit of technological synergies.
- Market Share (2025): Boeing (xx%), Airbus (xx%), Embraer (xx%), COMAC (xx%), Others (xx%)
- M&A Deal Value (2019-2024): xx Million
- Key Innovation Drivers: Fuel efficiency, advanced materials (composites, titanium alloys), enhanced passenger experience (in-flight entertainment, connectivity), automation, and sustainability initiatives.
Commercial Aircraft Industry Market Dynamics & Trends
The commercial aircraft market is experiencing robust growth driven by increasing air passenger traffic, particularly in emerging economies. The Compound Annual Growth Rate (CAGR) from 2025 to 2033 is projected to be xx%. This growth is fueled by factors such as rising disposable incomes, expanding middle classes, and the growth of low-cost carriers. However, challenges such as fluctuating fuel prices, geopolitical instability, and the impact of pandemics can influence market growth. Technological disruptions, including the rise of electric and hydrogen-powered aircraft, present both opportunities and challenges for established players. Consumer preferences are shifting towards fuel-efficient, technologically advanced, and environmentally friendly aircraft. Intense competition among manufacturers is forcing continuous innovation and cost optimization. Market penetration of new technologies is gradually increasing, with xx% adoption rate projected for a certain new technology by 2033.
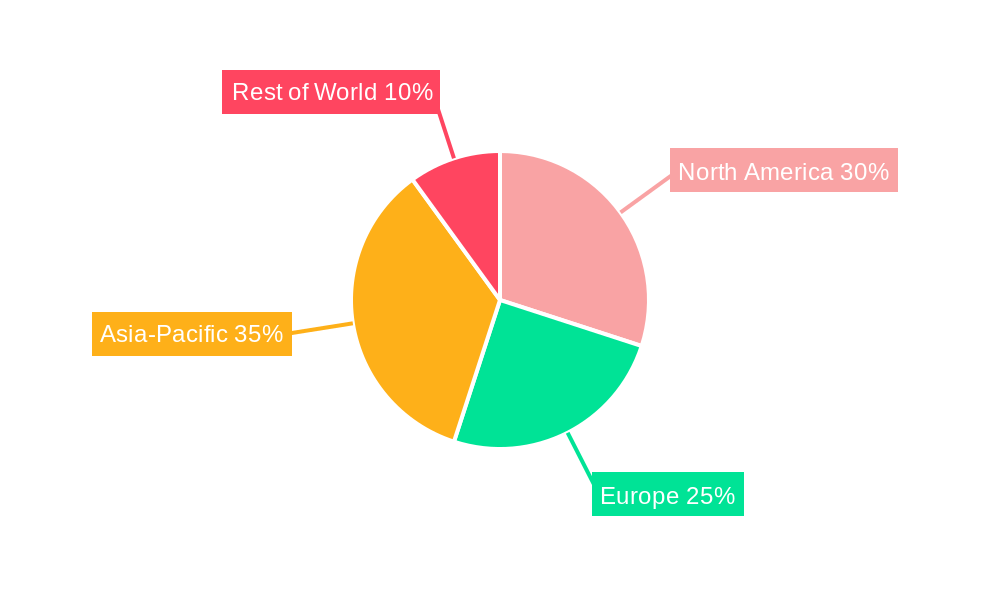
Dominant Regions & Segments in Commercial Aircraft Industry
The Asia-Pacific region is expected to be the dominant market for commercial aircraft, driven by rapid economic growth, expanding air travel infrastructure, and a surge in domestic and international air passenger traffic. Within sub-aircraft types:
Passenger Aircraft: This segment dominates the market, with a projected market size of xx Million in 2025, driven by the continuous growth in passenger air travel. Key drivers include the expansion of low-cost carriers, increased tourism, and rising business travel.
Freighter Aircraft: The freighter aircraft segment is experiencing moderate growth, driven by the expansion of e-commerce and the growth of global trade. The market size in 2025 is projected to be xx Million.
Key Drivers for Asia-Pacific Dominance: Rapid economic growth, expanding middle class, significant investments in airport infrastructure, government support for aviation development, and increasing air travel demand.
Commercial Aircraft Industry Product Innovations
Recent innovations focus on enhanced fuel efficiency through aerodynamic improvements and lighter materials, improved passenger comfort, and advanced avionics systems for improved safety and operational efficiency. These innovations cater to the increasing demand for sustainable and technologically advanced aircraft, offering competitive advantages to manufacturers. The integration of advanced technologies like AI and machine learning is transforming aircraft design, maintenance, and operations.
Report Scope & Segmentation Analysis
This report segments the commercial aircraft market by aircraft type (Passenger Aircraft, Freighter Aircraft) and by geography. The passenger aircraft segment is further segmented by aircraft size (narrow-body, wide-body). The freighter aircraft segment is categorized by payload capacity. Each segment includes analysis of market size, growth projections, and competitive dynamics. Growth projections vary based on the factors influencing that specific aircraft segment. The competitive landscape in each segment is analyzed to highlight the key players and their market share.
Key Drivers of Commercial Aircraft Industry Growth
Several factors drive the growth of the commercial aircraft industry, including:
- Rising Air Passenger Traffic: Globally, air travel continues to grow, driven by increasing disposable incomes and tourism.
- Technological Advancements: Innovations in fuel efficiency, aerodynamics, and materials are reducing operating costs and improving performance.
- Economic Growth in Emerging Markets: Rapid economic growth in many developing countries is fueling demand for air travel.
Challenges in the Commercial Aircraft Industry Sector
The commercial aircraft industry faces numerous challenges including:
- Supply Chain Disruptions: Global supply chain issues can impact production timelines and costs.
- High Capital Expenditure: The development and production of commercial aircraft require significant investments.
- Environmental Regulations: Stringent environmental regulations necessitate continuous innovation to reduce emissions. These factors can significantly impact production costs and delivery times.
Emerging Opportunities in Commercial Aircraft Industry
The industry presents several exciting opportunities, including:
- Sustainable Aviation Fuels (SAFs): The increasing focus on sustainability presents opportunities for the development and adoption of SAFs.
- Electric and Hydrogen Aircraft: The potential for electric and hydrogen-powered aircraft offers long-term growth opportunities.
- Advanced Air Mobility (AAM): The development of urban air mobility solutions offers potential for new markets and growth.
Leading Players in the Commercial Aircraft Industry Market
- Embraer
- Airbus SE
- United Aircraft Corporation
- De Havilland Aircraft of Canada Ltd
- COMAC
- ATR
- The Boeing Company
Key Developments in Commercial Aircraft Industry
- June 2023: Boeing received orders for 40 737 Max 8s from Avolon, demonstrating continued demand for narrow-body aircraft.
- June 2023: Air Algérie signed a contract for seven wide-body aircraft, signaling investment in expanding its fleet and international routes.
- June 2023: Delta Air Lines is in talks with Airbus for a significant order of A350 and A330neo aircraft, illustrating the ongoing demand for large passenger aircraft and potential for major deal closures.
Future Outlook for Commercial Aircraft Industry Market
The commercial aircraft industry is poised for continued growth, driven by increasing air passenger traffic, technological advancements, and economic growth in emerging markets. The focus on sustainability and the development of new technologies will shape the future of the industry, creating opportunities for innovation and expansion. Strategic partnerships and collaborations will play a vital role in navigating the challenges and capitalizing on the emerging opportunities.
Commercial Aircraft Industry Segmentation
-
1. Sub Aircraft Type
- 1.1. Freighter Aircraft
-
1.2. Passenger Aircraft
- 1.2.1. Narrowbody Aircraft
- 1.2.2. Widebody Aircraft
Commercial Aircraft Industry Segmentation By Geography
-
1. North America
- 1.1. United States
- 1.2. Canada
- 1.3. Mexico
-
2. South America
- 2.1. Brazil
- 2.2. Argentina
- 2.3. Rest of South America
-
3. Europe
- 3.1. United Kingdom
- 3.2. Germany
- 3.3. France
- 3.4. Italy
- 3.5. Spain
- 3.6. Russia
- 3.7. Benelux
- 3.8. Nordics
- 3.9. Rest of Europe
-
4. Middle East & Africa
- 4.1. Turkey
- 4.2. Israel
- 4.3. GCC
- 4.4. North Africa
- 4.5. South Africa
- 4.6. Rest of Middle East & Africa
-
5. Asia Pacific
- 5.1. China
- 5.2. India
- 5.3. Japan
- 5.4. South Korea
- 5.5. ASEAN
- 5.6. Oceania
- 5.7. Rest of Asia Pacific
Commercial Aircraft Industry Regional Market Share
Geographic Coverage of Commercial Aircraft Industry
Commercial Aircraft Industry REPORT HIGHLIGHTS
| Aspects | Details |
|---|---|
| Study Period | 2020-2034 |
| Base Year | 2025 |
| Estimated Year | 2026 |
| Forecast Period | 2026-2034 |
| Historical Period | 2020-2025 |
| Growth Rate | CAGR of 6% from 2020-2034 |
| Segmentation |
|
Table of Contents
- 1. Introduction
- 1.1. Research Scope
- 1.2. Market Segmentation
- 1.3. Research Objective
- 1.4. Definitions and Assumptions
- 2. Executive Summary
- 2.1. Market Snapshot
- 3. Market Dynamics
- 3.1. Market Drivers
- 3.2. Market Restrains
- 3.3. Market Trends
- 3.4. Market Opportunities
- 4. Market Factor Analysis
- 4.1. Porters Five Forces
- 4.1.1. Bargaining Power of Suppliers
- 4.1.2. Bargaining Power of Buyers
- 4.1.3. Threat of New Entrants
- 4.1.4. Threat of Substitutes
- 4.1.5. Competitive Rivalry
- 4.2. PESTEL analysis
- 4.3. BCG Analysis
- 4.3.1. Stars (High Growth, High Market Share)
- 4.3.2. Cash Cows (Low Growth, High Market Share)
- 4.3.3. Question Mark (High Growth, Low Market Share)
- 4.3.4. Dogs (Low Growth, Low Market Share)
- 4.4. Ansoff Matrix Analysis
- 4.5. Supply Chain Analysis
- 4.6. Regulatory Landscape
- 4.7. Current Market Potential and Opportunity Assessment (TAM–SAM–SOM Framework)
- 4.8. PRI Analyst Note
- 4.1. Porters Five Forces
- 5. Market Analysis, Insights and Forecast 2021-2033
- 5.1. Market Analysis, Insights and Forecast - by Sub Aircraft Type
- 5.1.1. Freighter Aircraft
- 5.1.2. Passenger Aircraft
- 5.1.2.1. Narrowbody Aircraft
- 5.1.2.2. Widebody Aircraft
- 5.2. Market Analysis, Insights and Forecast - by Region
- 5.2.1. North America
- 5.2.2. South America
- 5.2.3. Europe
- 5.2.4. Middle East & Africa
- 5.2.5. Asia Pacific
- 5.1. Market Analysis, Insights and Forecast - by Sub Aircraft Type
- 6. Global Commercial Aircraft Industry Analysis, Insights and Forecast, 2021-2033
- 6.1. Market Analysis, Insights and Forecast - by Sub Aircraft Type
- 6.1.1. Freighter Aircraft
- 6.1.2. Passenger Aircraft
- 6.1.2.1. Narrowbody Aircraft
- 6.1.2.2. Widebody Aircraft
- 6.1. Market Analysis, Insights and Forecast - by Sub Aircraft Type
- 7. North America Commercial Aircraft Industry Analysis, Insights and Forecast, 2020-2032
- 7.1. Market Analysis, Insights and Forecast - by Sub Aircraft Type
- 7.1.1. Freighter Aircraft
- 7.1.2. Passenger Aircraft
- 7.1.2.1. Narrowbody Aircraft
- 7.1.2.2. Widebody Aircraft
- 7.1. Market Analysis, Insights and Forecast - by Sub Aircraft Type
- 8. South America Commercial Aircraft Industry Analysis, Insights and Forecast, 2020-2032
- 8.1. Market Analysis, Insights and Forecast - by Sub Aircraft Type
- 8.1.1. Freighter Aircraft
- 8.1.2. Passenger Aircraft
- 8.1.2.1. Narrowbody Aircraft
- 8.1.2.2. Widebody Aircraft
- 8.1. Market Analysis, Insights and Forecast - by Sub Aircraft Type
- 9. Europe Commercial Aircraft Industry Analysis, Insights and Forecast, 2020-2032
- 9.1. Market Analysis, Insights and Forecast - by Sub Aircraft Type
- 9.1.1. Freighter Aircraft
- 9.1.2. Passenger Aircraft
- 9.1.2.1. Narrowbody Aircraft
- 9.1.2.2. Widebody Aircraft
- 9.1. Market Analysis, Insights and Forecast - by Sub Aircraft Type
- 10. Middle East & Africa Commercial Aircraft Industry Analysis, Insights and Forecast, 2020-2032
- 10.1. Market Analysis, Insights and Forecast - by Sub Aircraft Type
- 10.1.1. Freighter Aircraft
- 10.1.2. Passenger Aircraft
- 10.1.2.1. Narrowbody Aircraft
- 10.1.2.2. Widebody Aircraft
- 10.1. Market Analysis, Insights and Forecast - by Sub Aircraft Type
- 11. Asia Pacific Commercial Aircraft Industry Analysis, Insights and Forecast, 2020-2032
- 11.1. Market Analysis, Insights and Forecast - by Sub Aircraft Type
- 11.1.1. Freighter Aircraft
- 11.1.2. Passenger Aircraft
- 11.1.2.1. Narrowbody Aircraft
- 11.1.2.2. Widebody Aircraft
- 11.1. Market Analysis, Insights and Forecast - by Sub Aircraft Type
- 12. Competitive Analysis
- 12.1. Company Profiles
- 12.1.1 Embraer
- 12.1.1.1. Company Overview
- 12.1.1.2. Products
- 12.1.1.3. Company Financials
- 12.1.1.4. SWOT Analysis
- 12.1.2 Airbus SE
- 12.1.2.1. Company Overview
- 12.1.2.2. Products
- 12.1.2.3. Company Financials
- 12.1.2.4. SWOT Analysis
- 12.1.3 United Aircraft Corporatio
- 12.1.3.1. Company Overview
- 12.1.3.2. Products
- 12.1.3.3. Company Financials
- 12.1.3.4. SWOT Analysis
- 12.1.4 De Havilland Aircraft of Canada Ltd
- 12.1.4.1. Company Overview
- 12.1.4.2. Products
- 12.1.4.3. Company Financials
- 12.1.4.4. SWOT Analysis
- 12.1.5 COMAC
- 12.1.5.1. Company Overview
- 12.1.5.2. Products
- 12.1.5.3. Company Financials
- 12.1.5.4. SWOT Analysis
- 12.1.6 ATR
- 12.1.6.1. Company Overview
- 12.1.6.2. Products
- 12.1.6.3. Company Financials
- 12.1.6.4. SWOT Analysis
- 12.1.7 The Boeing Company
- 12.1.7.1. Company Overview
- 12.1.7.2. Products
- 12.1.7.3. Company Financials
- 12.1.7.4. SWOT Analysis
- 12.1.1 Embraer
- 12.2. Market Entropy
- 12.2.1 Company's Key Areas Served
- 12.2.2 Recent Developments
- 12.3. Company Market Share Analysis 2025
- 12.3.1 Top 5 Companies Market Share Analysis
- 12.3.2 Top 3 Companies Market Share Analysis
- 12.4. List of Potential Customers
- 13. Research Methodology
List of Figures
- Figure 1: Global Commercial Aircraft Industry Revenue Breakdown (billion, %) by Region 2025 & 2033
- Figure 2: North America Commercial Aircraft Industry Revenue (billion), by Sub Aircraft Type 2025 & 2033
- Figure 3: North America Commercial Aircraft Industry Revenue Share (%), by Sub Aircraft Type 2025 & 2033
- Figure 4: North America Commercial Aircraft Industry Revenue (billion), by Country 2025 & 2033
- Figure 5: North America Commercial Aircraft Industry Revenue Share (%), by Country 2025 & 2033
- Figure 6: South America Commercial Aircraft Industry Revenue (billion), by Sub Aircraft Type 2025 & 2033
- Figure 7: South America Commercial Aircraft Industry Revenue Share (%), by Sub Aircraft Type 2025 & 2033
- Figure 8: South America Commercial Aircraft Industry Revenue (billion), by Country 2025 & 2033
- Figure 9: South America Commercial Aircraft Industry Revenue Share (%), by Country 2025 & 2033
- Figure 10: Europe Commercial Aircraft Industry Revenue (billion), by Sub Aircraft Type 2025 & 2033
- Figure 11: Europe Commercial Aircraft Industry Revenue Share (%), by Sub Aircraft Type 2025 & 2033
- Figure 12: Europe Commercial Aircraft Industry Revenue (billion), by Country 2025 & 2033
- Figure 13: Europe Commercial Aircraft Industry Revenue Share (%), by Country 2025 & 2033
- Figure 14: Middle East & Africa Commercial Aircraft Industry Revenue (billion), by Sub Aircraft Type 2025 & 2033
- Figure 15: Middle East & Africa Commercial Aircraft Industry Revenue Share (%), by Sub Aircraft Type 2025 & 2033
- Figure 16: Middle East & Africa Commercial Aircraft Industry Revenue (billion), by Country 2025 & 2033
- Figure 17: Middle East & Africa Commercial Aircraft Industry Revenue Share (%), by Country 2025 & 2033
- Figure 18: Asia Pacific Commercial Aircraft Industry Revenue (billion), by Sub Aircraft Type 2025 & 2033
- Figure 19: Asia Pacific Commercial Aircraft Industry Revenue Share (%), by Sub Aircraft Type 2025 & 2033
- Figure 20: Asia Pacific Commercial Aircraft Industry Revenue (billion), by Country 2025 & 2033
- Figure 21: Asia Pacific Commercial Aircraft Industry Revenue Share (%), by Country 2025 & 2033
List of Tables
- Table 1: Global Commercial Aircraft Industry Revenue billion Forecast, by Sub Aircraft Type 2020 & 2033
- Table 2: Global Commercial Aircraft Industry Revenue billion Forecast, by Region 2020 & 2033
- Table 3: Global Commercial Aircraft Industry Revenue billion Forecast, by Sub Aircraft Type 2020 & 2033
- Table 4: Global Commercial Aircraft Industry Revenue billion Forecast, by Country 2020 & 2033
- Table 5: United States Commercial Aircraft Industry Revenue (billion) Forecast, by Application 2020 & 2033
- Table 6: Canada Commercial Aircraft Industry Revenue (billion) Forecast, by Application 2020 & 2033
- Table 7: Mexico Commercial Aircraft Industry Revenue (billion) Forecast, by Application 2020 & 2033
- Table 8: Global Commercial Aircraft Industry Revenue billion Forecast, by Sub Aircraft Type 2020 & 2033
- Table 9: Global Commercial Aircraft Industry Revenue billion Forecast, by Country 2020 & 2033
- Table 10: Brazil Commercial Aircraft Industry Revenue (billion) Forecast, by Application 2020 & 2033
- Table 11: Argentina Commercial Aircraft Industry Revenue (billion) Forecast, by Application 2020 & 2033
- Table 12: Rest of South America Commercial Aircraft Industry Revenue (billion) Forecast, by Application 2020 & 2033
- Table 13: Global Commercial Aircraft Industry Revenue billion Forecast, by Sub Aircraft Type 2020 & 2033
- Table 14: Global Commercial Aircraft Industry Revenue billion Forecast, by Country 2020 & 2033
- Table 15: United Kingdom Commercial Aircraft Industry Revenue (billion) Forecast, by Application 2020 & 2033
- Table 16: Germany Commercial Aircraft Industry Revenue (billion) Forecast, by Application 2020 & 2033
- Table 17: France Commercial Aircraft Industry Revenue (billion) Forecast, by Application 2020 & 2033
- Table 18: Italy Commercial Aircraft Industry Revenue (billion) Forecast, by Application 2020 & 2033
- Table 19: Spain Commercial Aircraft Industry Revenue (billion) Forecast, by Application 2020 & 2033
- Table 20: Russia Commercial Aircraft Industry Revenue (billion) Forecast, by Application 2020 & 2033
- Table 21: Benelux Commercial Aircraft Industry Revenue (billion) Forecast, by Application 2020 & 2033
- Table 22: Nordics Commercial Aircraft Industry Revenue (billion) Forecast, by Application 2020 & 2033
- Table 23: Rest of Europe Commercial Aircraft Industry Revenue (billion) Forecast, by Application 2020 & 2033
- Table 24: Global Commercial Aircraft Industry Revenue billion Forecast, by Sub Aircraft Type 2020 & 2033
- Table 25: Global Commercial Aircraft Industry Revenue billion Forecast, by Country 2020 & 2033
- Table 26: Turkey Commercial Aircraft Industry Revenue (billion) Forecast, by Application 2020 & 2033
- Table 27: Israel Commercial Aircraft Industry Revenue (billion) Forecast, by Application 2020 & 2033
- Table 28: GCC Commercial Aircraft Industry Revenue (billion) Forecast, by Application 2020 & 2033
- Table 29: North Africa Commercial Aircraft Industry Revenue (billion) Forecast, by Application 2020 & 2033
- Table 30: South Africa Commercial Aircraft Industry Revenue (billion) Forecast, by Application 2020 & 2033
- Table 31: Rest of Middle East & Africa Commercial Aircraft Industry Revenue (billion) Forecast, by Application 2020 & 2033
- Table 32: Global Commercial Aircraft Industry Revenue billion Forecast, by Sub Aircraft Type 2020 & 2033
- Table 33: Global Commercial Aircraft Industry Revenue billion Forecast, by Country 2020 & 2033
- Table 34: China Commercial Aircraft Industry Revenue (billion) Forecast, by Application 2020 & 2033
- Table 35: India Commercial Aircraft Industry Revenue (billion) Forecast, by Application 2020 & 2033
- Table 36: Japan Commercial Aircraft Industry Revenue (billion) Forecast, by Application 2020 & 2033
- Table 37: South Korea Commercial Aircraft Industry Revenue (billion) Forecast, by Application 2020 & 2033
- Table 38: ASEAN Commercial Aircraft Industry Revenue (billion) Forecast, by Application 2020 & 2033
- Table 39: Oceania Commercial Aircraft Industry Revenue (billion) Forecast, by Application 2020 & 2033
- Table 40: Rest of Asia Pacific Commercial Aircraft Industry Revenue (billion) Forecast, by Application 2020 & 2033
Frequently Asked Questions
1. What is the projected Compound Annual Growth Rate (CAGR) of the Commercial Aircraft Industry?
The projected CAGR is approximately 6%.
2. Which companies are prominent players in the Commercial Aircraft Industry?
Key companies in the market include Embraer, Airbus SE, United Aircraft Corporatio, De Havilland Aircraft of Canada Ltd, COMAC, ATR, The Boeing Company.
3. What are the main segments of the Commercial Aircraft Industry?
The market segments include Sub Aircraft Type.
4. Can you provide details about the market size?
The market size is estimated to be USD 233.3 billion as of 2022.
5. What are some drivers contributing to market growth?
N/A
6. What are the notable trends driving market growth?
OTHER KEY INDUSTRY TRENDS COVERED IN THE REPORT.
7. Are there any restraints impacting market growth?
N/A
8. Can you provide examples of recent developments in the market?
June 2023: Boeing received solid 40 737 Max 8s orders from Irish aircraft leasing company Avolon.June 2023: Air Algérie, the national airline of Algeria, signed a contract to purchase seven wide-body aircraft to support commercial development.June 2023: Delta Air Lines Inc. is in talks with Airbus SE (AIR.PA) for a jumbo jet order. Orders include both A350 and A330neo dual-aisle.
9. What pricing options are available for accessing the report?
Pricing options include single-user, multi-user, and enterprise licenses priced at USD 3800, USD 4500, and USD 5800 respectively.
10. Is the market size provided in terms of value or volume?
The market size is provided in terms of value, measured in billion.
11. Are there any specific market keywords associated with the report?
Yes, the market keyword associated with the report is "Commercial Aircraft Industry," which aids in identifying and referencing the specific market segment covered.
12. How do I determine which pricing option suits my needs best?
The pricing options vary based on user requirements and access needs. Individual users may opt for single-user licenses, while businesses requiring broader access may choose multi-user or enterprise licenses for cost-effective access to the report.
13. Are there any additional resources or data provided in the Commercial Aircraft Industry report?
While the report offers comprehensive insights, it's advisable to review the specific contents or supplementary materials provided to ascertain if additional resources or data are available.
14. How can I stay updated on further developments or reports in the Commercial Aircraft Industry?
To stay informed about further developments, trends, and reports in the Commercial Aircraft Industry, consider subscribing to industry newsletters, following relevant companies and organizations, or regularly checking reputable industry news sources and publications.
Methodology
Step 1 - Identification of Relevant Samples Size from Population Database


Step 2 - Approaches for Defining Global Market Size (Value, Volume* & Price*)

Note*: In applicable scenarios
Step 3 - Data Sources
Primary Research
- Web Analytics
- Survey Reports
- Research Institute
- Latest Research Reports
- Opinion Leaders
Secondary Research
- Annual Reports
- White Paper
- Latest Press Release
- Industry Association
- Paid Database
- Investor Presentations

Step 4 - Data Triangulation
Involves using different sources of information in order to increase the validity of a study
These sources are likely to be stakeholders in a program - participants, other researchers, program staff, other community members, and so on.
Then we put all data in single framework & apply various statistical tools to find out the dynamic on the market.
During the analysis stage, feedback from the stakeholder groups would be compared to determine areas of agreement as well as areas of divergence