

Key Insights
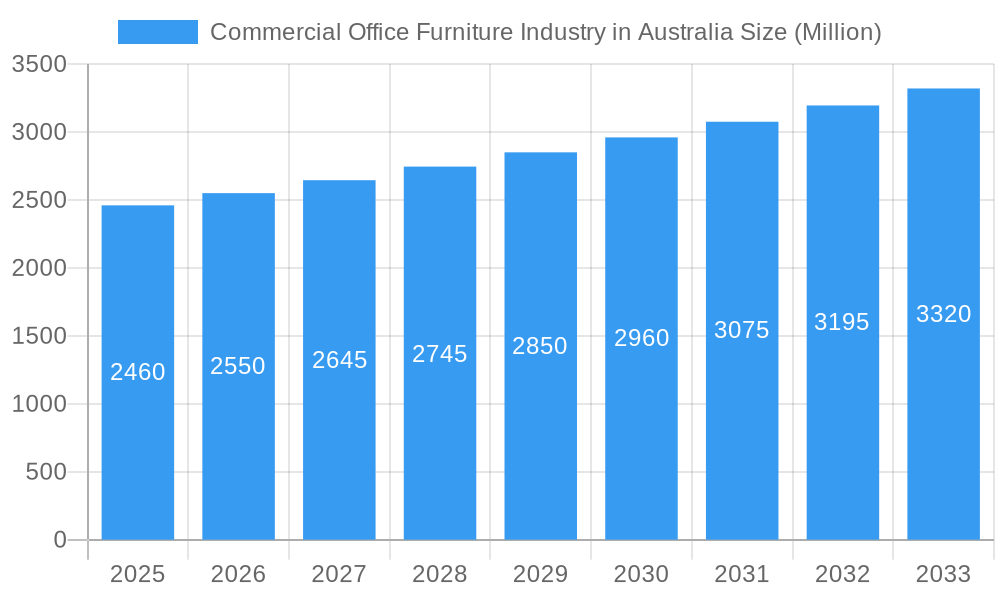
The Australian commercial office furniture market, valued at $2.46 billion in 2025, is projected to experience steady growth, exhibiting a Compound Annual Growth Rate (CAGR) of 3.54% from 2025 to 2033. This growth is driven by several key factors. Firstly, a recovering economy and increasing investments in commercial real estate are fueling demand for modern and functional office spaces. Secondly, the ongoing shift towards hybrid work models necessitates adaptable furniture solutions, boosting sales of ergonomic chairs, adjustable desks, and modular storage units. Furthermore, a growing focus on employee wellbeing and productivity is driving demand for high-quality, ergonomic furniture designed to enhance comfort and efficiency. However, potential restraints include fluctuations in raw material prices (particularly timber and metal) and global supply chain disruptions which could impact production and delivery times. The market is segmented by material (wood, metal, plastic, others), product type (seating, storage, tables, others), and distribution channel (offline, online). The strong presence of both established players like Advanta, Krost Business Furniture, and Fursys, alongside emerging local brands, indicates a competitive landscape with opportunities for both large-scale manufacturers and niche players catering to specific design aesthetics or ergonomic needs. The online channel is gaining traction, offering consumers wider choices and convenient purchasing options, though offline showrooms remain crucial for large orders and customized solutions.
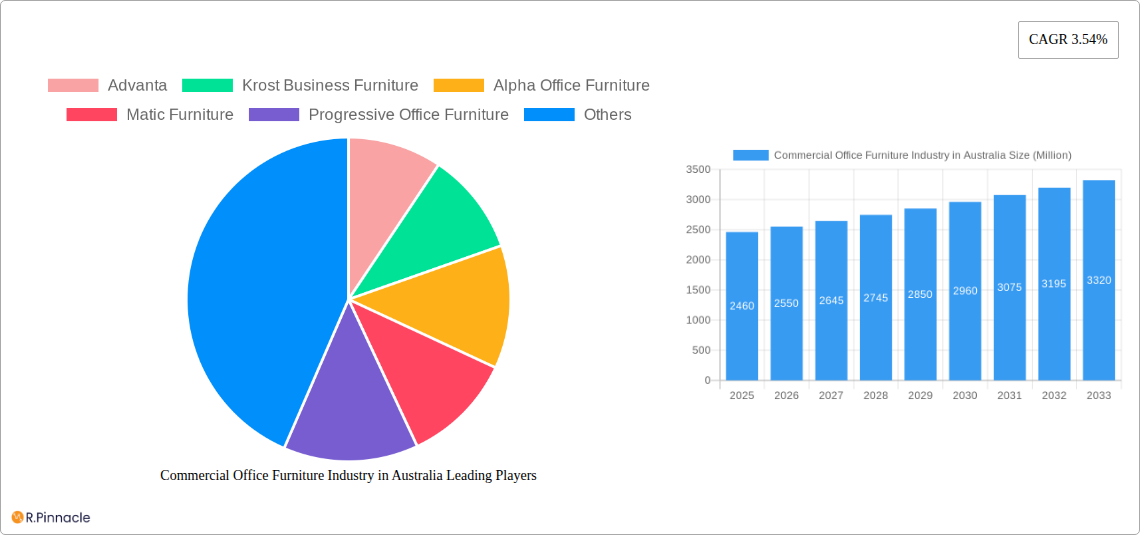
Commercial Office Furniture Industry in Australia Market Size (In Billion)
The forecast period (2025-2033) suggests continued expansion for the Australian commercial office furniture sector, fueled by economic growth, evolving work styles, and the increasing emphasis on creating productive and employee-centric workspaces. While challenges exist in navigating global supply chain dynamics and price volatility, the market's inherent resilience and adaptation to changing workplace needs position it for sustained growth in the coming years. Further segmentation analysis would reveal insights into specific product categories performing exceptionally well and identifying potential future market niches. For example, the “others” segment in both product and materials needs further breakdown to fully appreciate the dynamism of this industry.
Commercial Office Furniture Industry in Australia Company Market Share
Commercial Office Furniture Industry in Australia: 2019-2033 Market Report
This comprehensive report provides an in-depth analysis of the Australian commercial office furniture market, offering crucial insights for industry professionals, investors, and strategic planners. The study period covers 2019-2033, with a base year of 2025 and a forecast period of 2025-2033. The report meticulously examines market size, segmentation, growth drivers, challenges, and emerging opportunities, providing a 360° view of this dynamic sector. Projected market value exceeds $XX Million by 2033.
Commercial Office Furniture Industry in Australia Market Structure & Innovation Trends
This section analyzes the competitive landscape, innovation drivers, and regulatory influences shaping the Australian commercial office furniture market. The market is moderately concentrated, with key players like Advanta, Krost Business Furniture, and Alpha Office Furniture holding significant market share, estimated at a combined xx% in 2025. Innovation is driven by evolving workplace designs, sustainability concerns, and technological advancements in ergonomics and smart office solutions. Regulatory frameworks, including building codes and safety standards, significantly impact product design and manufacturing. Product substitution is observed with the increasing adoption of modular and adaptable furniture systems. End-user demographics are shifting towards a preference for flexible and collaborative workspaces. M&A activity in the sector has been moderate, with deal values averaging $xx Million in the past five years.
- Market Concentration: Moderately concentrated, with top 3 players holding xx% market share in 2025.
- Innovation Drivers: Sustainable materials, ergonomic designs, smart office technology.
- Regulatory Framework: Building codes, safety standards, and environmental regulations.
- Product Substitutes: Modular furniture systems, adaptable workspaces.
- End-User Demographics: Shift towards flexible and collaborative workspaces.
- M&A Activity: Moderate activity, with average deal values of $xx Million.
Commercial Office Furniture Industry in Australia Market Dynamics & Trends
The Australian commercial office furniture market exhibits robust growth, driven by factors such as increasing urbanization, economic expansion, and the growing adoption of hybrid work models. The market is experiencing technological disruption with the integration of smart technologies into furniture design and the rise of e-commerce in the distribution channel. Consumer preferences are increasingly focused on ergonomic designs, sustainable materials, and adaptable furniture solutions. Competitive dynamics are shaped by pricing strategies, product differentiation, and brand building. The CAGR for the period 2025-2033 is estimated at xx%, with market penetration of ergonomic furniture expected to reach xx% by 2033.
Dominant Regions & Segments in Commercial Office Furniture Industry in Australia
The major cities in Australia, including Sydney, Melbourne, and Brisbane, dominate the commercial office furniture market due to high office space occupancy and strong economic activity. Within product segments, seating (particularly office chairs) holds the largest market share, followed by storage units and tables. Wood remains a dominant material, followed by metal and other materials. Offline distribution channels still predominate, but online sales are growing rapidly.
- Key Drivers for Dominant Regions:
- Strong economic activity
- High office space occupancy
- Concentration of businesses and corporations
- Key Drivers for Dominant Segments:
- Growing demand for ergonomic seating solutions
- Increasing need for efficient storage in modern workplaces
- Preference for versatile and functional table designs.
- Dominant Material: Wood.
- Dominant Product: Seating (Office Chairs).
- Dominant Distribution Channel: Offline.
Commercial Office Furniture Industry in Australia Product Innovations
Recent innovations focus on ergonomic designs that enhance employee well-being, sustainable materials reducing environmental impact, and smart furniture integrating technology for increased productivity and flexibility. Modular and adaptable furniture systems are gaining popularity, allowing for easy reconfiguration of workspaces to meet evolving needs. These innovations cater to the growing demand for flexible and efficient work environments, offering a competitive advantage to manufacturers.
Report Scope & Segmentation Analysis
The report segments the Australian commercial office furniture market by material (wood, metal, plastic, other), product (seating, storage units, tables, others), and distribution channel (offline, online). Each segment is analyzed in terms of market size, growth projections, and competitive dynamics. For instance, the seating segment is expected to experience significant growth due to increasing demand for ergonomic chairs, while the online distribution channel is projected to witness rapid expansion driven by e-commerce penetration.
Key Drivers of Commercial Office Furniture Industry in Australia Growth
Key growth drivers include increasing urbanization, strong economic growth, rising demand for ergonomic and sustainable furniture, the adoption of hybrid work models leading to increased demand for adaptable furniture, and government initiatives promoting sustainable business practices.
Challenges in the Commercial Office Furniture Industry in Australia Sector
Challenges include fluctuating raw material prices, increasing labor costs, intense competition, supply chain disruptions impacting timely delivery, and the need to comply with stringent environmental regulations.
Emerging Opportunities in Commercial Office Furniture Industry in Australia
Emerging opportunities lie in the growing demand for smart office solutions, sustainable and eco-friendly furniture, modular and adaptable furniture systems catering to flexible workspaces, and the expansion of the online distribution channel.
Leading Players in the Commercial Office Furniture Industry in Australia Market
- Advanta
- Krost Business Furniture
- Alpha Office Furniture
- Matic Furniture
- Progressive Office Furniture
- AMS Furniture
- Aspen Commercial Interiors
- Emanate Design
- Diami
- Burgtec
- Fursys
- BFX Furniture
Key Developments in Commercial Office Furniture Industry in Australia Industry
- 2022 Q4: Launch of a new range of ergonomic chairs by Advanta.
- 2023 Q1: Merger between two smaller furniture manufacturers, resulting in increased market share.
- 2023 Q3: Alpha Office Furniture expands its online retail presence.
Future Outlook for Commercial Office Furniture Industry in Australia Market
The Australian commercial office furniture market is poised for continued growth, driven by ongoing urbanization, economic expansion, and the increasing adoption of flexible and hybrid work models. Strategic opportunities lie in focusing on sustainable products, integrating smart technologies, and expanding online distribution channels to cater to evolving consumer preferences and workplace trends.
Commercial Office Furniture Industry in Australia Segmentation
-
1. Material
- 1.1. Wood
- 1.2. Metal
- 1.3. Plastic
- 1.4. Other Materials
-
2. Product
- 2.1. Seating
- 2.2. Storage Units (Bins & Shelves, Cabinets, Others)
- 2.3. Tables (
-
3. Distribution Channel
- 3.1. Offline
- 3.2. Online
Commercial Office Furniture Industry in Australia Segmentation By Geography
-
1. North America
- 1.1. United States
- 1.2. Canada
- 1.3. Mexico
-
2. South America
- 2.1. Brazil
- 2.2. Argentina
- 2.3. Rest of South America
-
3. Europe
- 3.1. United Kingdom
- 3.2. Germany
- 3.3. France
- 3.4. Italy
- 3.5. Spain
- 3.6. Russia
- 3.7. Benelux
- 3.8. Nordics
- 3.9. Rest of Europe
-
4. Middle East & Africa
- 4.1. Turkey
- 4.2. Israel
- 4.3. GCC
- 4.4. North Africa
- 4.5. South Africa
- 4.6. Rest of Middle East & Africa
-
5. Asia Pacific
- 5.1. China
- 5.2. India
- 5.3. Japan
- 5.4. South Korea
- 5.5. ASEAN
- 5.6. Oceania
- 5.7. Rest of Asia Pacific
Commercial Office Furniture Industry in Australia Regional Market Share
Geographic Coverage of Commercial Office Furniture Industry in Australia
Commercial Office Furniture Industry in Australia REPORT HIGHLIGHTS
| Aspects | Details |
|---|---|
| Study Period | 2020-2034 |
| Base Year | 2025 |
| Estimated Year | 2026 |
| Forecast Period | 2026-2034 |
| Historical Period | 2020-2025 |
| Growth Rate | CAGR of 3.54% from 2020-2034 |
| Segmentation |
|
Table of Contents
- 1. Introduction
- 1.1. Research Scope
- 1.2. Market Segmentation
- 1.3. Research Objective
- 1.4. Definitions and Assumptions
- 2. Executive Summary
- 2.1. Market Snapshot
- 3. Market Dynamics
- 3.1. Market Drivers
- 3.2. Market Restrains
- 3.3. Market Trends
- 3.4. Market Opportunities
- 4. Market Factor Analysis
- 4.1. Porters Five Forces
- 4.1.1. Bargaining Power of Suppliers
- 4.1.2. Bargaining Power of Buyers
- 4.1.3. Threat of New Entrants
- 4.1.4. Threat of Substitutes
- 4.1.5. Competitive Rivalry
- 4.2. PESTEL analysis
- 4.3. BCG Analysis
- 4.3.1. Stars (High Growth, High Market Share)
- 4.3.2. Cash Cows (Low Growth, High Market Share)
- 4.3.3. Question Mark (High Growth, Low Market Share)
- 4.3.4. Dogs (Low Growth, Low Market Share)
- 4.4. Ansoff Matrix Analysis
- 4.5. Supply Chain Analysis
- 4.6. Regulatory Landscape
- 4.7. Current Market Potential and Opportunity Assessment (TAM–SAM–SOM Framework)
- 4.8. PRI Analyst Note
- 4.1. Porters Five Forces
- 5. Market Analysis, Insights and Forecast 2021-2033
- 5.1. Market Analysis, Insights and Forecast - by Material
- 5.1.1. Wood
- 5.1.2. Metal
- 5.1.3. Plastic
- 5.1.4. Other Materials
- 5.2. Market Analysis, Insights and Forecast - by Product
- 5.2.1. Seating
- 5.2.2. Storage Units (Bins & Shelves, Cabinets, Others)
- 5.2.3. Tables (
- 5.3. Market Analysis, Insights and Forecast - by Distribution Channel
- 5.3.1. Offline
- 5.3.2. Online
- 5.4. Market Analysis, Insights and Forecast - by Region
- 5.4.1. North America
- 5.4.2. South America
- 5.4.3. Europe
- 5.4.4. Middle East & Africa
- 5.4.5. Asia Pacific
- 5.1. Market Analysis, Insights and Forecast - by Material
- 6. Global Commercial Office Furniture Industry in Australia Analysis, Insights and Forecast, 2021-2033
- 6.1. Market Analysis, Insights and Forecast - by Material
- 6.1.1. Wood
- 6.1.2. Metal
- 6.1.3. Plastic
- 6.1.4. Other Materials
- 6.2. Market Analysis, Insights and Forecast - by Product
- 6.2.1. Seating
- 6.2.2. Storage Units (Bins & Shelves, Cabinets, Others)
- 6.2.3. Tables (
- 6.3. Market Analysis, Insights and Forecast - by Distribution Channel
- 6.3.1. Offline
- 6.3.2. Online
- 6.1. Market Analysis, Insights and Forecast - by Material
- 7. North America Commercial Office Furniture Industry in Australia Analysis, Insights and Forecast, 2020-2032
- 7.1. Market Analysis, Insights and Forecast - by Material
- 7.1.1. Wood
- 7.1.2. Metal
- 7.1.3. Plastic
- 7.1.4. Other Materials
- 7.2. Market Analysis, Insights and Forecast - by Product
- 7.2.1. Seating
- 7.2.2. Storage Units (Bins & Shelves, Cabinets, Others)
- 7.2.3. Tables (
- 7.3. Market Analysis, Insights and Forecast - by Distribution Channel
- 7.3.1. Offline
- 7.3.2. Online
- 7.1. Market Analysis, Insights and Forecast - by Material
- 8. South America Commercial Office Furniture Industry in Australia Analysis, Insights and Forecast, 2020-2032
- 8.1. Market Analysis, Insights and Forecast - by Material
- 8.1.1. Wood
- 8.1.2. Metal
- 8.1.3. Plastic
- 8.1.4. Other Materials
- 8.2. Market Analysis, Insights and Forecast - by Product
- 8.2.1. Seating
- 8.2.2. Storage Units (Bins & Shelves, Cabinets, Others)
- 8.2.3. Tables (
- 8.3. Market Analysis, Insights and Forecast - by Distribution Channel
- 8.3.1. Offline
- 8.3.2. Online
- 8.1. Market Analysis, Insights and Forecast - by Material
- 9. Europe Commercial Office Furniture Industry in Australia Analysis, Insights and Forecast, 2020-2032
- 9.1. Market Analysis, Insights and Forecast - by Material
- 9.1.1. Wood
- 9.1.2. Metal
- 9.1.3. Plastic
- 9.1.4. Other Materials
- 9.2. Market Analysis, Insights and Forecast - by Product
- 9.2.1. Seating
- 9.2.2. Storage Units (Bins & Shelves, Cabinets, Others)
- 9.2.3. Tables (
- 9.3. Market Analysis, Insights and Forecast - by Distribution Channel
- 9.3.1. Offline
- 9.3.2. Online
- 9.1. Market Analysis, Insights and Forecast - by Material
- 10. Middle East & Africa Commercial Office Furniture Industry in Australia Analysis, Insights and Forecast, 2020-2032
- 10.1. Market Analysis, Insights and Forecast - by Material
- 10.1.1. Wood
- 10.1.2. Metal
- 10.1.3. Plastic
- 10.1.4. Other Materials
- 10.2. Market Analysis, Insights and Forecast - by Product
- 10.2.1. Seating
- 10.2.2. Storage Units (Bins & Shelves, Cabinets, Others)
- 10.2.3. Tables (
- 10.3. Market Analysis, Insights and Forecast - by Distribution Channel
- 10.3.1. Offline
- 10.3.2. Online
- 10.1. Market Analysis, Insights and Forecast - by Material
- 11. Asia Pacific Commercial Office Furniture Industry in Australia Analysis, Insights and Forecast, 2020-2032
- 11.1. Market Analysis, Insights and Forecast - by Material
- 11.1.1. Wood
- 11.1.2. Metal
- 11.1.3. Plastic
- 11.1.4. Other Materials
- 11.2. Market Analysis, Insights and Forecast - by Product
- 11.2.1. Seating
- 11.2.2. Storage Units (Bins & Shelves, Cabinets, Others)
- 11.2.3. Tables (
- 11.3. Market Analysis, Insights and Forecast - by Distribution Channel
- 11.3.1. Offline
- 11.3.2. Online
- 11.1. Market Analysis, Insights and Forecast - by Material
- 12. Competitive Analysis
- 12.1. Company Profiles
- 12.1.1 Advanta
- 12.1.1.1. Company Overview
- 12.1.1.2. Products
- 12.1.1.3. Company Financials
- 12.1.1.4. SWOT Analysis
- 12.1.2 Krost Business Furniture
- 12.1.2.1. Company Overview
- 12.1.2.2. Products
- 12.1.2.3. Company Financials
- 12.1.2.4. SWOT Analysis
- 12.1.3 Alpha Office Furniture
- 12.1.3.1. Company Overview
- 12.1.3.2. Products
- 12.1.3.3. Company Financials
- 12.1.3.4. SWOT Analysis
- 12.1.4 Matic Furniture
- 12.1.4.1. Company Overview
- 12.1.4.2. Products
- 12.1.4.3. Company Financials
- 12.1.4.4. SWOT Analysis
- 12.1.5 Progressive Office Furniture
- 12.1.5.1. Company Overview
- 12.1.5.2. Products
- 12.1.5.3. Company Financials
- 12.1.5.4. SWOT Analysis
- 12.1.6 AMS Furniture
- 12.1.6.1. Company Overview
- 12.1.6.2. Products
- 12.1.6.3. Company Financials
- 12.1.6.4. SWOT Analysis
- 12.1.7 Aspen Commercial Interiors
- 12.1.7.1. Company Overview
- 12.1.7.2. Products
- 12.1.7.3. Company Financials
- 12.1.7.4. SWOT Analysis
- 12.1.8 Emanate Design
- 12.1.8.1. Company Overview
- 12.1.8.2. Products
- 12.1.8.3. Company Financials
- 12.1.8.4. SWOT Analysis
- 12.1.9 Diami
- 12.1.9.1. Company Overview
- 12.1.9.2. Products
- 12.1.9.3. Company Financials
- 12.1.9.4. SWOT Analysis
- 12.1.10 Burgtec
- 12.1.10.1. Company Overview
- 12.1.10.2. Products
- 12.1.10.3. Company Financials
- 12.1.10.4. SWOT Analysis
- 12.1.11 Fursys
- 12.1.11.1. Company Overview
- 12.1.11.2. Products
- 12.1.11.3. Company Financials
- 12.1.11.4. SWOT Analysis
- 12.1.12 BFX Furniture
- 12.1.12.1. Company Overview
- 12.1.12.2. Products
- 12.1.12.3. Company Financials
- 12.1.12.4. SWOT Analysis
- 12.1.1 Advanta
- 12.2. Market Entropy
- 12.2.1 Company's Key Areas Served
- 12.2.2 Recent Developments
- 12.3. Company Market Share Analysis 2025
- 12.3.1 Top 5 Companies Market Share Analysis
- 12.3.2 Top 3 Companies Market Share Analysis
- 12.4. List of Potential Customers
- 13. Research Methodology
List of Figures
- Figure 1: Global Commercial Office Furniture Industry in Australia Revenue Breakdown (Million, %) by Region 2025 & 2033
- Figure 2: Global Commercial Office Furniture Industry in Australia Volume Breakdown (K Unit, %) by Region 2025 & 2033
- Figure 3: North America Commercial Office Furniture Industry in Australia Revenue (Million), by Material 2025 & 2033
- Figure 4: North America Commercial Office Furniture Industry in Australia Volume (K Unit), by Material 2025 & 2033
- Figure 5: North America Commercial Office Furniture Industry in Australia Revenue Share (%), by Material 2025 & 2033
- Figure 6: North America Commercial Office Furniture Industry in Australia Volume Share (%), by Material 2025 & 2033
- Figure 7: North America Commercial Office Furniture Industry in Australia Revenue (Million), by Product 2025 & 2033
- Figure 8: North America Commercial Office Furniture Industry in Australia Volume (K Unit), by Product 2025 & 2033
- Figure 9: North America Commercial Office Furniture Industry in Australia Revenue Share (%), by Product 2025 & 2033
- Figure 10: North America Commercial Office Furniture Industry in Australia Volume Share (%), by Product 2025 & 2033
- Figure 11: North America Commercial Office Furniture Industry in Australia Revenue (Million), by Distribution Channel 2025 & 2033
- Figure 12: North America Commercial Office Furniture Industry in Australia Volume (K Unit), by Distribution Channel 2025 & 2033
- Figure 13: North America Commercial Office Furniture Industry in Australia Revenue Share (%), by Distribution Channel 2025 & 2033
- Figure 14: North America Commercial Office Furniture Industry in Australia Volume Share (%), by Distribution Channel 2025 & 2033
- Figure 15: North America Commercial Office Furniture Industry in Australia Revenue (Million), by Country 2025 & 2033
- Figure 16: North America Commercial Office Furniture Industry in Australia Volume (K Unit), by Country 2025 & 2033
- Figure 17: North America Commercial Office Furniture Industry in Australia Revenue Share (%), by Country 2025 & 2033
- Figure 18: North America Commercial Office Furniture Industry in Australia Volume Share (%), by Country 2025 & 2033
- Figure 19: South America Commercial Office Furniture Industry in Australia Revenue (Million), by Material 2025 & 2033
- Figure 20: South America Commercial Office Furniture Industry in Australia Volume (K Unit), by Material 2025 & 2033
- Figure 21: South America Commercial Office Furniture Industry in Australia Revenue Share (%), by Material 2025 & 2033
- Figure 22: South America Commercial Office Furniture Industry in Australia Volume Share (%), by Material 2025 & 2033
- Figure 23: South America Commercial Office Furniture Industry in Australia Revenue (Million), by Product 2025 & 2033
- Figure 24: South America Commercial Office Furniture Industry in Australia Volume (K Unit), by Product 2025 & 2033
- Figure 25: South America Commercial Office Furniture Industry in Australia Revenue Share (%), by Product 2025 & 2033
- Figure 26: South America Commercial Office Furniture Industry in Australia Volume Share (%), by Product 2025 & 2033
- Figure 27: South America Commercial Office Furniture Industry in Australia Revenue (Million), by Distribution Channel 2025 & 2033
- Figure 28: South America Commercial Office Furniture Industry in Australia Volume (K Unit), by Distribution Channel 2025 & 2033
- Figure 29: South America Commercial Office Furniture Industry in Australia Revenue Share (%), by Distribution Channel 2025 & 2033
- Figure 30: South America Commercial Office Furniture Industry in Australia Volume Share (%), by Distribution Channel 2025 & 2033
- Figure 31: South America Commercial Office Furniture Industry in Australia Revenue (Million), by Country 2025 & 2033
- Figure 32: South America Commercial Office Furniture Industry in Australia Volume (K Unit), by Country 2025 & 2033
- Figure 33: South America Commercial Office Furniture Industry in Australia Revenue Share (%), by Country 2025 & 2033
- Figure 34: South America Commercial Office Furniture Industry in Australia Volume Share (%), by Country 2025 & 2033
- Figure 35: Europe Commercial Office Furniture Industry in Australia Revenue (Million), by Material 2025 & 2033
- Figure 36: Europe Commercial Office Furniture Industry in Australia Volume (K Unit), by Material 2025 & 2033
- Figure 37: Europe Commercial Office Furniture Industry in Australia Revenue Share (%), by Material 2025 & 2033
- Figure 38: Europe Commercial Office Furniture Industry in Australia Volume Share (%), by Material 2025 & 2033
- Figure 39: Europe Commercial Office Furniture Industry in Australia Revenue (Million), by Product 2025 & 2033
- Figure 40: Europe Commercial Office Furniture Industry in Australia Volume (K Unit), by Product 2025 & 2033
- Figure 41: Europe Commercial Office Furniture Industry in Australia Revenue Share (%), by Product 2025 & 2033
- Figure 42: Europe Commercial Office Furniture Industry in Australia Volume Share (%), by Product 2025 & 2033
- Figure 43: Europe Commercial Office Furniture Industry in Australia Revenue (Million), by Distribution Channel 2025 & 2033
- Figure 44: Europe Commercial Office Furniture Industry in Australia Volume (K Unit), by Distribution Channel 2025 & 2033
- Figure 45: Europe Commercial Office Furniture Industry in Australia Revenue Share (%), by Distribution Channel 2025 & 2033
- Figure 46: Europe Commercial Office Furniture Industry in Australia Volume Share (%), by Distribution Channel 2025 & 2033
- Figure 47: Europe Commercial Office Furniture Industry in Australia Revenue (Million), by Country 2025 & 2033
- Figure 48: Europe Commercial Office Furniture Industry in Australia Volume (K Unit), by Country 2025 & 2033
- Figure 49: Europe Commercial Office Furniture Industry in Australia Revenue Share (%), by Country 2025 & 2033
- Figure 50: Europe Commercial Office Furniture Industry in Australia Volume Share (%), by Country 2025 & 2033
- Figure 51: Middle East & Africa Commercial Office Furniture Industry in Australia Revenue (Million), by Material 2025 & 2033
- Figure 52: Middle East & Africa Commercial Office Furniture Industry in Australia Volume (K Unit), by Material 2025 & 2033
- Figure 53: Middle East & Africa Commercial Office Furniture Industry in Australia Revenue Share (%), by Material 2025 & 2033
- Figure 54: Middle East & Africa Commercial Office Furniture Industry in Australia Volume Share (%), by Material 2025 & 2033
- Figure 55: Middle East & Africa Commercial Office Furniture Industry in Australia Revenue (Million), by Product 2025 & 2033
- Figure 56: Middle East & Africa Commercial Office Furniture Industry in Australia Volume (K Unit), by Product 2025 & 2033
- Figure 57: Middle East & Africa Commercial Office Furniture Industry in Australia Revenue Share (%), by Product 2025 & 2033
- Figure 58: Middle East & Africa Commercial Office Furniture Industry in Australia Volume Share (%), by Product 2025 & 2033
- Figure 59: Middle East & Africa Commercial Office Furniture Industry in Australia Revenue (Million), by Distribution Channel 2025 & 2033
- Figure 60: Middle East & Africa Commercial Office Furniture Industry in Australia Volume (K Unit), by Distribution Channel 2025 & 2033
- Figure 61: Middle East & Africa Commercial Office Furniture Industry in Australia Revenue Share (%), by Distribution Channel 2025 & 2033
- Figure 62: Middle East & Africa Commercial Office Furniture Industry in Australia Volume Share (%), by Distribution Channel 2025 & 2033
- Figure 63: Middle East & Africa Commercial Office Furniture Industry in Australia Revenue (Million), by Country 2025 & 2033
- Figure 64: Middle East & Africa Commercial Office Furniture Industry in Australia Volume (K Unit), by Country 2025 & 2033
- Figure 65: Middle East & Africa Commercial Office Furniture Industry in Australia Revenue Share (%), by Country 2025 & 2033
- Figure 66: Middle East & Africa Commercial Office Furniture Industry in Australia Volume Share (%), by Country 2025 & 2033
- Figure 67: Asia Pacific Commercial Office Furniture Industry in Australia Revenue (Million), by Material 2025 & 2033
- Figure 68: Asia Pacific Commercial Office Furniture Industry in Australia Volume (K Unit), by Material 2025 & 2033
- Figure 69: Asia Pacific Commercial Office Furniture Industry in Australia Revenue Share (%), by Material 2025 & 2033
- Figure 70: Asia Pacific Commercial Office Furniture Industry in Australia Volume Share (%), by Material 2025 & 2033
- Figure 71: Asia Pacific Commercial Office Furniture Industry in Australia Revenue (Million), by Product 2025 & 2033
- Figure 72: Asia Pacific Commercial Office Furniture Industry in Australia Volume (K Unit), by Product 2025 & 2033
- Figure 73: Asia Pacific Commercial Office Furniture Industry in Australia Revenue Share (%), by Product 2025 & 2033
- Figure 74: Asia Pacific Commercial Office Furniture Industry in Australia Volume Share (%), by Product 2025 & 2033
- Figure 75: Asia Pacific Commercial Office Furniture Industry in Australia Revenue (Million), by Distribution Channel 2025 & 2033
- Figure 76: Asia Pacific Commercial Office Furniture Industry in Australia Volume (K Unit), by Distribution Channel 2025 & 2033
- Figure 77: Asia Pacific Commercial Office Furniture Industry in Australia Revenue Share (%), by Distribution Channel 2025 & 2033
- Figure 78: Asia Pacific Commercial Office Furniture Industry in Australia Volume Share (%), by Distribution Channel 2025 & 2033
- Figure 79: Asia Pacific Commercial Office Furniture Industry in Australia Revenue (Million), by Country 2025 & 2033
- Figure 80: Asia Pacific Commercial Office Furniture Industry in Australia Volume (K Unit), by Country 2025 & 2033
- Figure 81: Asia Pacific Commercial Office Furniture Industry in Australia Revenue Share (%), by Country 2025 & 2033
- Figure 82: Asia Pacific Commercial Office Furniture Industry in Australia Volume Share (%), by Country 2025 & 2033
List of Tables
- Table 1: Global Commercial Office Furniture Industry in Australia Revenue Million Forecast, by Material 2020 & 2033
- Table 2: Global Commercial Office Furniture Industry in Australia Volume K Unit Forecast, by Material 2020 & 2033
- Table 3: Global Commercial Office Furniture Industry in Australia Revenue Million Forecast, by Product 2020 & 2033
- Table 4: Global Commercial Office Furniture Industry in Australia Volume K Unit Forecast, by Product 2020 & 2033
- Table 5: Global Commercial Office Furniture Industry in Australia Revenue Million Forecast, by Distribution Channel 2020 & 2033
- Table 6: Global Commercial Office Furniture Industry in Australia Volume K Unit Forecast, by Distribution Channel 2020 & 2033
- Table 7: Global Commercial Office Furniture Industry in Australia Revenue Million Forecast, by Region 2020 & 2033
- Table 8: Global Commercial Office Furniture Industry in Australia Volume K Unit Forecast, by Region 2020 & 2033
- Table 9: Global Commercial Office Furniture Industry in Australia Revenue Million Forecast, by Material 2020 & 2033
- Table 10: Global Commercial Office Furniture Industry in Australia Volume K Unit Forecast, by Material 2020 & 2033
- Table 11: Global Commercial Office Furniture Industry in Australia Revenue Million Forecast, by Product 2020 & 2033
- Table 12: Global Commercial Office Furniture Industry in Australia Volume K Unit Forecast, by Product 2020 & 2033
- Table 13: Global Commercial Office Furniture Industry in Australia Revenue Million Forecast, by Distribution Channel 2020 & 2033
- Table 14: Global Commercial Office Furniture Industry in Australia Volume K Unit Forecast, by Distribution Channel 2020 & 2033
- Table 15: Global Commercial Office Furniture Industry in Australia Revenue Million Forecast, by Country 2020 & 2033
- Table 16: Global Commercial Office Furniture Industry in Australia Volume K Unit Forecast, by Country 2020 & 2033
- Table 17: United States Commercial Office Furniture Industry in Australia Revenue (Million) Forecast, by Application 2020 & 2033
- Table 18: United States Commercial Office Furniture Industry in Australia Volume (K Unit) Forecast, by Application 2020 & 2033
- Table 19: Canada Commercial Office Furniture Industry in Australia Revenue (Million) Forecast, by Application 2020 & 2033
- Table 20: Canada Commercial Office Furniture Industry in Australia Volume (K Unit) Forecast, by Application 2020 & 2033
- Table 21: Mexico Commercial Office Furniture Industry in Australia Revenue (Million) Forecast, by Application 2020 & 2033
- Table 22: Mexico Commercial Office Furniture Industry in Australia Volume (K Unit) Forecast, by Application 2020 & 2033
- Table 23: Global Commercial Office Furniture Industry in Australia Revenue Million Forecast, by Material 2020 & 2033
- Table 24: Global Commercial Office Furniture Industry in Australia Volume K Unit Forecast, by Material 2020 & 2033
- Table 25: Global Commercial Office Furniture Industry in Australia Revenue Million Forecast, by Product 2020 & 2033
- Table 26: Global Commercial Office Furniture Industry in Australia Volume K Unit Forecast, by Product 2020 & 2033
- Table 27: Global Commercial Office Furniture Industry in Australia Revenue Million Forecast, by Distribution Channel 2020 & 2033
- Table 28: Global Commercial Office Furniture Industry in Australia Volume K Unit Forecast, by Distribution Channel 2020 & 2033
- Table 29: Global Commercial Office Furniture Industry in Australia Revenue Million Forecast, by Country 2020 & 2033
- Table 30: Global Commercial Office Furniture Industry in Australia Volume K Unit Forecast, by Country 2020 & 2033
- Table 31: Brazil Commercial Office Furniture Industry in Australia Revenue (Million) Forecast, by Application 2020 & 2033
- Table 32: Brazil Commercial Office Furniture Industry in Australia Volume (K Unit) Forecast, by Application 2020 & 2033
- Table 33: Argentina Commercial Office Furniture Industry in Australia Revenue (Million) Forecast, by Application 2020 & 2033
- Table 34: Argentina Commercial Office Furniture Industry in Australia Volume (K Unit) Forecast, by Application 2020 & 2033
- Table 35: Rest of South America Commercial Office Furniture Industry in Australia Revenue (Million) Forecast, by Application 2020 & 2033
- Table 36: Rest of South America Commercial Office Furniture Industry in Australia Volume (K Unit) Forecast, by Application 2020 & 2033
- Table 37: Global Commercial Office Furniture Industry in Australia Revenue Million Forecast, by Material 2020 & 2033
- Table 38: Global Commercial Office Furniture Industry in Australia Volume K Unit Forecast, by Material 2020 & 2033
- Table 39: Global Commercial Office Furniture Industry in Australia Revenue Million Forecast, by Product 2020 & 2033
- Table 40: Global Commercial Office Furniture Industry in Australia Volume K Unit Forecast, by Product 2020 & 2033
- Table 41: Global Commercial Office Furniture Industry in Australia Revenue Million Forecast, by Distribution Channel 2020 & 2033
- Table 42: Global Commercial Office Furniture Industry in Australia Volume K Unit Forecast, by Distribution Channel 2020 & 2033
- Table 43: Global Commercial Office Furniture Industry in Australia Revenue Million Forecast, by Country 2020 & 2033
- Table 44: Global Commercial Office Furniture Industry in Australia Volume K Unit Forecast, by Country 2020 & 2033
- Table 45: United Kingdom Commercial Office Furniture Industry in Australia Revenue (Million) Forecast, by Application 2020 & 2033
- Table 46: United Kingdom Commercial Office Furniture Industry in Australia Volume (K Unit) Forecast, by Application 2020 & 2033
- Table 47: Germany Commercial Office Furniture Industry in Australia Revenue (Million) Forecast, by Application 2020 & 2033
- Table 48: Germany Commercial Office Furniture Industry in Australia Volume (K Unit) Forecast, by Application 2020 & 2033
- Table 49: France Commercial Office Furniture Industry in Australia Revenue (Million) Forecast, by Application 2020 & 2033
- Table 50: France Commercial Office Furniture Industry in Australia Volume (K Unit) Forecast, by Application 2020 & 2033
- Table 51: Italy Commercial Office Furniture Industry in Australia Revenue (Million) Forecast, by Application 2020 & 2033
- Table 52: Italy Commercial Office Furniture Industry in Australia Volume (K Unit) Forecast, by Application 2020 & 2033
- Table 53: Spain Commercial Office Furniture Industry in Australia Revenue (Million) Forecast, by Application 2020 & 2033
- Table 54: Spain Commercial Office Furniture Industry in Australia Volume (K Unit) Forecast, by Application 2020 & 2033
- Table 55: Russia Commercial Office Furniture Industry in Australia Revenue (Million) Forecast, by Application 2020 & 2033
- Table 56: Russia Commercial Office Furniture Industry in Australia Volume (K Unit) Forecast, by Application 2020 & 2033
- Table 57: Benelux Commercial Office Furniture Industry in Australia Revenue (Million) Forecast, by Application 2020 & 2033
- Table 58: Benelux Commercial Office Furniture Industry in Australia Volume (K Unit) Forecast, by Application 2020 & 2033
- Table 59: Nordics Commercial Office Furniture Industry in Australia Revenue (Million) Forecast, by Application 2020 & 2033
- Table 60: Nordics Commercial Office Furniture Industry in Australia Volume (K Unit) Forecast, by Application 2020 & 2033
- Table 61: Rest of Europe Commercial Office Furniture Industry in Australia Revenue (Million) Forecast, by Application 2020 & 2033
- Table 62: Rest of Europe Commercial Office Furniture Industry in Australia Volume (K Unit) Forecast, by Application 2020 & 2033
- Table 63: Global Commercial Office Furniture Industry in Australia Revenue Million Forecast, by Material 2020 & 2033
- Table 64: Global Commercial Office Furniture Industry in Australia Volume K Unit Forecast, by Material 2020 & 2033
- Table 65: Global Commercial Office Furniture Industry in Australia Revenue Million Forecast, by Product 2020 & 2033
- Table 66: Global Commercial Office Furniture Industry in Australia Volume K Unit Forecast, by Product 2020 & 2033
- Table 67: Global Commercial Office Furniture Industry in Australia Revenue Million Forecast, by Distribution Channel 2020 & 2033
- Table 68: Global Commercial Office Furniture Industry in Australia Volume K Unit Forecast, by Distribution Channel 2020 & 2033
- Table 69: Global Commercial Office Furniture Industry in Australia Revenue Million Forecast, by Country 2020 & 2033
- Table 70: Global Commercial Office Furniture Industry in Australia Volume K Unit Forecast, by Country 2020 & 2033
- Table 71: Turkey Commercial Office Furniture Industry in Australia Revenue (Million) Forecast, by Application 2020 & 2033
- Table 72: Turkey Commercial Office Furniture Industry in Australia Volume (K Unit) Forecast, by Application 2020 & 2033
- Table 73: Israel Commercial Office Furniture Industry in Australia Revenue (Million) Forecast, by Application 2020 & 2033
- Table 74: Israel Commercial Office Furniture Industry in Australia Volume (K Unit) Forecast, by Application 2020 & 2033
- Table 75: GCC Commercial Office Furniture Industry in Australia Revenue (Million) Forecast, by Application 2020 & 2033
- Table 76: GCC Commercial Office Furniture Industry in Australia Volume (K Unit) Forecast, by Application 2020 & 2033
- Table 77: North Africa Commercial Office Furniture Industry in Australia Revenue (Million) Forecast, by Application 2020 & 2033
- Table 78: North Africa Commercial Office Furniture Industry in Australia Volume (K Unit) Forecast, by Application 2020 & 2033
- Table 79: South Africa Commercial Office Furniture Industry in Australia Revenue (Million) Forecast, by Application 2020 & 2033
- Table 80: South Africa Commercial Office Furniture Industry in Australia Volume (K Unit) Forecast, by Application 2020 & 2033
- Table 81: Rest of Middle East & Africa Commercial Office Furniture Industry in Australia Revenue (Million) Forecast, by Application 2020 & 2033
- Table 82: Rest of Middle East & Africa Commercial Office Furniture Industry in Australia Volume (K Unit) Forecast, by Application 2020 & 2033
- Table 83: Global Commercial Office Furniture Industry in Australia Revenue Million Forecast, by Material 2020 & 2033
- Table 84: Global Commercial Office Furniture Industry in Australia Volume K Unit Forecast, by Material 2020 & 2033
- Table 85: Global Commercial Office Furniture Industry in Australia Revenue Million Forecast, by Product 2020 & 2033
- Table 86: Global Commercial Office Furniture Industry in Australia Volume K Unit Forecast, by Product 2020 & 2033
- Table 87: Global Commercial Office Furniture Industry in Australia Revenue Million Forecast, by Distribution Channel 2020 & 2033
- Table 88: Global Commercial Office Furniture Industry in Australia Volume K Unit Forecast, by Distribution Channel 2020 & 2033
- Table 89: Global Commercial Office Furniture Industry in Australia Revenue Million Forecast, by Country 2020 & 2033
- Table 90: Global Commercial Office Furniture Industry in Australia Volume K Unit Forecast, by Country 2020 & 2033
- Table 91: China Commercial Office Furniture Industry in Australia Revenue (Million) Forecast, by Application 2020 & 2033
- Table 92: China Commercial Office Furniture Industry in Australia Volume (K Unit) Forecast, by Application 2020 & 2033
- Table 93: India Commercial Office Furniture Industry in Australia Revenue (Million) Forecast, by Application 2020 & 2033
- Table 94: India Commercial Office Furniture Industry in Australia Volume (K Unit) Forecast, by Application 2020 & 2033
- Table 95: Japan Commercial Office Furniture Industry in Australia Revenue (Million) Forecast, by Application 2020 & 2033
- Table 96: Japan Commercial Office Furniture Industry in Australia Volume (K Unit) Forecast, by Application 2020 & 2033
- Table 97: South Korea Commercial Office Furniture Industry in Australia Revenue (Million) Forecast, by Application 2020 & 2033
- Table 98: South Korea Commercial Office Furniture Industry in Australia Volume (K Unit) Forecast, by Application 2020 & 2033
- Table 99: ASEAN Commercial Office Furniture Industry in Australia Revenue (Million) Forecast, by Application 2020 & 2033
- Table 100: ASEAN Commercial Office Furniture Industry in Australia Volume (K Unit) Forecast, by Application 2020 & 2033
- Table 101: Oceania Commercial Office Furniture Industry in Australia Revenue (Million) Forecast, by Application 2020 & 2033
- Table 102: Oceania Commercial Office Furniture Industry in Australia Volume (K Unit) Forecast, by Application 2020 & 2033
- Table 103: Rest of Asia Pacific Commercial Office Furniture Industry in Australia Revenue (Million) Forecast, by Application 2020 & 2033
- Table 104: Rest of Asia Pacific Commercial Office Furniture Industry in Australia Volume (K Unit) Forecast, by Application 2020 & 2033
Frequently Asked Questions
1. What is the projected Compound Annual Growth Rate (CAGR) of the Commercial Office Furniture Industry in Australia?
The projected CAGR is approximately 3.54%.
2. Which companies are prominent players in the Commercial Office Furniture Industry in Australia?
Key companies in the market include Advanta, Krost Business Furniture, Alpha Office Furniture, Matic Furniture, Progressive Office Furniture, AMS Furniture, Aspen Commercial Interiors, Emanate Design, Diami, Burgtec, Fursys, BFX Furniture.
3. What are the main segments of the Commercial Office Furniture Industry in Australia?
The market segments include Material, Product, Distribution Channel.
4. Can you provide details about the market size?
The market size is estimated to be USD 2.46 Million as of 2022.
5. What are some drivers contributing to market growth?
Rise in New Offices in South Korea; Wide Range of Design Broadening Consumer Base.
6. What are the notable trends driving market growth?
Rise in Commercial Space Construction.
7. Are there any restraints impacting market growth?
Fluctuations in Raw Material Prices and Rise in Shipping Prices; Intense Competition from Both Local and International Players.
8. Can you provide examples of recent developments in the market?
N/A
9. What pricing options are available for accessing the report?
Pricing options include single-user, multi-user, and enterprise licenses priced at USD 3800, USD 4500, and USD 5800 respectively.
10. Is the market size provided in terms of value or volume?
The market size is provided in terms of value, measured in Million and volume, measured in K Unit.
11. Are there any specific market keywords associated with the report?
Yes, the market keyword associated with the report is "Commercial Office Furniture Industry in Australia," which aids in identifying and referencing the specific market segment covered.
12. How do I determine which pricing option suits my needs best?
The pricing options vary based on user requirements and access needs. Individual users may opt for single-user licenses, while businesses requiring broader access may choose multi-user or enterprise licenses for cost-effective access to the report.
13. Are there any additional resources or data provided in the Commercial Office Furniture Industry in Australia report?
While the report offers comprehensive insights, it's advisable to review the specific contents or supplementary materials provided to ascertain if additional resources or data are available.
14. How can I stay updated on further developments or reports in the Commercial Office Furniture Industry in Australia?
To stay informed about further developments, trends, and reports in the Commercial Office Furniture Industry in Australia, consider subscribing to industry newsletters, following relevant companies and organizations, or regularly checking reputable industry news sources and publications.
Methodology
Step 1 - Identification of Relevant Samples Size from Population Database


Step 2 - Approaches for Defining Global Market Size (Value, Volume* & Price*)

Note*: In applicable scenarios
Step 3 - Data Sources
Primary Research
- Web Analytics
- Survey Reports
- Research Institute
- Latest Research Reports
- Opinion Leaders
Secondary Research
- Annual Reports
- White Paper
- Latest Press Release
- Industry Association
- Paid Database
- Investor Presentations

Step 4 - Data Triangulation
Involves using different sources of information in order to increase the validity of a study
These sources are likely to be stakeholders in a program - participants, other researchers, program staff, other community members, and so on.
Then we put all data in single framework & apply various statistical tools to find out the dynamic on the market.
During the analysis stage, feedback from the stakeholder groups would be compared to determine areas of agreement as well as areas of divergence