

Key Insights
The European connected vehicle market is projected for substantial expansion, driven by rising vehicle production, widespread adoption of advanced driver-assistance systems (ADAS), and growing demand for sophisticated in-car safety and entertainment. The market, valued at 119.27 billion in the base year of 2025, is expected to grow at a Compound Annual Growth Rate (CAGR) of 19.8% through the forecast period (2025-2033). Key growth accelerators include robust government mandates for vehicle safety and connectivity, the rapid deployment of 5G networks for efficient data transfer, and increasing consumer appetite for connected services like real-time traffic data, remote diagnostics, and over-the-air (OTA) updates. Market segmentation covers end-users (OEM, aftermarket), technology (navigation, entertainment, safety, vehicle management), connectivity type (integrated, embedded, tethered), and vehicle connectivity (V2V, V2I, V2X). Germany, France, and the UK lead national markets due to their strong automotive sectors and early adoption of connected vehicle technologies. The aftermarket segment is poised for significant growth driven by demand for upgrades and add-on features.
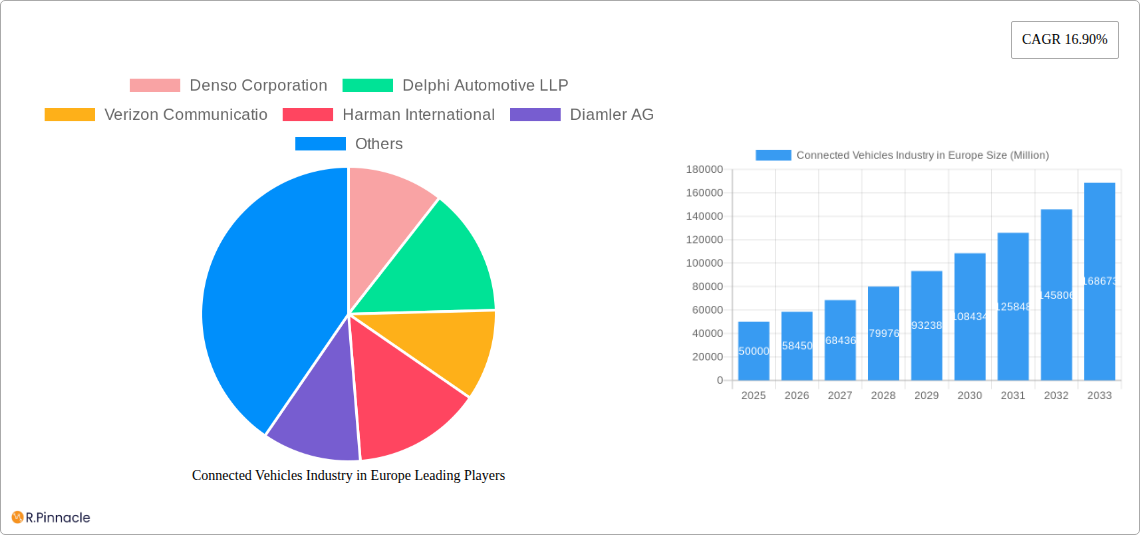
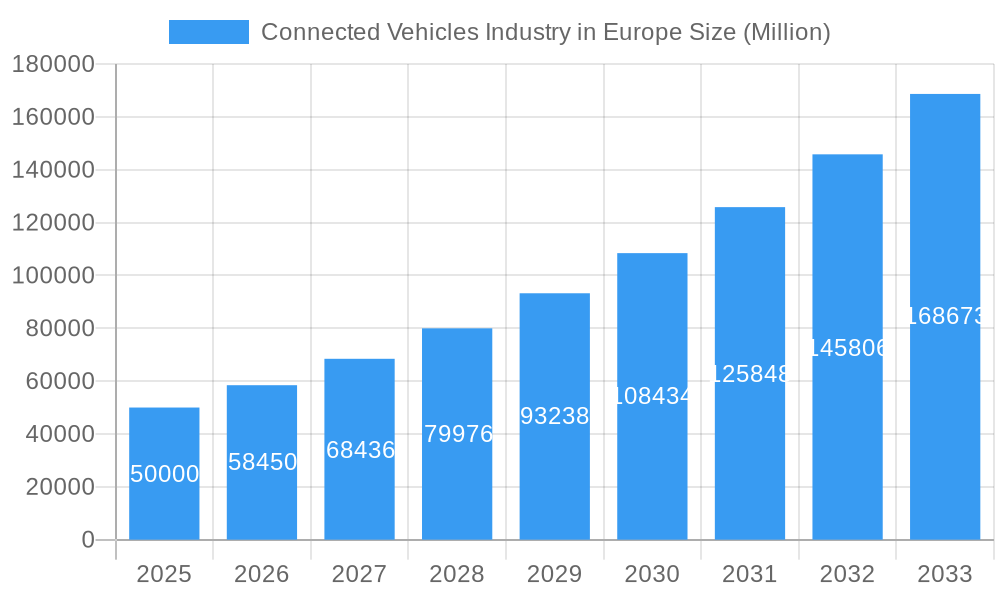
Connected Vehicles Industry in Europe Market Size (In Billion)
Despite a positive outlook, market adoption may face hurdles from high initial investment costs for connected vehicle technology, especially in the aftermarket. Data privacy and cybersecurity concerns are critical for both manufacturers and consumers. Market progression will depend on overcoming these challenges through collaboration between automotive manufacturers, technology providers, and regulatory bodies. Continuous advancements in AI and machine learning will further enhance connected vehicle functionality and appeal, fueling market growth. Future expansion will also rely on effectively addressing consumer concerns about data security and ensuring seamless integration of connected vehicle systems across diverse platforms and brands.
Connected Vehicles Industry in Europe Company Market Share
Connected Vehicles Industry in Europe: Market Analysis & Growth Forecast (2019-2033)
This comprehensive report provides an in-depth analysis of the Connected Vehicles industry in Europe, covering market size, growth drivers, key players, and future trends. With a study period spanning 2019-2033, a base year of 2025, and a forecast period of 2025-2033, this report offers invaluable insights for industry professionals, investors, and strategists. The report leverages a robust methodology, encompassing historical data (2019-2024) and detailed projections, to present a clear and actionable view of this dynamic market. The total market size in 2025 is estimated at €XX Million.
Connected Vehicles Industry in Europe Market Structure & Innovation Trends
The European connected vehicles market exhibits a moderately concentrated structure, with key players like Robert Bosch GmbH, Continental AG, BMW Group, and Audi AG holding significant market share. However, the market also features a number of smaller, specialized companies, fostering innovation and competition. Innovation is driven by advancements in 5G, AI, and cloud computing, enabling the development of sophisticated V2X (Vehicle-to-Everything) communication systems and advanced driver-assistance systems (ADAS). Regulatory frameworks, such as those concerning data privacy and cybersecurity, significantly influence market development. Product substitutes, such as traditional infotainment systems, pose a challenge, but the increasing demand for enhanced safety and convenience features continues to drive adoption. Mergers and acquisitions (M&A) are frequent, with deal values exceeding €XX Million in recent years, as larger players seek to expand their capabilities and market reach. For instance, Harman's acquisition of Savari Inc. strengthened its V2X technology portfolio. Market share dynamics reflect the strategic positioning of players across different segments (OEM, aftermarket) and technologies (navigation, safety, etc.).
Connected Vehicles Industry in Europe Market Dynamics & Trends
The European connected vehicles market is experiencing robust growth, driven by rising consumer demand for enhanced safety, convenience, and infotainment features. Technological advancements, particularly in 5G connectivity and AI-powered solutions, are accelerating market expansion. The increasing penetration of smartphones and the growing adoption of connected car services are further fueling market growth. The market's CAGR during the forecast period (2025-2033) is projected to be XX%. Market penetration is expected to reach XX% by 2033, driven by factors such as increasing vehicle production, government initiatives promoting connected car technology, and the expansion of related infrastructure. Competitive dynamics are characterized by intense rivalry among established players and the emergence of new entrants offering innovative solutions. Consumer preferences are shifting towards seamless integration of services and personalized experiences, emphasizing user-friendly interfaces and data security.
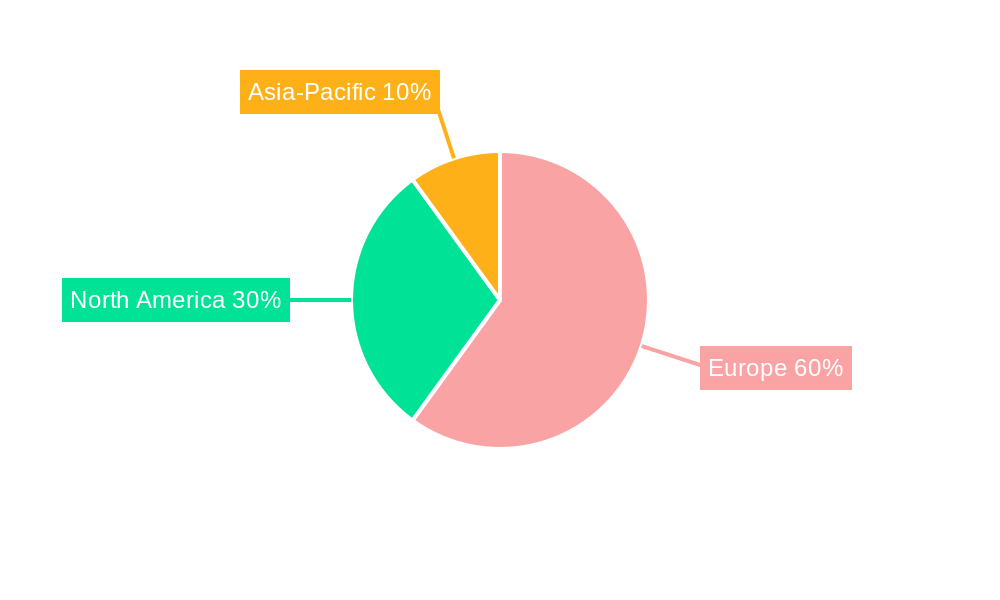
Dominant Regions & Segments in Connected Vehicles Industry in Europe
Leading Region: Western Europe, particularly Germany, France, and the United Kingdom, dominate the market due to robust automotive industries and advanced technological infrastructure.
Leading Country: Germany holds the largest market share due to a strong automotive manufacturing base and early adoption of connected car technologies.
Leading End-User Type: OEMs currently dominate the market, but the aftermarket segment is expected to experience significant growth driven by rising consumer demand for upgrades and aftermarket connectivity solutions.
Leading Technology Type: Safety and Navigation systems currently hold significant market share, driven by government regulations and consumer preferences. However, the vehicle management segment is projected to witness substantial growth, fueled by advancements in telematics and data analytics.
Leading Connectivity Type: Integrated connectivity is the dominant type, though embedded and tethered solutions also contribute significantly.
Leading Vehicle Connectivity Type: V2X technologies, including V2Vehicle and V2Infrastructure are rapidly gaining traction, driven by initiatives to enhance road safety and traffic management.
Key drivers for this dominance include supportive economic policies promoting technological advancement, substantial investments in digital infrastructure, and a receptive consumer base. Germany's automotive manufacturing prowess and the presence of major automotive OEMs further solidify its leading position. The UK also plays a significant role due to its strong technological ecosystem and supportive regulatory framework.
Connected Vehicles Industry in Europe Product Innovations
Recent product developments include the integration of advanced driver-assistance systems (ADAS), improved in-car infotainment systems with seamless smartphone integration, and the emergence of sophisticated V2X communication technologies. These innovations are aimed at enhancing safety, convenience, and the overall driving experience. The competitive advantage lies in the ability to offer integrated, user-friendly solutions that meet evolving consumer demands for personalization and data security. Technological trends favor increased automation, artificial intelligence, and 5G connectivity to enable enhanced features and services.
Report Scope & Segmentation Analysis
This report segments the European connected vehicles market by end-user type (OEM, Aftermarket), country (Germany, France, UK, Rest of Europe), technology type (Navigation, Entertainment, Safety, Vehicle Management, Other), connectivity type (Integrated, Embedded, Tethered), and vehicle connectivity type (V2Vehicle, V2Infrastructure, V2X). Each segment is analyzed in terms of its current market size, growth projections, and competitive dynamics. Growth projections vary across segments, with V2X technologies and the aftermarket segment exhibiting particularly strong growth potential. Competitive dynamics reflect the diverse strategies of established players and emerging companies.
Key Drivers of Connected Vehicles Industry in Europe Growth
The growth of the European connected vehicles industry is driven by several key factors: increasing demand for enhanced safety and convenience features, rapid advancements in 5G and AI technologies, supportive government regulations promoting connected car adoption, rising investments in infrastructure, and growing consumer adoption of connected services. The Volkswagen Group's €10 billion investment in electric vehicle infrastructure further exemplifies the industry's dynamic growth trajectory.
Challenges in the Connected Vehicles Industry in Europe Sector
Key challenges facing the European connected vehicles sector include stringent data privacy regulations, the need to address cybersecurity concerns, potential supply chain disruptions, and intense competition among established players and new entrants. These factors can impact market growth and profitability if not adequately addressed. The cost of implementation and integration of connected vehicle technologies also poses a barrier to widespread adoption.
Emerging Opportunities in Connected Vehicles Industry in Europe
Emerging opportunities include the expansion of V2X technologies, the development of new services based on data analytics and AI, the integration of connected car features into smart city initiatives, and the growth of the aftermarket segment driven by demand for upgrades and customization. Furthermore, the increasing focus on sustainable transportation presents opportunities for connected vehicle solutions that optimize fuel efficiency and reduce emissions.
Leading Players in the Connected Vehicles Industry in Europe Market
- Denso Corporation
- Delphi Automotive LLP
- Verizon Communications
- Harman International
- Daimler AG
- Continental AG
- Autoliv Inc
- Robert Bosch GmbH
- BMW Group
- Audi AG
Key Developments in Connected Vehicles Industry in Europe Industry
- May 2022: Volkswagen Group and SEAT SA announced a €10 billion investment in electrifying Europe, including battery plant construction.
- February 2021: Robert Bosch partnered with Microsoft to develop a vehicle development platform for connected vehicles.
- February 2021: Harman acquired Savari Inc. to boost its V2X communication technology development using 5G.
These developments highlight the industry's focus on electrification, technological innovation, and strategic partnerships to drive growth and expand market reach.
Future Outlook for Connected Vehicles Industry in Europe Market
The future outlook for the European connected vehicles market is highly positive, with continued growth driven by technological advancements, supportive government policies, and increasing consumer demand. Strategic opportunities exist for companies that can offer innovative, integrated solutions that meet evolving consumer preferences and address key challenges, such as data privacy and cybersecurity. The market is poised for significant expansion, driven by the convergence of automotive and information technology.
Connected Vehicles Industry in Europe Segmentation
-
1. Technology Type
- 1.1. Navigation
- 1.2. Entertainment
- 1.3. Safety
- 1.4. Vehicle Management
- 1.5. Other Technology Types
-
2. Connectivity Type
- 2.1. Integrated
- 2.2. Embedded
- 2.3. Tethered
-
3. Vehicle Connectivity Type
- 3.1. V2Vehicle
- 3.2. V2Infrastructure
- 3.3. V2X
-
4. End-User Type
- 4.1. OEM
- 4.2. Aftermarket
Connected Vehicles Industry in Europe Segmentation By Geography
-
1. North America
- 1.1. United States
- 1.2. Canada
- 1.3. Mexico
-
2. South America
- 2.1. Brazil
- 2.2. Argentina
- 2.3. Rest of South America
-
3. Europe
- 3.1. United Kingdom
- 3.2. Germany
- 3.3. France
- 3.4. Italy
- 3.5. Spain
- 3.6. Russia
- 3.7. Benelux
- 3.8. Nordics
- 3.9. Rest of Europe
-
4. Middle East & Africa
- 4.1. Turkey
- 4.2. Israel
- 4.3. GCC
- 4.4. North Africa
- 4.5. South Africa
- 4.6. Rest of Middle East & Africa
-
5. Asia Pacific
- 5.1. China
- 5.2. India
- 5.3. Japan
- 5.4. South Korea
- 5.5. ASEAN
- 5.6. Oceania
- 5.7. Rest of Asia Pacific
Connected Vehicles Industry in Europe Regional Market Share
Geographic Coverage of Connected Vehicles Industry in Europe
Connected Vehicles Industry in Europe REPORT HIGHLIGHTS
| Aspects | Details |
|---|---|
| Study Period | 2020-2034 |
| Base Year | 2025 |
| Estimated Year | 2026 |
| Forecast Period | 2026-2034 |
| Historical Period | 2020-2025 |
| Growth Rate | CAGR of 19.8% from 2020-2034 |
| Segmentation |
|
Table of Contents
- 1. Introduction
- 1.1. Research Scope
- 1.2. Market Segmentation
- 1.3. Research Objective
- 1.4. Definitions and Assumptions
- 2. Executive Summary
- 2.1. Market Snapshot
- 3. Market Dynamics
- 3.1. Market Drivers
- 3.2. Market Restrains
- 3.3. Market Trends
- 3.4. Market Opportunities
- 4. Market Factor Analysis
- 4.1. Porters Five Forces
- 4.1.1. Bargaining Power of Suppliers
- 4.1.2. Bargaining Power of Buyers
- 4.1.3. Threat of New Entrants
- 4.1.4. Threat of Substitutes
- 4.1.5. Competitive Rivalry
- 4.2. PESTEL analysis
- 4.3. BCG Analysis
- 4.3.1. Stars (High Growth, High Market Share)
- 4.3.2. Cash Cows (Low Growth, High Market Share)
- 4.3.3. Question Mark (High Growth, Low Market Share)
- 4.3.4. Dogs (Low Growth, Low Market Share)
- 4.4. Ansoff Matrix Analysis
- 4.5. Supply Chain Analysis
- 4.6. Regulatory Landscape
- 4.7. Current Market Potential and Opportunity Assessment (TAM–SAM–SOM Framework)
- 4.8. PRI Analyst Note
- 4.1. Porters Five Forces
- 5. Market Analysis, Insights and Forecast 2021-2033
- 5.1. Market Analysis, Insights and Forecast - by Technology Type
- 5.1.1. Navigation
- 5.1.2. Entertainment
- 5.1.3. Safety
- 5.1.4. Vehicle Management
- 5.1.5. Other Technology Types
- 5.2. Market Analysis, Insights and Forecast - by Connectivity Type
- 5.2.1. Integrated
- 5.2.2. Embedded
- 5.2.3. Tethered
- 5.3. Market Analysis, Insights and Forecast - by Vehicle Connectivity Type
- 5.3.1. V2Vehicle
- 5.3.2. V2Infrastructure
- 5.3.3. V2X
- 5.4. Market Analysis, Insights and Forecast - by End-User Type
- 5.4.1. OEM
- 5.4.2. Aftermarket
- 5.5. Market Analysis, Insights and Forecast - by Region
- 5.5.1. North America
- 5.5.2. South America
- 5.5.3. Europe
- 5.5.4. Middle East & Africa
- 5.5.5. Asia Pacific
- 5.1. Market Analysis, Insights and Forecast - by Technology Type
- 6. Global Connected Vehicles Industry in Europe Analysis, Insights and Forecast, 2021-2033
- 6.1. Market Analysis, Insights and Forecast - by Technology Type
- 6.1.1. Navigation
- 6.1.2. Entertainment
- 6.1.3. Safety
- 6.1.4. Vehicle Management
- 6.1.5. Other Technology Types
- 6.2. Market Analysis, Insights and Forecast - by Connectivity Type
- 6.2.1. Integrated
- 6.2.2. Embedded
- 6.2.3. Tethered
- 6.3. Market Analysis, Insights and Forecast - by Vehicle Connectivity Type
- 6.3.1. V2Vehicle
- 6.3.2. V2Infrastructure
- 6.3.3. V2X
- 6.4. Market Analysis, Insights and Forecast - by End-User Type
- 6.4.1. OEM
- 6.4.2. Aftermarket
- 6.1. Market Analysis, Insights and Forecast - by Technology Type
- 7. North America Connected Vehicles Industry in Europe Analysis, Insights and Forecast, 2020-2032
- 7.1. Market Analysis, Insights and Forecast - by Technology Type
- 7.1.1. Navigation
- 7.1.2. Entertainment
- 7.1.3. Safety
- 7.1.4. Vehicle Management
- 7.1.5. Other Technology Types
- 7.2. Market Analysis, Insights and Forecast - by Connectivity Type
- 7.2.1. Integrated
- 7.2.2. Embedded
- 7.2.3. Tethered
- 7.3. Market Analysis, Insights and Forecast - by Vehicle Connectivity Type
- 7.3.1. V2Vehicle
- 7.3.2. V2Infrastructure
- 7.3.3. V2X
- 7.4. Market Analysis, Insights and Forecast - by End-User Type
- 7.4.1. OEM
- 7.4.2. Aftermarket
- 7.1. Market Analysis, Insights and Forecast - by Technology Type
- 8. South America Connected Vehicles Industry in Europe Analysis, Insights and Forecast, 2020-2032
- 8.1. Market Analysis, Insights and Forecast - by Technology Type
- 8.1.1. Navigation
- 8.1.2. Entertainment
- 8.1.3. Safety
- 8.1.4. Vehicle Management
- 8.1.5. Other Technology Types
- 8.2. Market Analysis, Insights and Forecast - by Connectivity Type
- 8.2.1. Integrated
- 8.2.2. Embedded
- 8.2.3. Tethered
- 8.3. Market Analysis, Insights and Forecast - by Vehicle Connectivity Type
- 8.3.1. V2Vehicle
- 8.3.2. V2Infrastructure
- 8.3.3. V2X
- 8.4. Market Analysis, Insights and Forecast - by End-User Type
- 8.4.1. OEM
- 8.4.2. Aftermarket
- 8.1. Market Analysis, Insights and Forecast - by Technology Type
- 9. Europe Connected Vehicles Industry in Europe Analysis, Insights and Forecast, 2020-2032
- 9.1. Market Analysis, Insights and Forecast - by Technology Type
- 9.1.1. Navigation
- 9.1.2. Entertainment
- 9.1.3. Safety
- 9.1.4. Vehicle Management
- 9.1.5. Other Technology Types
- 9.2. Market Analysis, Insights and Forecast - by Connectivity Type
- 9.2.1. Integrated
- 9.2.2. Embedded
- 9.2.3. Tethered
- 9.3. Market Analysis, Insights and Forecast - by Vehicle Connectivity Type
- 9.3.1. V2Vehicle
- 9.3.2. V2Infrastructure
- 9.3.3. V2X
- 9.4. Market Analysis, Insights and Forecast - by End-User Type
- 9.4.1. OEM
- 9.4.2. Aftermarket
- 9.1. Market Analysis, Insights and Forecast - by Technology Type
- 10. Middle East & Africa Connected Vehicles Industry in Europe Analysis, Insights and Forecast, 2020-2032
- 10.1. Market Analysis, Insights and Forecast - by Technology Type
- 10.1.1. Navigation
- 10.1.2. Entertainment
- 10.1.3. Safety
- 10.1.4. Vehicle Management
- 10.1.5. Other Technology Types
- 10.2. Market Analysis, Insights and Forecast - by Connectivity Type
- 10.2.1. Integrated
- 10.2.2. Embedded
- 10.2.3. Tethered
- 10.3. Market Analysis, Insights and Forecast - by Vehicle Connectivity Type
- 10.3.1. V2Vehicle
- 10.3.2. V2Infrastructure
- 10.3.3. V2X
- 10.4. Market Analysis, Insights and Forecast - by End-User Type
- 10.4.1. OEM
- 10.4.2. Aftermarket
- 10.1. Market Analysis, Insights and Forecast - by Technology Type
- 11. Asia Pacific Connected Vehicles Industry in Europe Analysis, Insights and Forecast, 2020-2032
- 11.1. Market Analysis, Insights and Forecast - by Technology Type
- 11.1.1. Navigation
- 11.1.2. Entertainment
- 11.1.3. Safety
- 11.1.4. Vehicle Management
- 11.1.5. Other Technology Types
- 11.2. Market Analysis, Insights and Forecast - by Connectivity Type
- 11.2.1. Integrated
- 11.2.2. Embedded
- 11.2.3. Tethered
- 11.3. Market Analysis, Insights and Forecast - by Vehicle Connectivity Type
- 11.3.1. V2Vehicle
- 11.3.2. V2Infrastructure
- 11.3.3. V2X
- 11.4. Market Analysis, Insights and Forecast - by End-User Type
- 11.4.1. OEM
- 11.4.2. Aftermarket
- 11.1. Market Analysis, Insights and Forecast - by Technology Type
- 12. Competitive Analysis
- 12.1. Company Profiles
- 12.1.1 Denso Corporation
- 12.1.1.1. Company Overview
- 12.1.1.2. Products
- 12.1.1.3. Company Financials
- 12.1.1.4. SWOT Analysis
- 12.1.2 Delphi Automotive LLP
- 12.1.2.1. Company Overview
- 12.1.2.2. Products
- 12.1.2.3. Company Financials
- 12.1.2.4. SWOT Analysis
- 12.1.3 Verizon Communicatio
- 12.1.3.1. Company Overview
- 12.1.3.2. Products
- 12.1.3.3. Company Financials
- 12.1.3.4. SWOT Analysis
- 12.1.4 Harman International
- 12.1.4.1. Company Overview
- 12.1.4.2. Products
- 12.1.4.3. Company Financials
- 12.1.4.4. SWOT Analysis
- 12.1.5 Diamler AG
- 12.1.5.1. Company Overview
- 12.1.5.2. Products
- 12.1.5.3. Company Financials
- 12.1.5.4. SWOT Analysis
- 12.1.6 Continental AG
- 12.1.6.1. Company Overview
- 12.1.6.2. Products
- 12.1.6.3. Company Financials
- 12.1.6.4. SWOT Analysis
- 12.1.7 Autoliv Inc
- 12.1.7.1. Company Overview
- 12.1.7.2. Products
- 12.1.7.3. Company Financials
- 12.1.7.4. SWOT Analysis
- 12.1.8 Robert Bosch GmbH
- 12.1.8.1. Company Overview
- 12.1.8.2. Products
- 12.1.8.3. Company Financials
- 12.1.8.4. SWOT Analysis
- 12.1.9 BMW Group
- 12.1.9.1. Company Overview
- 12.1.9.2. Products
- 12.1.9.3. Company Financials
- 12.1.9.4. SWOT Analysis
- 12.1.10 Audi AG
- 12.1.10.1. Company Overview
- 12.1.10.2. Products
- 12.1.10.3. Company Financials
- 12.1.10.4. SWOT Analysis
- 12.1.1 Denso Corporation
- 12.2. Market Entropy
- 12.2.1 Company's Key Areas Served
- 12.2.2 Recent Developments
- 12.3. Company Market Share Analysis 2025
- 12.3.1 Top 5 Companies Market Share Analysis
- 12.3.2 Top 3 Companies Market Share Analysis
- 12.4. List of Potential Customers
- 13. Research Methodology
List of Figures
- Figure 1: Global Connected Vehicles Industry in Europe Revenue Breakdown (billion, %) by Region 2025 & 2033
- Figure 2: North America Connected Vehicles Industry in Europe Revenue (billion), by Technology Type 2025 & 2033
- Figure 3: North America Connected Vehicles Industry in Europe Revenue Share (%), by Technology Type 2025 & 2033
- Figure 4: North America Connected Vehicles Industry in Europe Revenue (billion), by Connectivity Type 2025 & 2033
- Figure 5: North America Connected Vehicles Industry in Europe Revenue Share (%), by Connectivity Type 2025 & 2033
- Figure 6: North America Connected Vehicles Industry in Europe Revenue (billion), by Vehicle Connectivity Type 2025 & 2033
- Figure 7: North America Connected Vehicles Industry in Europe Revenue Share (%), by Vehicle Connectivity Type 2025 & 2033
- Figure 8: North America Connected Vehicles Industry in Europe Revenue (billion), by End-User Type 2025 & 2033
- Figure 9: North America Connected Vehicles Industry in Europe Revenue Share (%), by End-User Type 2025 & 2033
- Figure 10: North America Connected Vehicles Industry in Europe Revenue (billion), by Country 2025 & 2033
- Figure 11: North America Connected Vehicles Industry in Europe Revenue Share (%), by Country 2025 & 2033
- Figure 12: South America Connected Vehicles Industry in Europe Revenue (billion), by Technology Type 2025 & 2033
- Figure 13: South America Connected Vehicles Industry in Europe Revenue Share (%), by Technology Type 2025 & 2033
- Figure 14: South America Connected Vehicles Industry in Europe Revenue (billion), by Connectivity Type 2025 & 2033
- Figure 15: South America Connected Vehicles Industry in Europe Revenue Share (%), by Connectivity Type 2025 & 2033
- Figure 16: South America Connected Vehicles Industry in Europe Revenue (billion), by Vehicle Connectivity Type 2025 & 2033
- Figure 17: South America Connected Vehicles Industry in Europe Revenue Share (%), by Vehicle Connectivity Type 2025 & 2033
- Figure 18: South America Connected Vehicles Industry in Europe Revenue (billion), by End-User Type 2025 & 2033
- Figure 19: South America Connected Vehicles Industry in Europe Revenue Share (%), by End-User Type 2025 & 2033
- Figure 20: South America Connected Vehicles Industry in Europe Revenue (billion), by Country 2025 & 2033
- Figure 21: South America Connected Vehicles Industry in Europe Revenue Share (%), by Country 2025 & 2033
- Figure 22: Europe Connected Vehicles Industry in Europe Revenue (billion), by Technology Type 2025 & 2033
- Figure 23: Europe Connected Vehicles Industry in Europe Revenue Share (%), by Technology Type 2025 & 2033
- Figure 24: Europe Connected Vehicles Industry in Europe Revenue (billion), by Connectivity Type 2025 & 2033
- Figure 25: Europe Connected Vehicles Industry in Europe Revenue Share (%), by Connectivity Type 2025 & 2033
- Figure 26: Europe Connected Vehicles Industry in Europe Revenue (billion), by Vehicle Connectivity Type 2025 & 2033
- Figure 27: Europe Connected Vehicles Industry in Europe Revenue Share (%), by Vehicle Connectivity Type 2025 & 2033
- Figure 28: Europe Connected Vehicles Industry in Europe Revenue (billion), by End-User Type 2025 & 2033
- Figure 29: Europe Connected Vehicles Industry in Europe Revenue Share (%), by End-User Type 2025 & 2033
- Figure 30: Europe Connected Vehicles Industry in Europe Revenue (billion), by Country 2025 & 2033
- Figure 31: Europe Connected Vehicles Industry in Europe Revenue Share (%), by Country 2025 & 2033
- Figure 32: Middle East & Africa Connected Vehicles Industry in Europe Revenue (billion), by Technology Type 2025 & 2033
- Figure 33: Middle East & Africa Connected Vehicles Industry in Europe Revenue Share (%), by Technology Type 2025 & 2033
- Figure 34: Middle East & Africa Connected Vehicles Industry in Europe Revenue (billion), by Connectivity Type 2025 & 2033
- Figure 35: Middle East & Africa Connected Vehicles Industry in Europe Revenue Share (%), by Connectivity Type 2025 & 2033
- Figure 36: Middle East & Africa Connected Vehicles Industry in Europe Revenue (billion), by Vehicle Connectivity Type 2025 & 2033
- Figure 37: Middle East & Africa Connected Vehicles Industry in Europe Revenue Share (%), by Vehicle Connectivity Type 2025 & 2033
- Figure 38: Middle East & Africa Connected Vehicles Industry in Europe Revenue (billion), by End-User Type 2025 & 2033
- Figure 39: Middle East & Africa Connected Vehicles Industry in Europe Revenue Share (%), by End-User Type 2025 & 2033
- Figure 40: Middle East & Africa Connected Vehicles Industry in Europe Revenue (billion), by Country 2025 & 2033
- Figure 41: Middle East & Africa Connected Vehicles Industry in Europe Revenue Share (%), by Country 2025 & 2033
- Figure 42: Asia Pacific Connected Vehicles Industry in Europe Revenue (billion), by Technology Type 2025 & 2033
- Figure 43: Asia Pacific Connected Vehicles Industry in Europe Revenue Share (%), by Technology Type 2025 & 2033
- Figure 44: Asia Pacific Connected Vehicles Industry in Europe Revenue (billion), by Connectivity Type 2025 & 2033
- Figure 45: Asia Pacific Connected Vehicles Industry in Europe Revenue Share (%), by Connectivity Type 2025 & 2033
- Figure 46: Asia Pacific Connected Vehicles Industry in Europe Revenue (billion), by Vehicle Connectivity Type 2025 & 2033
- Figure 47: Asia Pacific Connected Vehicles Industry in Europe Revenue Share (%), by Vehicle Connectivity Type 2025 & 2033
- Figure 48: Asia Pacific Connected Vehicles Industry in Europe Revenue (billion), by End-User Type 2025 & 2033
- Figure 49: Asia Pacific Connected Vehicles Industry in Europe Revenue Share (%), by End-User Type 2025 & 2033
- Figure 50: Asia Pacific Connected Vehicles Industry in Europe Revenue (billion), by Country 2025 & 2033
- Figure 51: Asia Pacific Connected Vehicles Industry in Europe Revenue Share (%), by Country 2025 & 2033
List of Tables
- Table 1: Global Connected Vehicles Industry in Europe Revenue billion Forecast, by Technology Type 2020 & 2033
- Table 2: Global Connected Vehicles Industry in Europe Revenue billion Forecast, by Connectivity Type 2020 & 2033
- Table 3: Global Connected Vehicles Industry in Europe Revenue billion Forecast, by Vehicle Connectivity Type 2020 & 2033
- Table 4: Global Connected Vehicles Industry in Europe Revenue billion Forecast, by End-User Type 2020 & 2033
- Table 5: Global Connected Vehicles Industry in Europe Revenue billion Forecast, by Region 2020 & 2033
- Table 6: Global Connected Vehicles Industry in Europe Revenue billion Forecast, by Technology Type 2020 & 2033
- Table 7: Global Connected Vehicles Industry in Europe Revenue billion Forecast, by Connectivity Type 2020 & 2033
- Table 8: Global Connected Vehicles Industry in Europe Revenue billion Forecast, by Vehicle Connectivity Type 2020 & 2033
- Table 9: Global Connected Vehicles Industry in Europe Revenue billion Forecast, by End-User Type 2020 & 2033
- Table 10: Global Connected Vehicles Industry in Europe Revenue billion Forecast, by Country 2020 & 2033
- Table 11: United States Connected Vehicles Industry in Europe Revenue (billion) Forecast, by Application 2020 & 2033
- Table 12: Canada Connected Vehicles Industry in Europe Revenue (billion) Forecast, by Application 2020 & 2033
- Table 13: Mexico Connected Vehicles Industry in Europe Revenue (billion) Forecast, by Application 2020 & 2033
- Table 14: Global Connected Vehicles Industry in Europe Revenue billion Forecast, by Technology Type 2020 & 2033
- Table 15: Global Connected Vehicles Industry in Europe Revenue billion Forecast, by Connectivity Type 2020 & 2033
- Table 16: Global Connected Vehicles Industry in Europe Revenue billion Forecast, by Vehicle Connectivity Type 2020 & 2033
- Table 17: Global Connected Vehicles Industry in Europe Revenue billion Forecast, by End-User Type 2020 & 2033
- Table 18: Global Connected Vehicles Industry in Europe Revenue billion Forecast, by Country 2020 & 2033
- Table 19: Brazil Connected Vehicles Industry in Europe Revenue (billion) Forecast, by Application 2020 & 2033
- Table 20: Argentina Connected Vehicles Industry in Europe Revenue (billion) Forecast, by Application 2020 & 2033
- Table 21: Rest of South America Connected Vehicles Industry in Europe Revenue (billion) Forecast, by Application 2020 & 2033
- Table 22: Global Connected Vehicles Industry in Europe Revenue billion Forecast, by Technology Type 2020 & 2033
- Table 23: Global Connected Vehicles Industry in Europe Revenue billion Forecast, by Connectivity Type 2020 & 2033
- Table 24: Global Connected Vehicles Industry in Europe Revenue billion Forecast, by Vehicle Connectivity Type 2020 & 2033
- Table 25: Global Connected Vehicles Industry in Europe Revenue billion Forecast, by End-User Type 2020 & 2033
- Table 26: Global Connected Vehicles Industry in Europe Revenue billion Forecast, by Country 2020 & 2033
- Table 27: United Kingdom Connected Vehicles Industry in Europe Revenue (billion) Forecast, by Application 2020 & 2033
- Table 28: Germany Connected Vehicles Industry in Europe Revenue (billion) Forecast, by Application 2020 & 2033
- Table 29: France Connected Vehicles Industry in Europe Revenue (billion) Forecast, by Application 2020 & 2033
- Table 30: Italy Connected Vehicles Industry in Europe Revenue (billion) Forecast, by Application 2020 & 2033
- Table 31: Spain Connected Vehicles Industry in Europe Revenue (billion) Forecast, by Application 2020 & 2033
- Table 32: Russia Connected Vehicles Industry in Europe Revenue (billion) Forecast, by Application 2020 & 2033
- Table 33: Benelux Connected Vehicles Industry in Europe Revenue (billion) Forecast, by Application 2020 & 2033
- Table 34: Nordics Connected Vehicles Industry in Europe Revenue (billion) Forecast, by Application 2020 & 2033
- Table 35: Rest of Europe Connected Vehicles Industry in Europe Revenue (billion) Forecast, by Application 2020 & 2033
- Table 36: Global Connected Vehicles Industry in Europe Revenue billion Forecast, by Technology Type 2020 & 2033
- Table 37: Global Connected Vehicles Industry in Europe Revenue billion Forecast, by Connectivity Type 2020 & 2033
- Table 38: Global Connected Vehicles Industry in Europe Revenue billion Forecast, by Vehicle Connectivity Type 2020 & 2033
- Table 39: Global Connected Vehicles Industry in Europe Revenue billion Forecast, by End-User Type 2020 & 2033
- Table 40: Global Connected Vehicles Industry in Europe Revenue billion Forecast, by Country 2020 & 2033
- Table 41: Turkey Connected Vehicles Industry in Europe Revenue (billion) Forecast, by Application 2020 & 2033
- Table 42: Israel Connected Vehicles Industry in Europe Revenue (billion) Forecast, by Application 2020 & 2033
- Table 43: GCC Connected Vehicles Industry in Europe Revenue (billion) Forecast, by Application 2020 & 2033
- Table 44: North Africa Connected Vehicles Industry in Europe Revenue (billion) Forecast, by Application 2020 & 2033
- Table 45: South Africa Connected Vehicles Industry in Europe Revenue (billion) Forecast, by Application 2020 & 2033
- Table 46: Rest of Middle East & Africa Connected Vehicles Industry in Europe Revenue (billion) Forecast, by Application 2020 & 2033
- Table 47: Global Connected Vehicles Industry in Europe Revenue billion Forecast, by Technology Type 2020 & 2033
- Table 48: Global Connected Vehicles Industry in Europe Revenue billion Forecast, by Connectivity Type 2020 & 2033
- Table 49: Global Connected Vehicles Industry in Europe Revenue billion Forecast, by Vehicle Connectivity Type 2020 & 2033
- Table 50: Global Connected Vehicles Industry in Europe Revenue billion Forecast, by End-User Type 2020 & 2033
- Table 51: Global Connected Vehicles Industry in Europe Revenue billion Forecast, by Country 2020 & 2033
- Table 52: China Connected Vehicles Industry in Europe Revenue (billion) Forecast, by Application 2020 & 2033
- Table 53: India Connected Vehicles Industry in Europe Revenue (billion) Forecast, by Application 2020 & 2033
- Table 54: Japan Connected Vehicles Industry in Europe Revenue (billion) Forecast, by Application 2020 & 2033
- Table 55: South Korea Connected Vehicles Industry in Europe Revenue (billion) Forecast, by Application 2020 & 2033
- Table 56: ASEAN Connected Vehicles Industry in Europe Revenue (billion) Forecast, by Application 2020 & 2033
- Table 57: Oceania Connected Vehicles Industry in Europe Revenue (billion) Forecast, by Application 2020 & 2033
- Table 58: Rest of Asia Pacific Connected Vehicles Industry in Europe Revenue (billion) Forecast, by Application 2020 & 2033
Frequently Asked Questions
1. What is the projected Compound Annual Growth Rate (CAGR) of the Connected Vehicles Industry in Europe?
The projected CAGR is approximately 19.8%.
2. Which companies are prominent players in the Connected Vehicles Industry in Europe?
Key companies in the market include Denso Corporation, Delphi Automotive LLP, Verizon Communicatio, Harman International, Diamler AG, Continental AG, Autoliv Inc, Robert Bosch GmbH, BMW Group, Audi AG.
3. What are the main segments of the Connected Vehicles Industry in Europe?
The market segments include Technology Type, Connectivity Type, Vehicle Connectivity Type, End-User Type.
4. Can you provide details about the market size?
The market size is estimated to be USD 119.27 billion as of 2022.
5. What are some drivers contributing to market growth?
Integration With Telematics And Fleet Management Systems; Others.
6. What are the notable trends driving market growth?
Introduction of 5G Network and Increased Use of IoT Applications.
7. Are there any restraints impacting market growth?
The Initial Costs Associated With Purchasing And Installing ELD Systems is High; Others.
8. Can you provide examples of recent developments in the market?
In May 2022, Volkswagen Group and SEAT SA announced their strategic vision to mobilize EUR 10 billion for electrifying Europe. Under this plan, companies will construct battery plants to fast forward goals with the 62 national and international companies, benchmark firms, and Transformation programs for electric and connected vehicles.
9. What pricing options are available for accessing the report?
Pricing options include single-user, multi-user, and enterprise licenses priced at USD 4750, USD 4950, and USD 6800 respectively.
10. Is the market size provided in terms of value or volume?
The market size is provided in terms of value, measured in billion.
11. Are there any specific market keywords associated with the report?
Yes, the market keyword associated with the report is "Connected Vehicles Industry in Europe," which aids in identifying and referencing the specific market segment covered.
12. How do I determine which pricing option suits my needs best?
The pricing options vary based on user requirements and access needs. Individual users may opt for single-user licenses, while businesses requiring broader access may choose multi-user or enterprise licenses for cost-effective access to the report.
13. Are there any additional resources or data provided in the Connected Vehicles Industry in Europe report?
While the report offers comprehensive insights, it's advisable to review the specific contents or supplementary materials provided to ascertain if additional resources or data are available.
14. How can I stay updated on further developments or reports in the Connected Vehicles Industry in Europe?
To stay informed about further developments, trends, and reports in the Connected Vehicles Industry in Europe, consider subscribing to industry newsletters, following relevant companies and organizations, or regularly checking reputable industry news sources and publications.
Methodology
Step 1 - Identification of Relevant Samples Size from Population Database


Step 2 - Approaches for Defining Global Market Size (Value, Volume* & Price*)

Note*: In applicable scenarios
Step 3 - Data Sources
Primary Research
- Web Analytics
- Survey Reports
- Research Institute
- Latest Research Reports
- Opinion Leaders
Secondary Research
- Annual Reports
- White Paper
- Latest Press Release
- Industry Association
- Paid Database
- Investor Presentations

Step 4 - Data Triangulation
Involves using different sources of information in order to increase the validity of a study
These sources are likely to be stakeholders in a program - participants, other researchers, program staff, other community members, and so on.
Then we put all data in single framework & apply various statistical tools to find out the dynamic on the market.
During the analysis stage, feedback from the stakeholder groups would be compared to determine areas of agreement as well as areas of divergence