

Key Insights
The global container terminal industry is experiencing robust growth, driven by the expansion of global trade, the rise of e-commerce, and increasing port infrastructure development. A CAGR exceeding 5% indicates a significant upward trajectory, projecting substantial market expansion from 2025 to 2033. Key segments, such as stevedoring and cargo handling & transportation, are experiencing particularly strong demand due to the ever-increasing volume of containerized goods. The industry is further segmented by cargo type, with crude oil and dry cargo representing major portions of the market. Leading players like PSA International, DP World, and APM Terminals are actively investing in port modernization and technological advancements to enhance efficiency and capacity. Geographic expansion is also a major trend, with regions like Asia-Pacific experiencing particularly rapid growth due to the concentration of manufacturing and export activities. However, challenges remain, including port congestion, geopolitical instability impacting trade routes, and the need for sustainable practices to mitigate environmental impact. The industry is likely to witness consolidation and strategic partnerships among existing players, and further technological adoption driving automation and optimization.
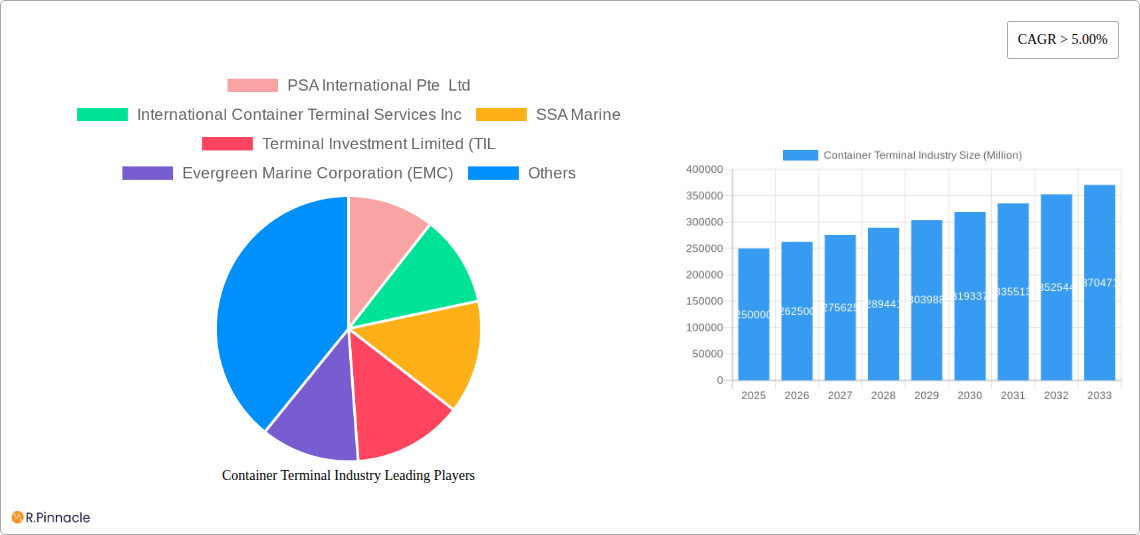
Container Terminal Industry Market Size (In Billion)
Competition within the container terminal industry is fierce, with established players continuously seeking to optimize operations and expand their global reach. The industry is characterized by high capital expenditure requirements, necessitating significant investments in infrastructure and technology. The increasing adoption of automation and digitalization, including AI-powered solutions for optimizing cargo flow and predictive maintenance, is reshaping the competitive landscape. Furthermore, the growing focus on environmental sustainability is prompting container terminal operators to adopt greener technologies and implement eco-friendly practices. This includes the utilization of alternative energy sources and the reduction of carbon emissions. Government regulations and policies aimed at promoting sustainable development are also influencing the industry's trajectory, creating both opportunities and challenges for stakeholders. The long-term outlook for the container terminal industry remains positive, driven by the continued growth of global trade and the ongoing investments in port infrastructure and technology.

Container Terminal Industry Company Market Share
Container Terminal Industry Market Report: 2019-2033
This comprehensive report provides an in-depth analysis of the global container terminal industry, offering invaluable insights for industry professionals, investors, and strategic decision-makers. With a study period spanning 2019-2033, a base year of 2025, and a forecast period of 2025-2033, this report meticulously examines market dynamics, competitive landscapes, and future growth trajectories. The report leverages detailed data analysis to predict a market size of xx Million by 2033, highlighting lucrative opportunities and potential challenges.
Container Terminal Industry Market Structure & Innovation Trends
The container terminal industry is characterized by a moderately concentrated market structure, with several major players controlling significant market share. Key players like PSA International Pte Ltd, International Container Terminal Services Inc, and DP World PLC dominate global operations. However, regional players and smaller operators also contribute significantly to the overall market. Market share dynamics are influenced by strategic mergers and acquisitions (M&A), with deal values reaching xx Million in recent years.
- Market Concentration: High, with top 5 players controlling approximately xx% of the global market.
- Innovation Drivers: Automation, digitization, and sustainable technologies are driving innovation.
- Regulatory Frameworks: Vary across regions, impacting operational efficiency and investment decisions.
- Product Substitutes: Limited direct substitutes exist, but alternative transportation modes (rail, road) present indirect competition.
- End-User Demographics: Primarily large shipping companies, importers, and exporters.
- M&A Activities: Significant M&A activity is observed, driven by expansion strategies and market consolidation. Recent deals have involved valuations in the range of xx Million to xx Million.
Container Terminal Industry Market Dynamics & Trends
The container terminal industry exhibits robust growth, driven by increasing global trade volumes, expanding port infrastructure, and technological advancements. The market is expected to witness a Compound Annual Growth Rate (CAGR) of xx% during the forecast period (2025-2033). This growth is fueled by factors such as the rise of e-commerce, global supply chain optimization efforts, and the increasing demand for efficient cargo handling solutions. Technological disruptions, including automation and data analytics, are transforming operational efficiencies and customer experiences. Competitive dynamics are shaped by price wars, service differentiation, and capacity expansion strategies. Market penetration of automated systems is expected to reach xx% by 2033.
Dominant Regions & Segments in Container Terminal Industry
Asia, particularly East Asia, remains the dominant region in the container terminal industry, driven by robust economic growth, significant port infrastructure development, and high trade volumes. Europe and North America also represent substantial market segments.
By Service:
- Stevedoring: Largest segment, driven by high demand for efficient cargo loading and unloading services.
- Cargo Handling & Transportation: Significant segment with growth driven by integrated logistics solutions.
- Others: Includes value-added services like warehousing and customs brokerage.
By Cargo Type:
- Dry Cargo: Largest segment, reflecting the dominance of manufactured goods and consumer products in global trade.
- Crude Oil: A substantial segment, though less dynamic compared to dry cargo.
- Other Liquid Cargo: This segment encompasses chemicals, gases, and other liquid products.
Key Drivers of Regional Dominance:
- Asia: Strong economic growth, vast port infrastructure, strategic location in global trade routes.
- Europe: Established infrastructure, proximity to major markets, robust regulatory frameworks.
- North America: Large consumer market, significant port capacities, integrated supply chains.
Container Terminal Industry Product Innovations
Recent innovations focus on automation, including automated guided vehicles (AGVs), automated stacking cranes (ASCs), and remote-controlled equipment. These technologies enhance efficiency, reduce operational costs, and improve safety. Data analytics and IoT solutions are also gaining traction, enabling real-time monitoring, predictive maintenance, and optimized resource allocation. The market sees a strong push towards eco-friendly operations and the integration of renewable energy sources into terminal operations.
Report Scope & Segmentation Analysis
This report comprehensively analyzes the container terminal industry across multiple segments:
By Service: Stevedoring, Cargo Handling & Transportation, Others. Each segment's growth trajectory is analyzed based on its market size, competitive landscape, and influencing factors. Growth projections for each segment are presented for the forecast period (2025-2033).
By Cargo Type: Crude Oil, Dry Cargo, Other Liquid Cargo. Each segment's market dynamics, growth potential, and competitive structure are detailed. Market size estimations and future growth projections are provided for each category.
Key Drivers of Container Terminal Industry Growth
The industry's growth is fueled by several factors: the continuous expansion of global trade, particularly e-commerce; increased investments in port infrastructure, including automation and modernization; government initiatives promoting efficient logistics; and rising demand for improved supply chain efficiency and reliability. Technological advancements in automation and data analytics also play a crucial role in optimizing operational efficiency and reducing costs.
Challenges in the Container Terminal Industry Sector
The industry faces challenges such as: high capital expenditure requirements for infrastructure development and automation; port congestion and delays; fluctuating fuel prices; environmental regulations and sustainability concerns, potentially leading to increased operational costs; and intense competition from existing and emerging players. These factors can impact profitability and overall market growth.
Emerging Opportunities in Container Terminal Industry
Emerging opportunities include: the increasing adoption of automation and digital technologies; growth in specialized cargo handling; expansion into new markets with developing infrastructure; and the potential for partnerships and collaborations to enhance efficiency and sustainability. Focusing on improving supply chain resilience and developing sustainable operational practices presents significant opportunities for growth.
Leading Players in the Container Terminal Industry Market
- PSA International Pte Ltd
- International Container Terminal Services Inc
- SSA Marine
- Terminal Investment Limited (TIL)
- Evergreen Marine Corporation (EMC)
- Hutchison Port Holdings Trust
- APM Terminals Management BV
- Dubai Ports World (DPW)
- DP World PLC
- China Merchants Port Holdings Co Ltd
- Eurogate Container Terminal Ltd
- AP Moller Maersk
Key Developments in Container Terminal Industry
- June 2022: AP Moller Maersk launched Maersk Coastal Connect, a new coastal service in New Zealand, deploying 2,500 TEU vessels and increasing capacity by 250,000 TEU annually.
- June 2022: TecPlata S.A. (ICTSI) partnered with Vessel S.A. to launch a weekly service between La Plata and Montevideo ports, expanding its reach across the Gulf Region, U.S. East Coast, Mediterranean, and Northern Europe.
Future Outlook for Container Terminal Industry Market
The container terminal industry is poised for continued growth, driven by the ongoing expansion of global trade, increased demand for efficient logistics solutions, and technological advancements. Strategic investments in infrastructure, automation, and digital technologies will shape the future of the industry. Companies focusing on sustainability, digitalization, and efficient operations will be best positioned for success in this dynamic market.
Container Terminal Industry Segmentation
-
1. Service
- 1.1. Stevedoring
- 1.2. Cargo Handling & Transportation
- 1.3. Others
-
2. Cargo Type
- 2.1. Crude Oil
- 2.2. Dry Cargo
- 2.3. Other Liquid Cargo
Container Terminal Industry Segmentation By Geography
-
1. North America
- 1.1. US
- 1.2. Canada
- 1.3. Mexico
-
2. Europe
- 2.1. Germany
- 2.2. UK
- 2.3. France
- 2.4. Russia
- 2.5. Spain
- 2.6. Rest of Europe
-
3. Asia Pacific
- 3.1. India
- 3.2. China
- 3.3. Japan
- 3.4. Singapore
- 3.5. Malaysia
- 3.6. South Korea
- 3.7. Australia
- 3.8. Rest Of Asia Pacific
-
4. South America
- 4.1. Brazil
- 4.2. Argentina
- 4.3. Rest of South America
- 5. Middle East
-
6. UAE
- 6.1. Saudi Arabia
- 6.2. South Africa
- 6.3. Rest of Middle East
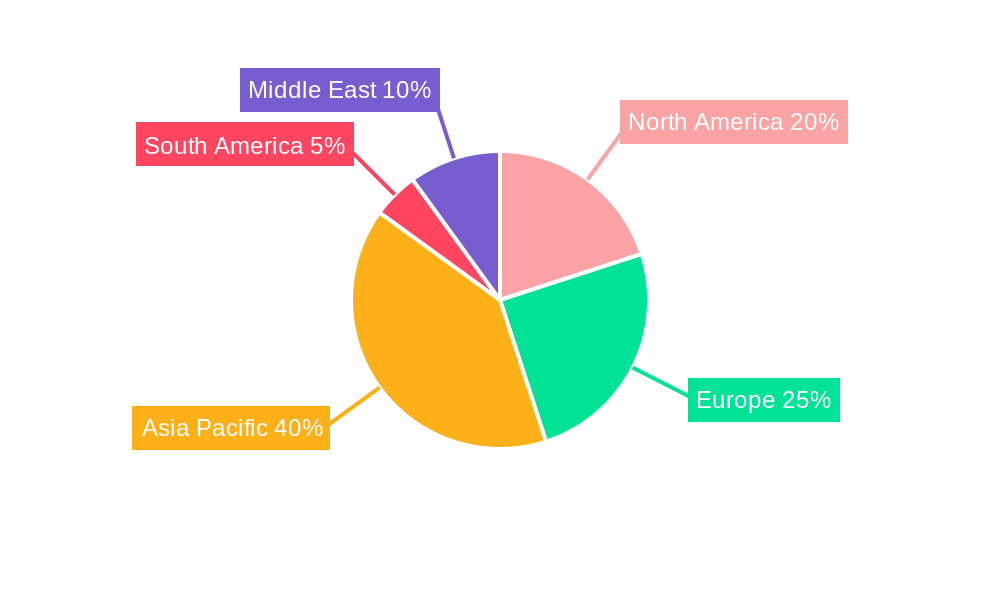
Container Terminal Industry Regional Market Share
Geographic Coverage of Container Terminal Industry
Container Terminal Industry REPORT HIGHLIGHTS
| Aspects | Details |
|---|---|
| Study Period | 2020-2034 |
| Base Year | 2025 |
| Estimated Year | 2026 |
| Forecast Period | 2026-2034 |
| Historical Period | 2020-2025 |
| Growth Rate | CAGR of 8.4% from 2020-2034 |
| Segmentation |
|
Table of Contents
- 1. Introduction
- 1.1. Research Scope
- 1.2. Market Segmentation
- 1.3. Research Objective
- 1.4. Definitions and Assumptions
- 2. Executive Summary
- 2.1. Market Snapshot
- 3. Market Dynamics
- 3.1. Market Drivers
- 3.2. Market Restrains
- 3.3. Market Trends
- 3.4. Market Opportunities
- 4. Market Factor Analysis
- 4.1. Porters Five Forces
- 4.1.1. Bargaining Power of Suppliers
- 4.1.2. Bargaining Power of Buyers
- 4.1.3. Threat of New Entrants
- 4.1.4. Threat of Substitutes
- 4.1.5. Competitive Rivalry
- 4.2. PESTEL analysis
- 4.3. BCG Analysis
- 4.3.1. Stars (High Growth, High Market Share)
- 4.3.2. Cash Cows (Low Growth, High Market Share)
- 4.3.3. Question Mark (High Growth, Low Market Share)
- 4.3.4. Dogs (Low Growth, Low Market Share)
- 4.4. Ansoff Matrix Analysis
- 4.5. Supply Chain Analysis
- 4.6. Regulatory Landscape
- 4.7. Current Market Potential and Opportunity Assessment (TAM–SAM–SOM Framework)
- 4.8. PRI Analyst Note
- 4.1. Porters Five Forces
- 5. Market Analysis, Insights and Forecast 2021-2033
- 5.1. Market Analysis, Insights and Forecast - by Service
- 5.1.1. Stevedoring
- 5.1.2. Cargo Handling & Transportation
- 5.1.3. Others
- 5.2. Market Analysis, Insights and Forecast - by Cargo Type
- 5.2.1. Crude Oil
- 5.2.2. Dry Cargo
- 5.2.3. Other Liquid Cargo
- 5.3. Market Analysis, Insights and Forecast - by Region
- 5.3.1. North America
- 5.3.2. Europe
- 5.3.3. Asia Pacific
- 5.3.4. South America
- 5.3.5. Middle East
- 5.3.6. UAE
- 5.1. Market Analysis, Insights and Forecast - by Service
- 6. Global Container Terminal Industry Analysis, Insights and Forecast, 2021-2033
- 6.1. Market Analysis, Insights and Forecast - by Service
- 6.1.1. Stevedoring
- 6.1.2. Cargo Handling & Transportation
- 6.1.3. Others
- 6.2. Market Analysis, Insights and Forecast - by Cargo Type
- 6.2.1. Crude Oil
- 6.2.2. Dry Cargo
- 6.2.3. Other Liquid Cargo
- 6.1. Market Analysis, Insights and Forecast - by Service
- 7. North America Container Terminal Industry Analysis, Insights and Forecast, 2020-2032
- 7.1. Market Analysis, Insights and Forecast - by Service
- 7.1.1. Stevedoring
- 7.1.2. Cargo Handling & Transportation
- 7.1.3. Others
- 7.2. Market Analysis, Insights and Forecast - by Cargo Type
- 7.2.1. Crude Oil
- 7.2.2. Dry Cargo
- 7.2.3. Other Liquid Cargo
- 7.1. Market Analysis, Insights and Forecast - by Service
- 8. Europe Container Terminal Industry Analysis, Insights and Forecast, 2020-2032
- 8.1. Market Analysis, Insights and Forecast - by Service
- 8.1.1. Stevedoring
- 8.1.2. Cargo Handling & Transportation
- 8.1.3. Others
- 8.2. Market Analysis, Insights and Forecast - by Cargo Type
- 8.2.1. Crude Oil
- 8.2.2. Dry Cargo
- 8.2.3. Other Liquid Cargo
- 8.1. Market Analysis, Insights and Forecast - by Service
- 9. Asia Pacific Container Terminal Industry Analysis, Insights and Forecast, 2020-2032
- 9.1. Market Analysis, Insights and Forecast - by Service
- 9.1.1. Stevedoring
- 9.1.2. Cargo Handling & Transportation
- 9.1.3. Others
- 9.2. Market Analysis, Insights and Forecast - by Cargo Type
- 9.2.1. Crude Oil
- 9.2.2. Dry Cargo
- 9.2.3. Other Liquid Cargo
- 9.1. Market Analysis, Insights and Forecast - by Service
- 10. South America Container Terminal Industry Analysis, Insights and Forecast, 2020-2032
- 10.1. Market Analysis, Insights and Forecast - by Service
- 10.1.1. Stevedoring
- 10.1.2. Cargo Handling & Transportation
- 10.1.3. Others
- 10.2. Market Analysis, Insights and Forecast - by Cargo Type
- 10.2.1. Crude Oil
- 10.2.2. Dry Cargo
- 10.2.3. Other Liquid Cargo
- 10.1. Market Analysis, Insights and Forecast - by Service
- 11. Middle East Container Terminal Industry Analysis, Insights and Forecast, 2020-2032
- 11.1. Market Analysis, Insights and Forecast - by Service
- 11.1.1. Stevedoring
- 11.1.2. Cargo Handling & Transportation
- 11.1.3. Others
- 11.2. Market Analysis, Insights and Forecast - by Cargo Type
- 11.2.1. Crude Oil
- 11.2.2. Dry Cargo
- 11.2.3. Other Liquid Cargo
- 11.1. Market Analysis, Insights and Forecast - by Service
- 12. UAE Container Terminal Industry Analysis, Insights and Forecast, 2020-2032
- 12.1. Market Analysis, Insights and Forecast - by Service
- 12.1.1. Stevedoring
- 12.1.2. Cargo Handling & Transportation
- 12.1.3. Others
- 12.2. Market Analysis, Insights and Forecast - by Cargo Type
- 12.2.1. Crude Oil
- 12.2.2. Dry Cargo
- 12.2.3. Other Liquid Cargo
- 12.1. Market Analysis, Insights and Forecast - by Service
- 13. Competitive Analysis
- 13.1. Company Profiles
- 13.1.1 PSA International Pte Ltd
- 13.1.1.1. Company Overview
- 13.1.1.2. Products
- 13.1.1.3. Company Financials
- 13.1.1.4. SWOT Analysis
- 13.1.2 International Container Terminal Services Inc
- 13.1.2.1. Company Overview
- 13.1.2.2. Products
- 13.1.2.3. Company Financials
- 13.1.2.4. SWOT Analysis
- 13.1.3 SSA Marine
- 13.1.3.1. Company Overview
- 13.1.3.2. Products
- 13.1.3.3. Company Financials
- 13.1.3.4. SWOT Analysis
- 13.1.4 Terminal Investment Limited (TIL
- 13.1.4.1. Company Overview
- 13.1.4.2. Products
- 13.1.4.3. Company Financials
- 13.1.4.4. SWOT Analysis
- 13.1.5 Evergreen Marine Corporation (EMC)
- 13.1.5.1. Company Overview
- 13.1.5.2. Products
- 13.1.5.3. Company Financials
- 13.1.5.4. SWOT Analysis
- 13.1.6 Hutchison Port Holdings Trust
- 13.1.6.1. Company Overview
- 13.1.6.2. Products
- 13.1.6.3. Company Financials
- 13.1.6.4. SWOT Analysis
- 13.1.7 APM Terminals Management BV**List Not Exhaustive
- 13.1.7.1. Company Overview
- 13.1.7.2. Products
- 13.1.7.3. Company Financials
- 13.1.7.4. SWOT Analysis
- 13.1.8 Dubai Ports World (DPW)
- 13.1.8.1. Company Overview
- 13.1.8.2. Products
- 13.1.8.3. Company Financials
- 13.1.8.4. SWOT Analysis
- 13.1.9 DP World PLC
- 13.1.9.1. Company Overview
- 13.1.9.2. Products
- 13.1.9.3. Company Financials
- 13.1.9.4. SWOT Analysis
- 13.1.10 China Merchants Port Holdings Co Ltd
- 13.1.10.1. Company Overview
- 13.1.10.2. Products
- 13.1.10.3. Company Financials
- 13.1.10.4. SWOT Analysis
- 13.1.11 Eurogate Container Terminal Ltd
- 13.1.11.1. Company Overview
- 13.1.11.2. Products
- 13.1.11.3. Company Financials
- 13.1.11.4. SWOT Analysis
- 13.1.12 AP Moller Maersk
- 13.1.12.1. Company Overview
- 13.1.12.2. Products
- 13.1.12.3. Company Financials
- 13.1.12.4. SWOT Analysis
- 13.1.1 PSA International Pte Ltd
- 13.2. Market Entropy
- 13.2.1 Company's Key Areas Served
- 13.2.2 Recent Developments
- 13.3. Company Market Share Analysis 2025
- 13.3.1 Top 5 Companies Market Share Analysis
- 13.3.2 Top 3 Companies Market Share Analysis
- 13.4. List of Potential Customers
- 14. Research Methodology
List of Figures
- Figure 1: Global Container Terminal Industry Revenue Breakdown (million, %) by Region 2025 & 2033
- Figure 2: North America Container Terminal Industry Revenue (million), by Service 2025 & 2033
- Figure 3: North America Container Terminal Industry Revenue Share (%), by Service 2025 & 2033
- Figure 4: North America Container Terminal Industry Revenue (million), by Cargo Type 2025 & 2033
- Figure 5: North America Container Terminal Industry Revenue Share (%), by Cargo Type 2025 & 2033
- Figure 6: North America Container Terminal Industry Revenue (million), by Country 2025 & 2033
- Figure 7: North America Container Terminal Industry Revenue Share (%), by Country 2025 & 2033
- Figure 8: Europe Container Terminal Industry Revenue (million), by Service 2025 & 2033
- Figure 9: Europe Container Terminal Industry Revenue Share (%), by Service 2025 & 2033
- Figure 10: Europe Container Terminal Industry Revenue (million), by Cargo Type 2025 & 2033
- Figure 11: Europe Container Terminal Industry Revenue Share (%), by Cargo Type 2025 & 2033
- Figure 12: Europe Container Terminal Industry Revenue (million), by Country 2025 & 2033
- Figure 13: Europe Container Terminal Industry Revenue Share (%), by Country 2025 & 2033
- Figure 14: Asia Pacific Container Terminal Industry Revenue (million), by Service 2025 & 2033
- Figure 15: Asia Pacific Container Terminal Industry Revenue Share (%), by Service 2025 & 2033
- Figure 16: Asia Pacific Container Terminal Industry Revenue (million), by Cargo Type 2025 & 2033
- Figure 17: Asia Pacific Container Terminal Industry Revenue Share (%), by Cargo Type 2025 & 2033
- Figure 18: Asia Pacific Container Terminal Industry Revenue (million), by Country 2025 & 2033
- Figure 19: Asia Pacific Container Terminal Industry Revenue Share (%), by Country 2025 & 2033
- Figure 20: South America Container Terminal Industry Revenue (million), by Service 2025 & 2033
- Figure 21: South America Container Terminal Industry Revenue Share (%), by Service 2025 & 2033
- Figure 22: South America Container Terminal Industry Revenue (million), by Cargo Type 2025 & 2033
- Figure 23: South America Container Terminal Industry Revenue Share (%), by Cargo Type 2025 & 2033
- Figure 24: South America Container Terminal Industry Revenue (million), by Country 2025 & 2033
- Figure 25: South America Container Terminal Industry Revenue Share (%), by Country 2025 & 2033
- Figure 26: Middle East Container Terminal Industry Revenue (million), by Service 2025 & 2033
- Figure 27: Middle East Container Terminal Industry Revenue Share (%), by Service 2025 & 2033
- Figure 28: Middle East Container Terminal Industry Revenue (million), by Cargo Type 2025 & 2033
- Figure 29: Middle East Container Terminal Industry Revenue Share (%), by Cargo Type 2025 & 2033
- Figure 30: Middle East Container Terminal Industry Revenue (million), by Country 2025 & 2033
- Figure 31: Middle East Container Terminal Industry Revenue Share (%), by Country 2025 & 2033
- Figure 32: UAE Container Terminal Industry Revenue (million), by Service 2025 & 2033
- Figure 33: UAE Container Terminal Industry Revenue Share (%), by Service 2025 & 2033
- Figure 34: UAE Container Terminal Industry Revenue (million), by Cargo Type 2025 & 2033
- Figure 35: UAE Container Terminal Industry Revenue Share (%), by Cargo Type 2025 & 2033
- Figure 36: UAE Container Terminal Industry Revenue (million), by Country 2025 & 2033
- Figure 37: UAE Container Terminal Industry Revenue Share (%), by Country 2025 & 2033
List of Tables
- Table 1: Global Container Terminal Industry Revenue million Forecast, by Service 2020 & 2033
- Table 2: Global Container Terminal Industry Revenue million Forecast, by Cargo Type 2020 & 2033
- Table 3: Global Container Terminal Industry Revenue million Forecast, by Region 2020 & 2033
- Table 4: Global Container Terminal Industry Revenue million Forecast, by Service 2020 & 2033
- Table 5: Global Container Terminal Industry Revenue million Forecast, by Cargo Type 2020 & 2033
- Table 6: Global Container Terminal Industry Revenue million Forecast, by Country 2020 & 2033
- Table 7: US Container Terminal Industry Revenue (million) Forecast, by Application 2020 & 2033
- Table 8: Canada Container Terminal Industry Revenue (million) Forecast, by Application 2020 & 2033
- Table 9: Mexico Container Terminal Industry Revenue (million) Forecast, by Application 2020 & 2033
- Table 10: Global Container Terminal Industry Revenue million Forecast, by Service 2020 & 2033
- Table 11: Global Container Terminal Industry Revenue million Forecast, by Cargo Type 2020 & 2033
- Table 12: Global Container Terminal Industry Revenue million Forecast, by Country 2020 & 2033
- Table 13: Germany Container Terminal Industry Revenue (million) Forecast, by Application 2020 & 2033
- Table 14: UK Container Terminal Industry Revenue (million) Forecast, by Application 2020 & 2033
- Table 15: France Container Terminal Industry Revenue (million) Forecast, by Application 2020 & 2033
- Table 16: Russia Container Terminal Industry Revenue (million) Forecast, by Application 2020 & 2033
- Table 17: Spain Container Terminal Industry Revenue (million) Forecast, by Application 2020 & 2033
- Table 18: Rest of Europe Container Terminal Industry Revenue (million) Forecast, by Application 2020 & 2033
- Table 19: Global Container Terminal Industry Revenue million Forecast, by Service 2020 & 2033
- Table 20: Global Container Terminal Industry Revenue million Forecast, by Cargo Type 2020 & 2033
- Table 21: Global Container Terminal Industry Revenue million Forecast, by Country 2020 & 2033
- Table 22: India Container Terminal Industry Revenue (million) Forecast, by Application 2020 & 2033
- Table 23: China Container Terminal Industry Revenue (million) Forecast, by Application 2020 & 2033
- Table 24: Japan Container Terminal Industry Revenue (million) Forecast, by Application 2020 & 2033
- Table 25: Singapore Container Terminal Industry Revenue (million) Forecast, by Application 2020 & 2033
- Table 26: Malaysia Container Terminal Industry Revenue (million) Forecast, by Application 2020 & 2033
- Table 27: South Korea Container Terminal Industry Revenue (million) Forecast, by Application 2020 & 2033
- Table 28: Australia Container Terminal Industry Revenue (million) Forecast, by Application 2020 & 2033
- Table 29: Rest Of Asia Pacific Container Terminal Industry Revenue (million) Forecast, by Application 2020 & 2033
- Table 30: Global Container Terminal Industry Revenue million Forecast, by Service 2020 & 2033
- Table 31: Global Container Terminal Industry Revenue million Forecast, by Cargo Type 2020 & 2033
- Table 32: Global Container Terminal Industry Revenue million Forecast, by Country 2020 & 2033
- Table 33: Brazil Container Terminal Industry Revenue (million) Forecast, by Application 2020 & 2033
- Table 34: Argentina Container Terminal Industry Revenue (million) Forecast, by Application 2020 & 2033
- Table 35: Rest of South America Container Terminal Industry Revenue (million) Forecast, by Application 2020 & 2033
- Table 36: Global Container Terminal Industry Revenue million Forecast, by Service 2020 & 2033
- Table 37: Global Container Terminal Industry Revenue million Forecast, by Cargo Type 2020 & 2033
- Table 38: Global Container Terminal Industry Revenue million Forecast, by Country 2020 & 2033
- Table 39: Global Container Terminal Industry Revenue million Forecast, by Service 2020 & 2033
- Table 40: Global Container Terminal Industry Revenue million Forecast, by Cargo Type 2020 & 2033
- Table 41: Global Container Terminal Industry Revenue million Forecast, by Country 2020 & 2033
- Table 42: Saudi Arabia Container Terminal Industry Revenue (million) Forecast, by Application 2020 & 2033
- Table 43: South Africa Container Terminal Industry Revenue (million) Forecast, by Application 2020 & 2033
- Table 44: Rest of Middle East Container Terminal Industry Revenue (million) Forecast, by Application 2020 & 2033
Frequently Asked Questions
1. What is the projected Compound Annual Growth Rate (CAGR) of the Container Terminal Industry?
The projected CAGR is approximately 8.4%.
2. Which companies are prominent players in the Container Terminal Industry?
Key companies in the market include PSA International Pte Ltd, International Container Terminal Services Inc, SSA Marine, Terminal Investment Limited (TIL, Evergreen Marine Corporation (EMC), Hutchison Port Holdings Trust, APM Terminals Management BV**List Not Exhaustive, Dubai Ports World (DPW), DP World PLC, China Merchants Port Holdings Co Ltd, Eurogate Container Terminal Ltd, AP Moller Maersk.
3. What are the main segments of the Container Terminal Industry?
The market segments include Service, Cargo Type.
4. Can you provide details about the market size?
The market size is estimated to be USD 1793.8 million as of 2022.
5. What are some drivers contributing to market growth?
Increase in global trade activites; Increase in infrastrustrure and construction.
6. What are the notable trends driving market growth?
Rise in Container Seaborne Trade is a Major Driver.
7. Are there any restraints impacting market growth?
Long distances and sometimes difficult terrain can contribute to increased transportation costs.
8. Can you provide examples of recent developments in the market?
On 15 June 2022, One of the leading player, AP Mollar Maersk announced it's expansion in New Zealand. Maersk is launching a new dedicated New Zealand coastal service - 'Maersk Coastal Connect', to enable a more resilient New Zealand supply chain and improve vessel schedule reliability. By deploying two 2,500 TEU container vessels, Maersk Nadi and Maersk Nansha on a weekly basis, five main ports in New Zealand, namely Timaru, Lyttelton, Nelson, Auckland and Tauranga will be called respectively in the service rotation, enhancing connectivity and providing easy access to Maersk's global network. The combined North to South and South to North capacity will reach 250,000 TEU each year. Maersk Coastal Connect will start on the 12th of July 2022. The service will be operated with New Zealand crew to support the local community and ensure continued to investment in New Zealand.
9. What pricing options are available for accessing the report?
Pricing options include single-user, multi-user, and enterprise licenses priced at USD 4750, USD 5250, and USD 8750 respectively.
10. Is the market size provided in terms of value or volume?
The market size is provided in terms of value, measured in million.
11. Are there any specific market keywords associated with the report?
Yes, the market keyword associated with the report is "Container Terminal Industry," which aids in identifying and referencing the specific market segment covered.
12. How do I determine which pricing option suits my needs best?
The pricing options vary based on user requirements and access needs. Individual users may opt for single-user licenses, while businesses requiring broader access may choose multi-user or enterprise licenses for cost-effective access to the report.
13. Are there any additional resources or data provided in the Container Terminal Industry report?
While the report offers comprehensive insights, it's advisable to review the specific contents or supplementary materials provided to ascertain if additional resources or data are available.
14. How can I stay updated on further developments or reports in the Container Terminal Industry?
To stay informed about further developments, trends, and reports in the Container Terminal Industry, consider subscribing to industry newsletters, following relevant companies and organizations, or regularly checking reputable industry news sources and publications.
Methodology
Step 1 - Identification of Relevant Samples Size from Population Database


Step 2 - Approaches for Defining Global Market Size (Value, Volume* & Price*)

Note*: In applicable scenarios
Step 3 - Data Sources
Primary Research
- Web Analytics
- Survey Reports
- Research Institute
- Latest Research Reports
- Opinion Leaders
Secondary Research
- Annual Reports
- White Paper
- Latest Press Release
- Industry Association
- Paid Database
- Investor Presentations

Step 4 - Data Triangulation
Involves using different sources of information in order to increase the validity of a study
These sources are likely to be stakeholders in a program - participants, other researchers, program staff, other community members, and so on.
Then we put all data in single framework & apply various statistical tools to find out the dynamic on the market.
During the analysis stage, feedback from the stakeholder groups would be compared to determine areas of agreement as well as areas of divergence