

Key Insights
The Controllable Pitch Marine Propeller (CPMP) market is poised for substantial growth, driven by the escalating demand for fuel-efficient and highly maneuverable vessels across diverse maritime applications. With an estimated market size of $4.85 billion in the base year 2025, the CPMP sector is projected to expand at a robust Compound Annual Growth Rate (CAGR) of 8.3% from 2025 to 2033. This upward trend is underpinned by several critical factors. The increasing integration of CPMPs in passenger vessels underscores a growing emphasis on passenger comfort and optimized fuel consumption. Concurrently, the commercial and cargo vessel segment is experiencing significant adoption, necessitated by the pursuit of enhanced performance and reduced operational expenditures amidst volatile fuel prices and stringent environmental mandates. Continuous technological advancements in propeller design, control systems, and durability are further fueling market expansion. The market segmentation by blade configuration, including two-three, four, and five-blade propellers, illustrates the varied application requirements, with four and five-blade variants anticipated to gain prominence due to their superior performance characteristics in specific vessel types. Geographically, North America, Europe, and Asia-Pacific represent key markets, with emerging economies in the Rest of the World also contributing to the overall growth dynamic. Leading industry players such as Rolls Royce, Wärtsilä, and Caterpillar are actively shaping the market landscape through strategic innovation and collaborations.
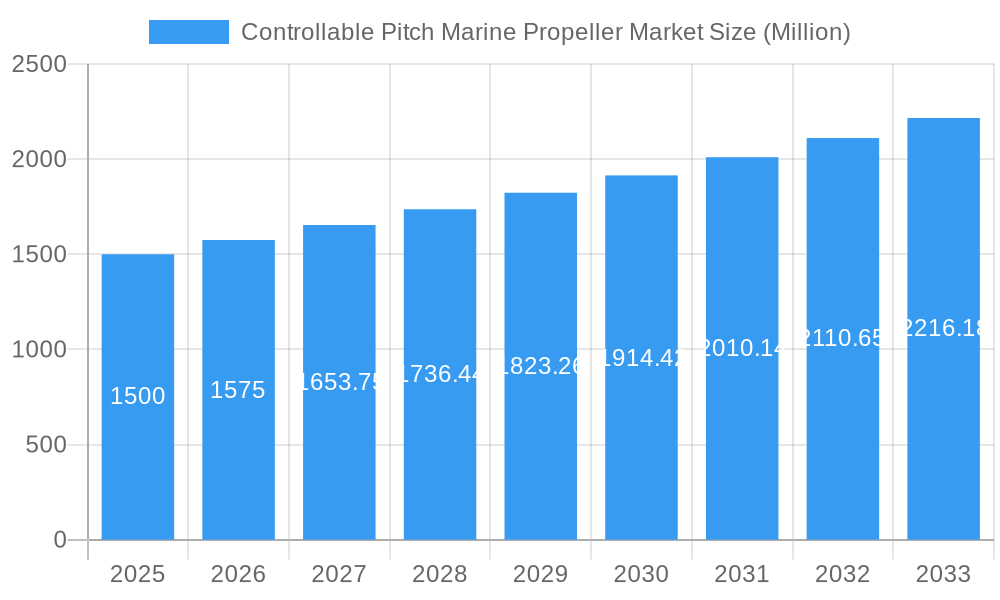
Controllable Pitch Marine Propeller Market Market Size (In Billion)
While the CPMP market exhibits strong growth potential, certain challenges may temper its trajectory. Stringent regulatory frameworks governing vessel emissions and the considerable upfront investment associated with CPMP systems represent potential constraints. However, the long-term advantages of improved fuel efficiency and enhanced maneuverability are expected to eclipse these impediments. The sustained expansion of global shipping activities and the growing imperative for eco-friendly maritime solutions will likely support continued market growth throughout the forecast period. Further diversification within ship types, including tug and push boats, ferries, and icebreakers, presents opportunities for the development of specialized propeller designs and niche market penetration. Anticipated increases in competitive intensity will stem from existing players' investments in research and development and the emergence of new market entrants seeking to capitalize on this promising sector.
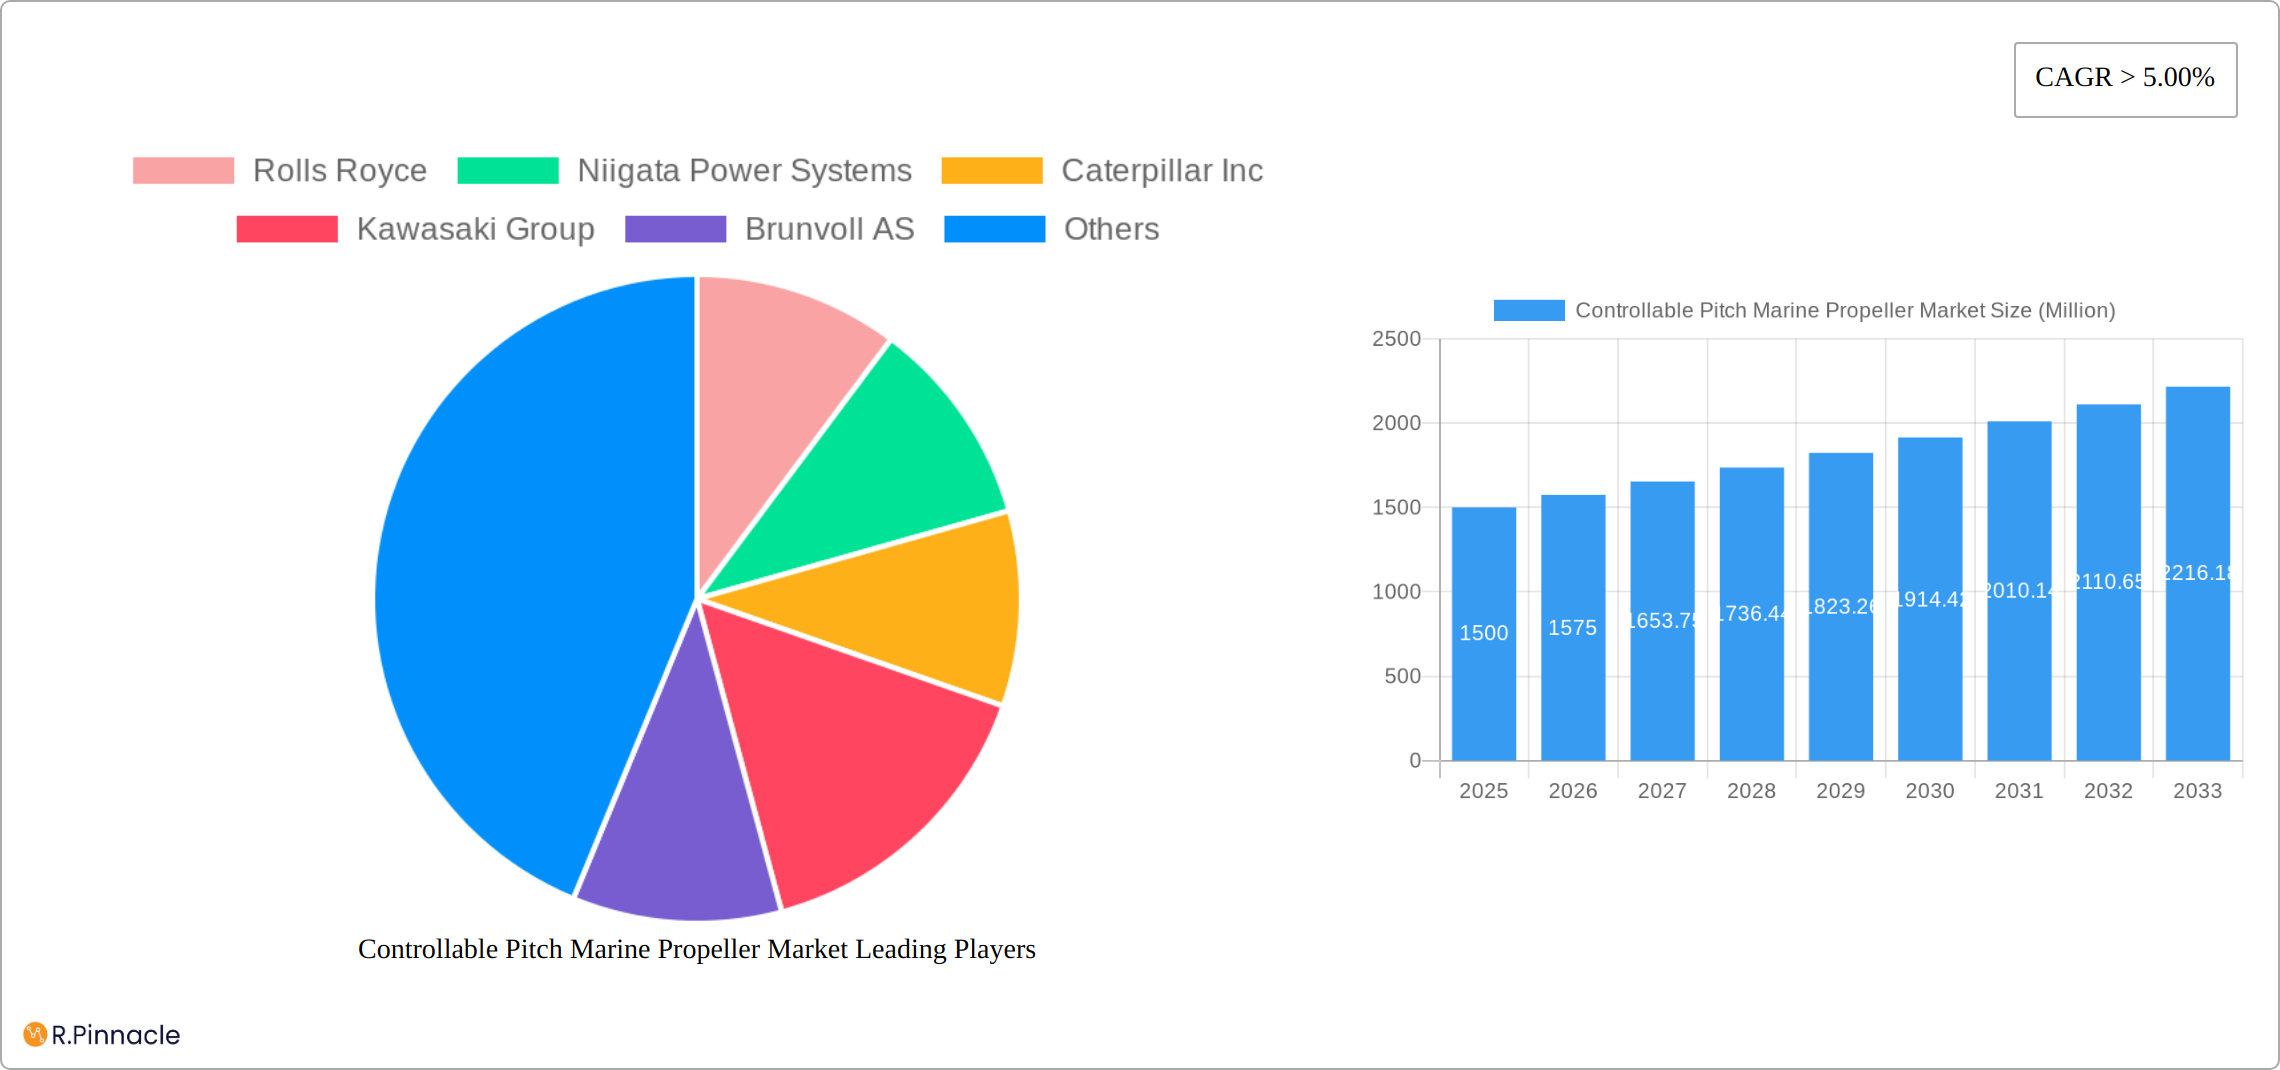
Controllable Pitch Marine Propeller Market Company Market Share
Controllable Pitch Marine Propeller Market: A Comprehensive Report (2019-2033)
This comprehensive report provides an in-depth analysis of the Controllable Pitch Marine Propeller market, offering valuable insights for industry professionals, investors, and strategic decision-makers. The study covers the period from 2019 to 2033, with 2025 serving as the base and estimated year. The report meticulously examines market segmentation, competitive dynamics, technological advancements, and growth opportunities, providing a clear roadmap for navigating this evolving market landscape. The market is expected to reach xx Million by 2033, exhibiting a CAGR of xx% during the forecast period (2025-2033).
Controllable Pitch Marine Propeller Market Market Structure & Innovation Trends
This section dissects the controllable pitch marine propeller market's structure, emphasizing key trends driving innovation. The competitive landscape is meticulously examined, revealing the market share distribution among leading players such as Rolls Royce, Niigata Power Systems, Caterpillar Inc., Kawasaki Group, Brunvoll AS, and Wärtsilä. The report investigates market concentration, identifying the presence of both established industry giants and emerging, innovative companies. Innovation is explored through the lens of technological advancements, evolving regulatory landscapes, and the development of alternative propulsion technologies. The analysis delves into the strategic implications of these factors, providing valuable insights for stakeholders.
- Market Concentration and Competitive Dynamics: The market demonstrates a moderately concentrated structure, with the top five players holding an estimated [Insert Updated Percentage]% market share in 2025. However, the emergence of innovative smaller companies presents a dynamic competitive landscape. [Optional: Add a brief description of the competitive strategies used by key players - e.g., focus on R&D, cost leadership, etc.]
- Innovation Drivers: Stringent emission regulations, the relentless pursuit of fuel efficiency improvements, and advancements in materials science (e.g., the use of lighter and stronger composite materials) are pivotal drivers of innovation. Furthermore, the drive for enhanced operational efficiency and reduced maintenance costs is influencing propeller design.
- Regulatory Frameworks and Their Impact: International Maritime Organization (IMO) regulations on greenhouse gas emissions are profoundly influential, shaping propeller design and accelerating the adoption of new technologies. Compliance with these regulations is a key market driver, pushing companies to develop more sustainable propulsion solutions.
- Alternative Propulsion Systems and Competitive Pressure: While controllable pitch propellers retain market dominance, alternative propulsion systems, such as electric and hybrid propulsion, present a degree of competitive pressure. Although their current market penetration is limited, their potential for future growth necessitates careful consideration by established players.
- End-User Demographics and Market Segmentation: The market is predominantly driven by commercial and passenger vessel operators. However, growing demand from specialized segments like tug and push boats, icebreakers, and specialized offshore vessels presents unique opportunities for tailored propeller designs.
- Mergers, Acquisitions, and Strategic Alliances: The report provides a comprehensive analysis of recent mergers and acquisitions (M&A) activity, highlighting their impact on market consolidation, technological advancements, and the overall competitive landscape. The total M&A deal value in the sector between 2019 and 2024 is estimated at [Insert Updated Value] Million. [Optional: Mention specific examples of significant M&A deals and their implications]
Controllable Pitch Marine Propeller Market Market Dynamics & Trends
This section delves into the market dynamics, focusing on factors influencing its growth trajectory. We analyze market growth drivers, technological disruptions, evolving consumer preferences, and the intensity of competitive dynamics. The report explores the impact of various macroeconomic factors and their influence on market expansion. Specific metrics, including CAGR and market penetration rates for different propeller types and applications, are provided. The detailed analysis helps readers understand the multifaceted nature of market evolution and allows for informed strategic planning.
Dominant Regions & Segments in Controllable Pitch Marine Propeller Market
This section identifies the leading geographical regions and market segments within the controllable pitch marine propeller market. Detailed analysis of dominance is coupled with factors driving growth in these regions/segments.
By Number of Blades:
- Four Blades: This segment holds the largest market share due to its superior efficiency in various vessel types.
- Two and Three Blades: This segment is characterized by its suitability for smaller vessels and niche applications.
- Five Blades: This segment represents a smaller share but is growing due to its potential for enhanced fuel efficiency in specific vessel types.
By Application:
- Commercial/Cargo Vessels: This segment dominates the market due to the large number of cargo ships requiring efficient propulsion systems.
- Passenger Vessels: This segment shows steady growth, driven by increasing passenger traffic and the demand for fuel-efficient cruise ships and ferries.
By Ship Type:
- Tug and Push Boats: This segment demonstrates strong growth potential due to the increasing demand for efficient towing operations.
- Ferries: This segment is characterized by a high demand for reliable and fuel-efficient propulsion systems.
- Ice Breakers: This specialized segment demands robust and highly efficient propeller designs capable of navigating challenging ice conditions.
Key Drivers (Examples):
- Strong economic growth in key maritime nations driving increased shipbuilding activity.
- Government incentives and subsidies promoting the adoption of energy-efficient technologies.
- Development of robust port infrastructure supporting larger vessels and increased shipping volume.
Controllable Pitch Marine Propeller Market Product Innovations
Recent years have witnessed significant product innovations in controllable pitch marine propellers. Manufacturers are focusing on enhancing efficiency, reducing fuel consumption, and improving operational reliability. This includes the development of advanced materials, optimized blade designs, and integrated control systems. The market is increasingly driven by the demand for environmentally friendly solutions, with manufacturers developing propellers that minimize underwater radiated noise and reduce greenhouse gas emissions. This continuous innovation caters to the evolving needs of the maritime industry, shaping the competitive landscape and influencing market growth.
Report Scope & Segmentation Analysis
This report provides a comprehensive segmentation analysis of the controllable pitch marine propeller market, encompassing various parameters including the number of blades, application, and ship type.
By Number of Blades: The market is segmented into two and three blades, four blades, and five blades, each exhibiting unique characteristics and applications.
By Application: The market is segmented by passenger vessels and commercial/cargo vessels, reflecting the different operational requirements and vessel characteristics.
By Ship Type: The report details the market segmentation by tug and push boats, ferries, icebreakers, and other ship types, providing a granular understanding of the diverse applications of controllable pitch propellers.
Key Drivers of Controllable Pitch Marine Propeller Market Growth
Several factors contribute to the market's growth. These include increasing global trade and shipping volumes, stricter environmental regulations promoting fuel efficiency, and technological advancements leading to improved propeller designs. Growing demand for efficient propulsion systems in various vessel types further fuels market expansion.
Challenges in the Controllable Pitch Marine Propeller Market Sector
The market faces challenges such as high initial investment costs for advanced propeller systems, fluctuating raw material prices impacting manufacturing costs, and intense competition among established players. Furthermore, the complexity of propeller designs and the need for specialized maintenance can pose obstacles to wider adoption. These factors influence market growth and adoption rates of new technologies.
Emerging Opportunities in Controllable Pitch Marine Propeller Market
Emerging opportunities lie in the development of advanced materials, such as lightweight composites, leading to higher efficiency and reduced fuel consumption. Furthermore, the growing adoption of hybrid and electric propulsion systems presents potential for integration with controllable pitch propellers, creating new market segments.
Leading Players in the Controllable Pitch Marine Propeller Market Market
- Rolls Royce
- Niigata Power Systems
- Caterpillar Inc
- Kawasaki Group
- Brunvoll AS
- Wärtsilä
Key Developments in Controllable Pitch Marine Propeller Market Industry
- March 2022: Wärtsilä signed a long-term service agreement with Brittany Ferries for its new LNG-fueled ferry, highlighting the growing importance of environmentally friendly solutions.
- December 2020: China State Shipbuilding Corporation (CSSC) received an order for four of the world's largest containerships, signifying increased demand for high-capacity vessels and potentially high-performance propellers.
Future Outlook for Controllable Pitch Marine Propeller Market Market
The future of the controllable pitch marine propeller market appears promising, driven by continuous technological innovation, growing environmental concerns, and increasing demand for fuel-efficient shipping solutions. The market is poised for further expansion, with opportunities arising from the development of advanced materials, hybrid propulsion systems, and the increasing adoption of automated control systems. The ongoing focus on sustainability and efficiency will shape the future direction of this dynamic market.
Controllable Pitch Marine Propeller Market Segmentation
-
1. Number Of Blades
- 1.1. Two and Three Blades
- 1.2. Four Blades
- 1.3. Five Blades
-
2. Application
- 2.1. passenger Vessels
- 2.2. Commercial/cargo Vessels
-
3. Ship Type
- 3.1. Tug And Push Boats
- 3.2. Ferries
- 3.3. Ice Breakers
- 3.4. Other Ship Type
Controllable Pitch Marine Propeller Market Segmentation By Geography
-
1. North America
- 1.1. US
- 1.2. Canada
- 1.3. Rest of North America
-
2. Europe
- 2.1. Germany
- 2.2. UK
- 2.3. France
- 2.4. Russia
- 2.5. Spain
- 2.6. Rest of Europe
-
3. Asia Pacific
- 3.1. India
- 3.2. China
- 3.3. Japan
- 3.4. South Korea
- 3.5. Rest of Asia Pacific
-
4. Rest of the World
- 4.1. South America
- 4.2. Middle East and Africa
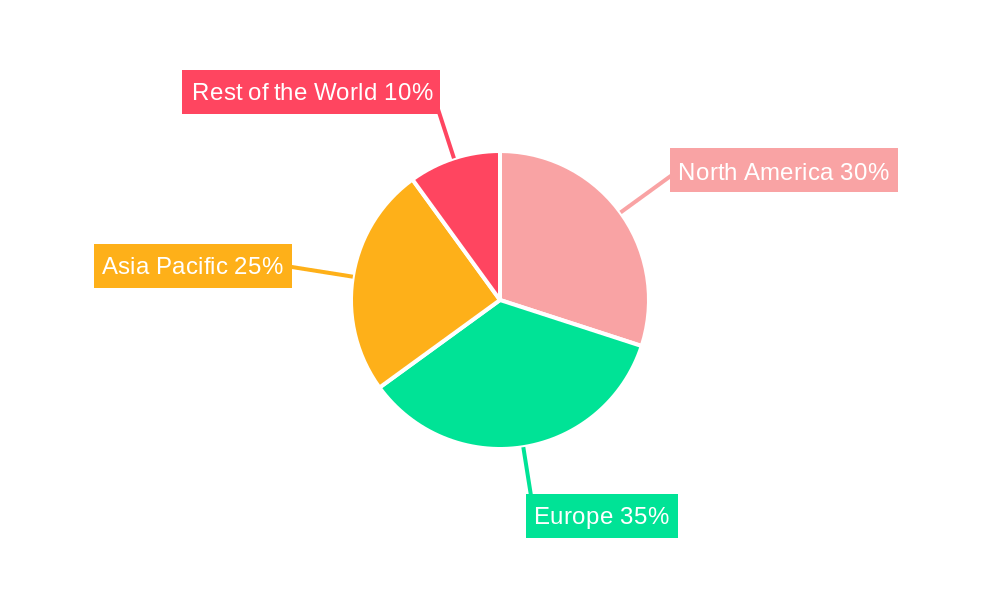
Controllable Pitch Marine Propeller Market Regional Market Share
Geographic Coverage of Controllable Pitch Marine Propeller Market
Controllable Pitch Marine Propeller Market REPORT HIGHLIGHTS
| Aspects | Details |
|---|---|
| Study Period | 2020-2034 |
| Base Year | 2025 |
| Estimated Year | 2026 |
| Forecast Period | 2026-2034 |
| Historical Period | 2020-2025 |
| Growth Rate | CAGR of 8.3% from 2020-2034 |
| Segmentation |
|
Table of Contents
- 1. Introduction
- 1.1. Research Scope
- 1.2. Market Segmentation
- 1.3. Research Objective
- 1.4. Definitions and Assumptions
- 2. Executive Summary
- 2.1. Market Snapshot
- 3. Market Dynamics
- 3.1. Market Drivers
- 3.2. Market Restrains
- 3.3. Market Trends
- 3.4. Market Opportunities
- 4. Market Factor Analysis
- 4.1. Porters Five Forces
- 4.1.1. Bargaining Power of Suppliers
- 4.1.2. Bargaining Power of Buyers
- 4.1.3. Threat of New Entrants
- 4.1.4. Threat of Substitutes
- 4.1.5. Competitive Rivalry
- 4.2. PESTEL analysis
- 4.3. BCG Analysis
- 4.3.1. Stars (High Growth, High Market Share)
- 4.3.2. Cash Cows (Low Growth, High Market Share)
- 4.3.3. Question Mark (High Growth, Low Market Share)
- 4.3.4. Dogs (Low Growth, Low Market Share)
- 4.4. Ansoff Matrix Analysis
- 4.5. Supply Chain Analysis
- 4.6. Regulatory Landscape
- 4.7. Current Market Potential and Opportunity Assessment (TAM–SAM–SOM Framework)
- 4.8. PRI Analyst Note
- 4.1. Porters Five Forces
- 5. Market Analysis, Insights and Forecast 2021-2033
- 5.1. Market Analysis, Insights and Forecast - by Number Of Blades
- 5.1.1. Two and Three Blades
- 5.1.2. Four Blades
- 5.1.3. Five Blades
- 5.2. Market Analysis, Insights and Forecast - by Application
- 5.2.1. passenger Vessels
- 5.2.2. Commercial/cargo Vessels
- 5.3. Market Analysis, Insights and Forecast - by Ship Type
- 5.3.1. Tug And Push Boats
- 5.3.2. Ferries
- 5.3.3. Ice Breakers
- 5.3.4. Other Ship Type
- 5.4. Market Analysis, Insights and Forecast - by Region
- 5.4.1. North America
- 5.4.2. Europe
- 5.4.3. Asia Pacific
- 5.4.4. Rest of the World
- 5.1. Market Analysis, Insights and Forecast - by Number Of Blades
- 6. Global Controllable Pitch Marine Propeller Market Analysis, Insights and Forecast, 2021-2033
- 6.1. Market Analysis, Insights and Forecast - by Number Of Blades
- 6.1.1. Two and Three Blades
- 6.1.2. Four Blades
- 6.1.3. Five Blades
- 6.2. Market Analysis, Insights and Forecast - by Application
- 6.2.1. passenger Vessels
- 6.2.2. Commercial/cargo Vessels
- 6.3. Market Analysis, Insights and Forecast - by Ship Type
- 6.3.1. Tug And Push Boats
- 6.3.2. Ferries
- 6.3.3. Ice Breakers
- 6.3.4. Other Ship Type
- 6.1. Market Analysis, Insights and Forecast - by Number Of Blades
- 7. North America Controllable Pitch Marine Propeller Market Analysis, Insights and Forecast, 2020-2032
- 7.1. Market Analysis, Insights and Forecast - by Number Of Blades
- 7.1.1. Two and Three Blades
- 7.1.2. Four Blades
- 7.1.3. Five Blades
- 7.2. Market Analysis, Insights and Forecast - by Application
- 7.2.1. passenger Vessels
- 7.2.2. Commercial/cargo Vessels
- 7.3. Market Analysis, Insights and Forecast - by Ship Type
- 7.3.1. Tug And Push Boats
- 7.3.2. Ferries
- 7.3.3. Ice Breakers
- 7.3.4. Other Ship Type
- 7.1. Market Analysis, Insights and Forecast - by Number Of Blades
- 8. Europe Controllable Pitch Marine Propeller Market Analysis, Insights and Forecast, 2020-2032
- 8.1. Market Analysis, Insights and Forecast - by Number Of Blades
- 8.1.1. Two and Three Blades
- 8.1.2. Four Blades
- 8.1.3. Five Blades
- 8.2. Market Analysis, Insights and Forecast - by Application
- 8.2.1. passenger Vessels
- 8.2.2. Commercial/cargo Vessels
- 8.3. Market Analysis, Insights and Forecast - by Ship Type
- 8.3.1. Tug And Push Boats
- 8.3.2. Ferries
- 8.3.3. Ice Breakers
- 8.3.4. Other Ship Type
- 8.1. Market Analysis, Insights and Forecast - by Number Of Blades
- 9. Asia Pacific Controllable Pitch Marine Propeller Market Analysis, Insights and Forecast, 2020-2032
- 9.1. Market Analysis, Insights and Forecast - by Number Of Blades
- 9.1.1. Two and Three Blades
- 9.1.2. Four Blades
- 9.1.3. Five Blades
- 9.2. Market Analysis, Insights and Forecast - by Application
- 9.2.1. passenger Vessels
- 9.2.2. Commercial/cargo Vessels
- 9.3. Market Analysis, Insights and Forecast - by Ship Type
- 9.3.1. Tug And Push Boats
- 9.3.2. Ferries
- 9.3.3. Ice Breakers
- 9.3.4. Other Ship Type
- 9.1. Market Analysis, Insights and Forecast - by Number Of Blades
- 10. Rest of the World Controllable Pitch Marine Propeller Market Analysis, Insights and Forecast, 2020-2032
- 10.1. Market Analysis, Insights and Forecast - by Number Of Blades
- 10.1.1. Two and Three Blades
- 10.1.2. Four Blades
- 10.1.3. Five Blades
- 10.2. Market Analysis, Insights and Forecast - by Application
- 10.2.1. passenger Vessels
- 10.2.2. Commercial/cargo Vessels
- 10.3. Market Analysis, Insights and Forecast - by Ship Type
- 10.3.1. Tug And Push Boats
- 10.3.2. Ferries
- 10.3.3. Ice Breakers
- 10.3.4. Other Ship Type
- 10.1. Market Analysis, Insights and Forecast - by Number Of Blades
- 11. Competitive Analysis
- 11.1. Company Profiles
- 11.1.1 Rolls Royce
- 11.1.1.1. Company Overview
- 11.1.1.2. Products
- 11.1.1.3. Company Financials
- 11.1.1.4. SWOT Analysis
- 11.1.2 Niigata Power Systems
- 11.1.2.1. Company Overview
- 11.1.2.2. Products
- 11.1.2.3. Company Financials
- 11.1.2.4. SWOT Analysis
- 11.1.3 Caterpillar Inc
- 11.1.3.1. Company Overview
- 11.1.3.2. Products
- 11.1.3.3. Company Financials
- 11.1.3.4. SWOT Analysis
- 11.1.4 Kawasaki Group
- 11.1.4.1. Company Overview
- 11.1.4.2. Products
- 11.1.4.3. Company Financials
- 11.1.4.4. SWOT Analysis
- 11.1.5 Brunvoll AS
- 11.1.5.1. Company Overview
- 11.1.5.2. Products
- 11.1.5.3. Company Financials
- 11.1.5.4. SWOT Analysis
- 11.1.6 Wartsil
- 11.1.6.1. Company Overview
- 11.1.6.2. Products
- 11.1.6.3. Company Financials
- 11.1.6.4. SWOT Analysis
- 11.1.1 Rolls Royce
- 11.2. Market Entropy
- 11.2.1 Company's Key Areas Served
- 11.2.2 Recent Developments
- 11.3. Company Market Share Analysis 2025
- 11.3.1 Top 5 Companies Market Share Analysis
- 11.3.2 Top 3 Companies Market Share Analysis
- 11.4. List of Potential Customers
- 12. Research Methodology
List of Figures
- Figure 1: Global Controllable Pitch Marine Propeller Market Revenue Breakdown (billion, %) by Region 2025 & 2033
- Figure 2: North America Controllable Pitch Marine Propeller Market Revenue (billion), by Number Of Blades 2025 & 2033
- Figure 3: North America Controllable Pitch Marine Propeller Market Revenue Share (%), by Number Of Blades 2025 & 2033
- Figure 4: North America Controllable Pitch Marine Propeller Market Revenue (billion), by Application 2025 & 2033
- Figure 5: North America Controllable Pitch Marine Propeller Market Revenue Share (%), by Application 2025 & 2033
- Figure 6: North America Controllable Pitch Marine Propeller Market Revenue (billion), by Ship Type 2025 & 2033
- Figure 7: North America Controllable Pitch Marine Propeller Market Revenue Share (%), by Ship Type 2025 & 2033
- Figure 8: North America Controllable Pitch Marine Propeller Market Revenue (billion), by Country 2025 & 2033
- Figure 9: North America Controllable Pitch Marine Propeller Market Revenue Share (%), by Country 2025 & 2033
- Figure 10: Europe Controllable Pitch Marine Propeller Market Revenue (billion), by Number Of Blades 2025 & 2033
- Figure 11: Europe Controllable Pitch Marine Propeller Market Revenue Share (%), by Number Of Blades 2025 & 2033
- Figure 12: Europe Controllable Pitch Marine Propeller Market Revenue (billion), by Application 2025 & 2033
- Figure 13: Europe Controllable Pitch Marine Propeller Market Revenue Share (%), by Application 2025 & 2033
- Figure 14: Europe Controllable Pitch Marine Propeller Market Revenue (billion), by Ship Type 2025 & 2033
- Figure 15: Europe Controllable Pitch Marine Propeller Market Revenue Share (%), by Ship Type 2025 & 2033
- Figure 16: Europe Controllable Pitch Marine Propeller Market Revenue (billion), by Country 2025 & 2033
- Figure 17: Europe Controllable Pitch Marine Propeller Market Revenue Share (%), by Country 2025 & 2033
- Figure 18: Asia Pacific Controllable Pitch Marine Propeller Market Revenue (billion), by Number Of Blades 2025 & 2033
- Figure 19: Asia Pacific Controllable Pitch Marine Propeller Market Revenue Share (%), by Number Of Blades 2025 & 2033
- Figure 20: Asia Pacific Controllable Pitch Marine Propeller Market Revenue (billion), by Application 2025 & 2033
- Figure 21: Asia Pacific Controllable Pitch Marine Propeller Market Revenue Share (%), by Application 2025 & 2033
- Figure 22: Asia Pacific Controllable Pitch Marine Propeller Market Revenue (billion), by Ship Type 2025 & 2033
- Figure 23: Asia Pacific Controllable Pitch Marine Propeller Market Revenue Share (%), by Ship Type 2025 & 2033
- Figure 24: Asia Pacific Controllable Pitch Marine Propeller Market Revenue (billion), by Country 2025 & 2033
- Figure 25: Asia Pacific Controllable Pitch Marine Propeller Market Revenue Share (%), by Country 2025 & 2033
- Figure 26: Rest of the World Controllable Pitch Marine Propeller Market Revenue (billion), by Number Of Blades 2025 & 2033
- Figure 27: Rest of the World Controllable Pitch Marine Propeller Market Revenue Share (%), by Number Of Blades 2025 & 2033
- Figure 28: Rest of the World Controllable Pitch Marine Propeller Market Revenue (billion), by Application 2025 & 2033
- Figure 29: Rest of the World Controllable Pitch Marine Propeller Market Revenue Share (%), by Application 2025 & 2033
- Figure 30: Rest of the World Controllable Pitch Marine Propeller Market Revenue (billion), by Ship Type 2025 & 2033
- Figure 31: Rest of the World Controllable Pitch Marine Propeller Market Revenue Share (%), by Ship Type 2025 & 2033
- Figure 32: Rest of the World Controllable Pitch Marine Propeller Market Revenue (billion), by Country 2025 & 2033
- Figure 33: Rest of the World Controllable Pitch Marine Propeller Market Revenue Share (%), by Country 2025 & 2033
List of Tables
- Table 1: Global Controllable Pitch Marine Propeller Market Revenue billion Forecast, by Number Of Blades 2020 & 2033
- Table 2: Global Controllable Pitch Marine Propeller Market Revenue billion Forecast, by Application 2020 & 2033
- Table 3: Global Controllable Pitch Marine Propeller Market Revenue billion Forecast, by Ship Type 2020 & 2033
- Table 4: Global Controllable Pitch Marine Propeller Market Revenue billion Forecast, by Region 2020 & 2033
- Table 5: Global Controllable Pitch Marine Propeller Market Revenue billion Forecast, by Number Of Blades 2020 & 2033
- Table 6: Global Controllable Pitch Marine Propeller Market Revenue billion Forecast, by Application 2020 & 2033
- Table 7: Global Controllable Pitch Marine Propeller Market Revenue billion Forecast, by Ship Type 2020 & 2033
- Table 8: Global Controllable Pitch Marine Propeller Market Revenue billion Forecast, by Country 2020 & 2033
- Table 9: US Controllable Pitch Marine Propeller Market Revenue (billion) Forecast, by Application 2020 & 2033
- Table 10: Canada Controllable Pitch Marine Propeller Market Revenue (billion) Forecast, by Application 2020 & 2033
- Table 11: Rest of North America Controllable Pitch Marine Propeller Market Revenue (billion) Forecast, by Application 2020 & 2033
- Table 12: Global Controllable Pitch Marine Propeller Market Revenue billion Forecast, by Number Of Blades 2020 & 2033
- Table 13: Global Controllable Pitch Marine Propeller Market Revenue billion Forecast, by Application 2020 & 2033
- Table 14: Global Controllable Pitch Marine Propeller Market Revenue billion Forecast, by Ship Type 2020 & 2033
- Table 15: Global Controllable Pitch Marine Propeller Market Revenue billion Forecast, by Country 2020 & 2033
- Table 16: Germany Controllable Pitch Marine Propeller Market Revenue (billion) Forecast, by Application 2020 & 2033
- Table 17: UK Controllable Pitch Marine Propeller Market Revenue (billion) Forecast, by Application 2020 & 2033
- Table 18: France Controllable Pitch Marine Propeller Market Revenue (billion) Forecast, by Application 2020 & 2033
- Table 19: Russia Controllable Pitch Marine Propeller Market Revenue (billion) Forecast, by Application 2020 & 2033
- Table 20: Spain Controllable Pitch Marine Propeller Market Revenue (billion) Forecast, by Application 2020 & 2033
- Table 21: Rest of Europe Controllable Pitch Marine Propeller Market Revenue (billion) Forecast, by Application 2020 & 2033
- Table 22: Global Controllable Pitch Marine Propeller Market Revenue billion Forecast, by Number Of Blades 2020 & 2033
- Table 23: Global Controllable Pitch Marine Propeller Market Revenue billion Forecast, by Application 2020 & 2033
- Table 24: Global Controllable Pitch Marine Propeller Market Revenue billion Forecast, by Ship Type 2020 & 2033
- Table 25: Global Controllable Pitch Marine Propeller Market Revenue billion Forecast, by Country 2020 & 2033
- Table 26: India Controllable Pitch Marine Propeller Market Revenue (billion) Forecast, by Application 2020 & 2033
- Table 27: China Controllable Pitch Marine Propeller Market Revenue (billion) Forecast, by Application 2020 & 2033
- Table 28: Japan Controllable Pitch Marine Propeller Market Revenue (billion) Forecast, by Application 2020 & 2033
- Table 29: South Korea Controllable Pitch Marine Propeller Market Revenue (billion) Forecast, by Application 2020 & 2033
- Table 30: Rest of Asia Pacific Controllable Pitch Marine Propeller Market Revenue (billion) Forecast, by Application 2020 & 2033
- Table 31: Global Controllable Pitch Marine Propeller Market Revenue billion Forecast, by Number Of Blades 2020 & 2033
- Table 32: Global Controllable Pitch Marine Propeller Market Revenue billion Forecast, by Application 2020 & 2033
- Table 33: Global Controllable Pitch Marine Propeller Market Revenue billion Forecast, by Ship Type 2020 & 2033
- Table 34: Global Controllable Pitch Marine Propeller Market Revenue billion Forecast, by Country 2020 & 2033
- Table 35: South America Controllable Pitch Marine Propeller Market Revenue (billion) Forecast, by Application 2020 & 2033
- Table 36: Middle East and Africa Controllable Pitch Marine Propeller Market Revenue (billion) Forecast, by Application 2020 & 2033
Frequently Asked Questions
1. What is the projected Compound Annual Growth Rate (CAGR) of the Controllable Pitch Marine Propeller Market?
The projected CAGR is approximately 8.3%.
2. Which companies are prominent players in the Controllable Pitch Marine Propeller Market?
Key companies in the market include Rolls Royce, Niigata Power Systems, Caterpillar Inc, Kawasaki Group, Brunvoll AS, Wartsil.
3. What are the main segments of the Controllable Pitch Marine Propeller Market?
The market segments include Number Of Blades, Application, Ship Type.
4. Can you provide details about the market size?
The market size is estimated to be USD 4.85 billion as of 2022.
5. What are some drivers contributing to market growth?
Rising Tourism Activity Drive Demand in the Market.
6. What are the notable trends driving market growth?
Controllable Pitch Propellers Continue to Witness Growth.
7. Are there any restraints impacting market growth?
Lack of Government Framework for the Usage of RVs.
8. Can you provide examples of recent developments in the market?
In March 2022, Wärtsilä signed a long-term service agreement with Brittany Ferries to support a new LNG-fuelled ferry. The technology group Wärtsilä will provide technical support via a long-term service agreement for its broad scope of solutions installed on Brittany Ferries' latest RoPax vessel, the 'Salamanca.' The 10-year agreement was signed in December 2021. The ferry will be inaugurated on March 25 and will make its first commercial sailing from Portsmouth, U.K., to Bilbao, Spain, on March 27.
9. What pricing options are available for accessing the report?
Pricing options include single-user, multi-user, and enterprise licenses priced at USD 4750, USD 5250, and USD 8750 respectively.
10. Is the market size provided in terms of value or volume?
The market size is provided in terms of value, measured in billion.
11. Are there any specific market keywords associated with the report?
Yes, the market keyword associated with the report is "Controllable Pitch Marine Propeller Market," which aids in identifying and referencing the specific market segment covered.
12. How do I determine which pricing option suits my needs best?
The pricing options vary based on user requirements and access needs. Individual users may opt for single-user licenses, while businesses requiring broader access may choose multi-user or enterprise licenses for cost-effective access to the report.
13. Are there any additional resources or data provided in the Controllable Pitch Marine Propeller Market report?
While the report offers comprehensive insights, it's advisable to review the specific contents or supplementary materials provided to ascertain if additional resources or data are available.
14. How can I stay updated on further developments or reports in the Controllable Pitch Marine Propeller Market?
To stay informed about further developments, trends, and reports in the Controllable Pitch Marine Propeller Market, consider subscribing to industry newsletters, following relevant companies and organizations, or regularly checking reputable industry news sources and publications.
Methodology
Step 1 - Identification of Relevant Samples Size from Population Database


Step 2 - Approaches for Defining Global Market Size (Value, Volume* & Price*)

Note*: In applicable scenarios
Step 3 - Data Sources
Primary Research
- Web Analytics
- Survey Reports
- Research Institute
- Latest Research Reports
- Opinion Leaders
Secondary Research
- Annual Reports
- White Paper
- Latest Press Release
- Industry Association
- Paid Database
- Investor Presentations

Step 4 - Data Triangulation
Involves using different sources of information in order to increase the validity of a study
These sources are likely to be stakeholders in a program - participants, other researchers, program staff, other community members, and so on.
Then we put all data in single framework & apply various statistical tools to find out the dynamic on the market.
During the analysis stage, feedback from the stakeholder groups would be compared to determine areas of agreement as well as areas of divergence