

Key Insights
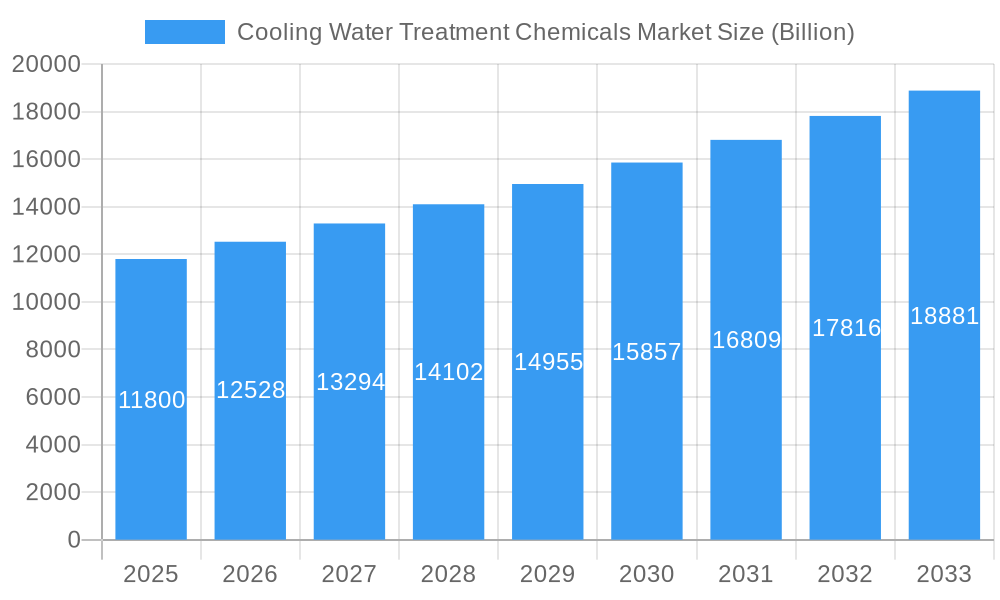
The global cooling water treatment chemicals market, valued at $11.8 billion in 2025, is projected to experience robust growth, driven by increasing industrialization, stringent environmental regulations, and the rising demand for efficient and sustainable cooling systems across various sectors. The market's Compound Annual Growth Rate (CAGR) of 5.8% from 2025 to 2033 signifies a considerable expansion, primarily fueled by the burgeoning power generation, petrochemicals, and oil & gas industries. These sectors rely heavily on efficient cooling water treatment to prevent corrosion, scaling, and microbial fouling, ensuring optimal equipment performance and minimizing downtime. Growth is further bolstered by advancements in chemical formulations, offering improved efficacy, reduced environmental impact, and cost-effectiveness. While the market faces potential restraints such as fluctuating raw material prices and stringent safety regulations, the overall positive outlook is reinforced by the increasing adoption of advanced treatment technologies and a growing focus on water conservation strategies.
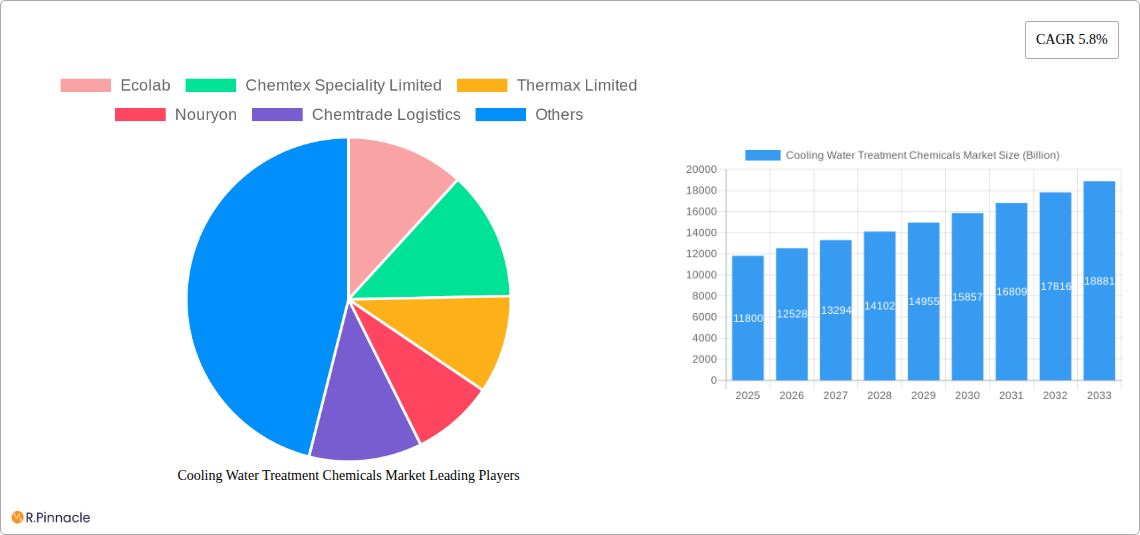
Cooling Water Treatment Chemicals Market Market Size (In Billion)
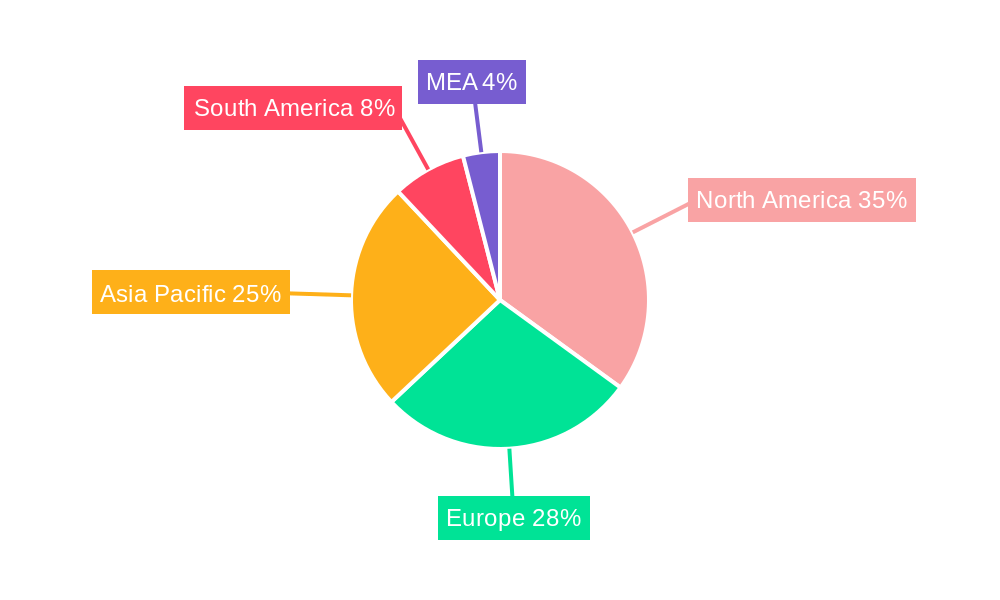
The market segmentation reveals significant opportunities within specific niches. Corrosion inhibitors and scale inhibitors dominate the type segment, reflecting the critical need to protect cooling systems from degradation. The power industry, steel, and petrochemicals & oil and gas segments are key end-user industries, driving market demand. Geographically, North America and Asia-Pacific are expected to lead the market, driven by strong industrial growth and the presence of major market players. The competitive landscape is characterized by established industry giants like Ecolab, Chemtrade Logistics, and Kemira, alongside several regional players, leading to intense competition and a focus on innovation and product differentiation. Future growth will likely be shaped by the increasing adoption of sustainable and eco-friendly cooling water treatment solutions, alongside continued technological advancements and strategic partnerships.
Cooling Water Treatment Chemicals Market Company Market Share
Cooling Water Treatment Chemicals Market Report: A Comprehensive Analysis (2019-2033)
This comprehensive report provides an in-depth analysis of the global Cooling Water Treatment Chemicals market, offering invaluable insights for industry professionals, investors, and stakeholders. With a study period spanning 2019-2033, a base year of 2025, and a forecast period of 2025-2033, this report offers a detailed understanding of past performance, current market dynamics, and future growth projections. The market is expected to reach a value of xx Billion by 2033.
Cooling Water Treatment Chemicals Market Structure & Innovation Trends
The Cooling Water Treatment Chemicals market exhibits a moderately consolidated structure, with several key players holding significant market share. Ecolab, Chemtex Speciality Limited, Thermax Limited, and Nouryon are among the leading companies, collectively accounting for an estimated xx% of the global market in 2025. Market concentration is influenced by factors such as economies of scale in production, extensive distribution networks, and strong research and development capabilities. Innovation is a key driver, with companies continuously developing advanced chemistries to enhance efficiency, reduce environmental impact, and meet increasingly stringent regulatory requirements. The market is subject to various regulatory frameworks related to water discharge and chemical usage, influencing product formulations and manufacturing processes. Product substitution is a factor, with companies striving to develop eco-friendly alternatives to traditional chemicals. The market sees consistent M&A activity, driven by a desire for expansion, technology acquisition, and geographic reach. Recent M&A deal values have averaged approximately xx Billion, demonstrating the significant investment in market consolidation.
- Market Concentration: Moderately consolidated, with top players holding xx% market share.
- Innovation Drivers: Development of sustainable and highly efficient chemistries, technological advancements in water treatment processes.
- Regulatory Frameworks: Stringent regulations impacting product formulations and manufacturing processes.
- Product Substitutes: Growing demand for eco-friendly and sustainable alternatives.
- M&A Activity: Significant M&A activity with average deal values around xx Billion.
- End-User Demographics: Predominantly industrial sectors, with growth driven by increasing demand from power generation and manufacturing industries.
Cooling Water Treatment Chemicals Market Dynamics & Trends
The Cooling Water Treatment Chemicals market is experiencing robust growth, driven by several key factors. The increasing demand for power generation across emerging economies fuels significant market expansion. Moreover, the growing industrialization in developing countries necessitates enhanced cooling water treatment to ensure optimal equipment performance and prevent corrosion. Technological advancements, such as the development of smart polymers and digital performance control systems, are reshaping the market landscape. Consumer preferences are shifting towards sustainable and environmentally friendly solutions, prompting manufacturers to develop eco-friendly products. The competitive dynamics are characterized by intense competition, driven by product innovation, cost optimization, and strategic partnerships. The market is projected to experience a Compound Annual Growth Rate (CAGR) of xx% during the forecast period (2025-2033), with significant market penetration gains anticipated across several regions. The market penetration rate is expected to increase from xx% in 2025 to xx% by 2033.
Dominant Regions & Segments in Cooling Water Treatment Chemicals Market
The Asia-Pacific region is currently the leading market for Cooling Water Treatment Chemicals, driven by rapid industrialization and substantial investments in power generation infrastructure. Within the segment breakdown, the Corrosion Inhibitor segment commands the largest market share, due to the widespread need to prevent corrosion in industrial cooling systems. The Power Industry segment is a dominant end-user, given the crucial role of cooling water in power plants. Key growth drivers for various regions and segments include:
- Asia-Pacific (Leading Region): Rapid industrialization, rising energy demand, expanding power generation capacity.
- North America: Stringent environmental regulations driving adoption of advanced technologies.
- Europe: Focus on sustainable practices and environmental protection.
- Corrosion Inhibitors (Leading Segment): Critical role in preventing corrosion damage in industrial cooling systems.
- Power Industry (Leading End-user): High demand for cooling water treatment in power generation facilities.
- Steel Industry: Significant use of cooling water in steel production processes.
Cooling Water Treatment Chemicals Market Product Innovations
Recent product innovations in the Cooling Water Treatment Chemicals market are focused on developing more efficient, sustainable, and digitally enabled solutions. Smart-tagged polymers, for instance, provide real-time performance monitoring and optimization, improving treatment efficiency and reducing chemical usage. These innovative products offer significant competitive advantages by enhancing treatment effectiveness, minimizing environmental impact, and improving operational efficiency. The focus is on meeting growing market demands for environmentally friendly and highly effective solutions.
Report Scope & Segmentation Analysis
This report segments the Cooling Water Treatment Chemicals market by type (Corrosion Inhibitor, Scale Inhibitor, Biocide, Other Types) and end-user industry (Power Industry, Steel, Mining & Metallurgy, Petrochemicals and Oil and Gas, Food and Beverage, Textile and Dyes, Other End-user Industries). Each segment provides detailed analysis of market size, growth projections, and competitive dynamics. For instance, the Corrosion Inhibitor segment is projected to witness a CAGR of xx% due to increased concerns about corrosion in cooling systems. Similarly, the Power Industry segment is expected to show robust growth due to ongoing investments in power generation infrastructure globally.
Key Drivers of Cooling Water Treatment Chemicals Market Growth
Several factors drive the growth of the Cooling Water Treatment Chemicals market. Firstly, the escalating demand for electricity in developing nations drives the expansion of power plants, necessitating effective cooling water treatment. Secondly, stringent environmental regulations mandate the use of eco-friendly chemicals, fueling the adoption of innovative treatment solutions. Lastly, the growing awareness of the economic benefits of preventing corrosion and scaling further contributes to market expansion.
Challenges in the Cooling Water Treatment Chemicals Market Sector
The Cooling Water Treatment Chemicals market faces challenges such as fluctuating raw material prices, which directly impact production costs. Moreover, stringent environmental regulations necessitate compliance costs and can hinder market growth. Intense competition from established and emerging players also exerts pressure on profit margins and market share. These factors collectively influence the overall market dynamics and profitability.
Emerging Opportunities in Cooling Water Treatment Chemicals Market
Emerging opportunities lie in the development of sustainable and environmentally friendly products, catering to growing environmental consciousness. Moreover, the increasing adoption of digital technologies presents opportunities for innovation in real-time performance monitoring and optimization. Expanding into emerging economies presents significant growth potential, particularly in regions with rapid industrialization.
Leading Players in the Cooling Water Treatment Chemicals Market Market
- Ecolab
- Chemtex Speciality Limited
- Thermax Limited
- Nouryon
- Chemtrade Logistics
- Buckman
- Kemira
- DuPont
- Solenis
- Italmatch Chemicals
- Suez
- Veolia
- Albemarle Corporation
- DuBois Chemicals
Key Developments in Cooling Water Treatment Chemicals Market Industry
- October 2022: Italmatch Chemicals launched its new Smart-Tagged Polymers brand line for industrial water treatment, boosting digital performance control in cooling tower applications.
- February 2022: SUEZ and partners secured a contract for the engineering, procurement, and construction of Wanhua Chemical Group's desalination plant, impacting the market through large-scale project involvement.
Future Outlook for Cooling Water Treatment Chemicals Market Market
The future outlook for the Cooling Water Treatment Chemicals market remains positive, driven by continuous industrial growth and stringent environmental regulations. Opportunities for innovation in sustainable and digitally enhanced solutions will further propel market expansion. Strategic partnerships and collaborations will likely become increasingly important for companies seeking to gain a competitive edge. The market is poised for sustained growth, driven by several factors, including technological advancements and increasing demand from key end-user industries.
Cooling Water Treatment Chemicals Market Segmentation
-
1. Type
- 1.1. Corrosion Inhibitor
- 1.2. Scale Inhibitor
- 1.3. Biocide
- 1.4. Other Types
-
2. End-user Industry
- 2.1. Power Industry
- 2.2. Steel, Mining & Metallurgy
- 2.3. Petrochemicals and Oil and Gas
- 2.4. Food and Beverage
- 2.5. Textile and Dyes
- 2.6. Other End-user Industries
Cooling Water Treatment Chemicals Market Segmentation By Geography
-
1. Asia Pacific
- 1.1. China
- 1.2. India
- 1.3. Japan
- 1.4. South Korea
- 1.5. Rest of Asia Pacific
-
2. North America
- 2.1. United States
- 2.2. Canada
- 2.3. Mexico
-
3. Europe
- 3.1. Germany
- 3.2. United Kingdom
- 3.3. France
- 3.4. Italy
- 3.5. Rest of Europe
-
4. South America
- 4.1. Brazil
- 4.2. Argentina
- 4.3. Rest of South America
- 5. Middle East
-
6. Saudi Arabia
- 6.1. South Africa
- 6.2. Rest of Middle East
Cooling Water Treatment Chemicals Market Regional Market Share
Geographic Coverage of Cooling Water Treatment Chemicals Market
Cooling Water Treatment Chemicals Market REPORT HIGHLIGHTS
| Aspects | Details |
|---|---|
| Study Period | 2020-2034 |
| Base Year | 2025 |
| Estimated Year | 2026 |
| Forecast Period | 2026-2034 |
| Historical Period | 2020-2025 |
| Growth Rate | CAGR of 5.8% from 2020-2034 |
| Segmentation |
|
Table of Contents
- 1. Introduction
- 1.1. Research Scope
- 1.2. Market Segmentation
- 1.3. Research Objective
- 1.4. Definitions and Assumptions
- 2. Executive Summary
- 2.1. Market Snapshot
- 3. Market Dynamics
- 3.1. Market Drivers
- 3.2. Market Restrains
- 3.3. Market Trends
- 3.4. Market Opportunities
- 4. Market Factor Analysis
- 4.1. Porters Five Forces
- 4.1.1. Bargaining Power of Suppliers
- 4.1.2. Bargaining Power of Buyers
- 4.1.3. Threat of New Entrants
- 4.1.4. Threat of Substitutes
- 4.1.5. Competitive Rivalry
- 4.2. PESTEL analysis
- 4.3. BCG Analysis
- 4.3.1. Stars (High Growth, High Market Share)
- 4.3.2. Cash Cows (Low Growth, High Market Share)
- 4.3.3. Question Mark (High Growth, Low Market Share)
- 4.3.4. Dogs (Low Growth, Low Market Share)
- 4.4. Ansoff Matrix Analysis
- 4.5. Supply Chain Analysis
- 4.6. Regulatory Landscape
- 4.7. Current Market Potential and Opportunity Assessment (TAM–SAM–SOM Framework)
- 4.8. PRI Analyst Note
- 4.1. Porters Five Forces
- 5. Market Analysis, Insights and Forecast 2021-2033
- 5.1. Market Analysis, Insights and Forecast - by Type
- 5.1.1. Corrosion Inhibitor
- 5.1.2. Scale Inhibitor
- 5.1.3. Biocide
- 5.1.4. Other Types
- 5.2. Market Analysis, Insights and Forecast - by End-user Industry
- 5.2.1. Power Industry
- 5.2.2. Steel, Mining & Metallurgy
- 5.2.3. Petrochemicals and Oil and Gas
- 5.2.4. Food and Beverage
- 5.2.5. Textile and Dyes
- 5.2.6. Other End-user Industries
- 5.3. Market Analysis, Insights and Forecast - by Region
- 5.3.1. Asia Pacific
- 5.3.2. North America
- 5.3.3. Europe
- 5.3.4. South America
- 5.3.5. Middle East
- 5.3.6. Saudi Arabia
- 5.1. Market Analysis, Insights and Forecast - by Type
- 6. Global Cooling Water Treatment Chemicals Market Analysis, Insights and Forecast, 2021-2033
- 6.1. Market Analysis, Insights and Forecast - by Type
- 6.1.1. Corrosion Inhibitor
- 6.1.2. Scale Inhibitor
- 6.1.3. Biocide
- 6.1.4. Other Types
- 6.2. Market Analysis, Insights and Forecast - by End-user Industry
- 6.2.1. Power Industry
- 6.2.2. Steel, Mining & Metallurgy
- 6.2.3. Petrochemicals and Oil and Gas
- 6.2.4. Food and Beverage
- 6.2.5. Textile and Dyes
- 6.2.6. Other End-user Industries
- 6.1. Market Analysis, Insights and Forecast - by Type
- 7. Asia Pacific Cooling Water Treatment Chemicals Market Analysis, Insights and Forecast, 2020-2032
- 7.1. Market Analysis, Insights and Forecast - by Type
- 7.1.1. Corrosion Inhibitor
- 7.1.2. Scale Inhibitor
- 7.1.3. Biocide
- 7.1.4. Other Types
- 7.2. Market Analysis, Insights and Forecast - by End-user Industry
- 7.2.1. Power Industry
- 7.2.2. Steel, Mining & Metallurgy
- 7.2.3. Petrochemicals and Oil and Gas
- 7.2.4. Food and Beverage
- 7.2.5. Textile and Dyes
- 7.2.6. Other End-user Industries
- 7.1. Market Analysis, Insights and Forecast - by Type
- 8. North America Cooling Water Treatment Chemicals Market Analysis, Insights and Forecast, 2020-2032
- 8.1. Market Analysis, Insights and Forecast - by Type
- 8.1.1. Corrosion Inhibitor
- 8.1.2. Scale Inhibitor
- 8.1.3. Biocide
- 8.1.4. Other Types
- 8.2. Market Analysis, Insights and Forecast - by End-user Industry
- 8.2.1. Power Industry
- 8.2.2. Steel, Mining & Metallurgy
- 8.2.3. Petrochemicals and Oil and Gas
- 8.2.4. Food and Beverage
- 8.2.5. Textile and Dyes
- 8.2.6. Other End-user Industries
- 8.1. Market Analysis, Insights and Forecast - by Type
- 9. Europe Cooling Water Treatment Chemicals Market Analysis, Insights and Forecast, 2020-2032
- 9.1. Market Analysis, Insights and Forecast - by Type
- 9.1.1. Corrosion Inhibitor
- 9.1.2. Scale Inhibitor
- 9.1.3. Biocide
- 9.1.4. Other Types
- 9.2. Market Analysis, Insights and Forecast - by End-user Industry
- 9.2.1. Power Industry
- 9.2.2. Steel, Mining & Metallurgy
- 9.2.3. Petrochemicals and Oil and Gas
- 9.2.4. Food and Beverage
- 9.2.5. Textile and Dyes
- 9.2.6. Other End-user Industries
- 9.1. Market Analysis, Insights and Forecast - by Type
- 10. South America Cooling Water Treatment Chemicals Market Analysis, Insights and Forecast, 2020-2032
- 10.1. Market Analysis, Insights and Forecast - by Type
- 10.1.1. Corrosion Inhibitor
- 10.1.2. Scale Inhibitor
- 10.1.3. Biocide
- 10.1.4. Other Types
- 10.2. Market Analysis, Insights and Forecast - by End-user Industry
- 10.2.1. Power Industry
- 10.2.2. Steel, Mining & Metallurgy
- 10.2.3. Petrochemicals and Oil and Gas
- 10.2.4. Food and Beverage
- 10.2.5. Textile and Dyes
- 10.2.6. Other End-user Industries
- 10.1. Market Analysis, Insights and Forecast - by Type
- 11. Middle East Cooling Water Treatment Chemicals Market Analysis, Insights and Forecast, 2020-2032
- 11.1. Market Analysis, Insights and Forecast - by Type
- 11.1.1. Corrosion Inhibitor
- 11.1.2. Scale Inhibitor
- 11.1.3. Biocide
- 11.1.4. Other Types
- 11.2. Market Analysis, Insights and Forecast - by End-user Industry
- 11.2.1. Power Industry
- 11.2.2. Steel, Mining & Metallurgy
- 11.2.3. Petrochemicals and Oil and Gas
- 11.2.4. Food and Beverage
- 11.2.5. Textile and Dyes
- 11.2.6. Other End-user Industries
- 11.1. Market Analysis, Insights and Forecast - by Type
- 12. Saudi Arabia Cooling Water Treatment Chemicals Market Analysis, Insights and Forecast, 2020-2032
- 12.1. Market Analysis, Insights and Forecast - by Type
- 12.1.1. Corrosion Inhibitor
- 12.1.2. Scale Inhibitor
- 12.1.3. Biocide
- 12.1.4. Other Types
- 12.2. Market Analysis, Insights and Forecast - by End-user Industry
- 12.2.1. Power Industry
- 12.2.2. Steel, Mining & Metallurgy
- 12.2.3. Petrochemicals and Oil and Gas
- 12.2.4. Food and Beverage
- 12.2.5. Textile and Dyes
- 12.2.6. Other End-user Industries
- 12.1. Market Analysis, Insights and Forecast - by Type
- 13. Competitive Analysis
- 13.1. Company Profiles
- 13.1.1 Ecolab
- 13.1.1.1. Company Overview
- 13.1.1.2. Products
- 13.1.1.3. Company Financials
- 13.1.1.4. SWOT Analysis
- 13.1.2 Chemtex Speciality Limited
- 13.1.2.1. Company Overview
- 13.1.2.2. Products
- 13.1.2.3. Company Financials
- 13.1.2.4. SWOT Analysis
- 13.1.3 Thermax Limited
- 13.1.3.1. Company Overview
- 13.1.3.2. Products
- 13.1.3.3. Company Financials
- 13.1.3.4. SWOT Analysis
- 13.1.4 Nouryon
- 13.1.4.1. Company Overview
- 13.1.4.2. Products
- 13.1.4.3. Company Financials
- 13.1.4.4. SWOT Analysis
- 13.1.5 Chemtrade Logistics
- 13.1.5.1. Company Overview
- 13.1.5.2. Products
- 13.1.5.3. Company Financials
- 13.1.5.4. SWOT Analysis
- 13.1.6 Buckman
- 13.1.6.1. Company Overview
- 13.1.6.2. Products
- 13.1.6.3. Company Financials
- 13.1.6.4. SWOT Analysis
- 13.1.7 Kemira
- 13.1.7.1. Company Overview
- 13.1.7.2. Products
- 13.1.7.3. Company Financials
- 13.1.7.4. SWOT Analysis
- 13.1.8 DuPont
- 13.1.8.1. Company Overview
- 13.1.8.2. Products
- 13.1.8.3. Company Financials
- 13.1.8.4. SWOT Analysis
- 13.1.9 Solenis
- 13.1.9.1. Company Overview
- 13.1.9.2. Products
- 13.1.9.3. Company Financials
- 13.1.9.4. SWOT Analysis
- 13.1.10 Italmatch Chemicals
- 13.1.10.1. Company Overview
- 13.1.10.2. Products
- 13.1.10.3. Company Financials
- 13.1.10.4. SWOT Analysis
- 13.1.11 Suez
- 13.1.11.1. Company Overview
- 13.1.11.2. Products
- 13.1.11.3. Company Financials
- 13.1.11.4. SWOT Analysis
- 13.1.12 Veolia
- 13.1.12.1. Company Overview
- 13.1.12.2. Products
- 13.1.12.3. Company Financials
- 13.1.12.4. SWOT Analysis
- 13.1.13 Albemarle Corporation
- 13.1.13.1. Company Overview
- 13.1.13.2. Products
- 13.1.13.3. Company Financials
- 13.1.13.4. SWOT Analysis
- 13.1.14 DuBois Chemicals
- 13.1.14.1. Company Overview
- 13.1.14.2. Products
- 13.1.14.3. Company Financials
- 13.1.14.4. SWOT Analysis
- 13.1.1 Ecolab
- 13.2. Market Entropy
- 13.2.1 Company's Key Areas Served
- 13.2.2 Recent Developments
- 13.3. Company Market Share Analysis 2025
- 13.3.1 Top 5 Companies Market Share Analysis
- 13.3.2 Top 3 Companies Market Share Analysis
- 13.4. List of Potential Customers
- 14. Research Methodology
List of Figures
- Figure 1: Global Cooling Water Treatment Chemicals Market Revenue Breakdown (Billion, %) by Region 2025 & 2033
- Figure 2: Global Cooling Water Treatment Chemicals Market Volume Breakdown (K Tons, %) by Region 2025 & 2033
- Figure 3: Asia Pacific Cooling Water Treatment Chemicals Market Revenue (Billion), by Type 2025 & 2033
- Figure 4: Asia Pacific Cooling Water Treatment Chemicals Market Volume (K Tons), by Type 2025 & 2033
- Figure 5: Asia Pacific Cooling Water Treatment Chemicals Market Revenue Share (%), by Type 2025 & 2033
- Figure 6: Asia Pacific Cooling Water Treatment Chemicals Market Volume Share (%), by Type 2025 & 2033
- Figure 7: Asia Pacific Cooling Water Treatment Chemicals Market Revenue (Billion), by End-user Industry 2025 & 2033
- Figure 8: Asia Pacific Cooling Water Treatment Chemicals Market Volume (K Tons), by End-user Industry 2025 & 2033
- Figure 9: Asia Pacific Cooling Water Treatment Chemicals Market Revenue Share (%), by End-user Industry 2025 & 2033
- Figure 10: Asia Pacific Cooling Water Treatment Chemicals Market Volume Share (%), by End-user Industry 2025 & 2033
- Figure 11: Asia Pacific Cooling Water Treatment Chemicals Market Revenue (Billion), by Country 2025 & 2033
- Figure 12: Asia Pacific Cooling Water Treatment Chemicals Market Volume (K Tons), by Country 2025 & 2033
- Figure 13: Asia Pacific Cooling Water Treatment Chemicals Market Revenue Share (%), by Country 2025 & 2033
- Figure 14: Asia Pacific Cooling Water Treatment Chemicals Market Volume Share (%), by Country 2025 & 2033
- Figure 15: North America Cooling Water Treatment Chemicals Market Revenue (Billion), by Type 2025 & 2033
- Figure 16: North America Cooling Water Treatment Chemicals Market Volume (K Tons), by Type 2025 & 2033
- Figure 17: North America Cooling Water Treatment Chemicals Market Revenue Share (%), by Type 2025 & 2033
- Figure 18: North America Cooling Water Treatment Chemicals Market Volume Share (%), by Type 2025 & 2033
- Figure 19: North America Cooling Water Treatment Chemicals Market Revenue (Billion), by End-user Industry 2025 & 2033
- Figure 20: North America Cooling Water Treatment Chemicals Market Volume (K Tons), by End-user Industry 2025 & 2033
- Figure 21: North America Cooling Water Treatment Chemicals Market Revenue Share (%), by End-user Industry 2025 & 2033
- Figure 22: North America Cooling Water Treatment Chemicals Market Volume Share (%), by End-user Industry 2025 & 2033
- Figure 23: North America Cooling Water Treatment Chemicals Market Revenue (Billion), by Country 2025 & 2033
- Figure 24: North America Cooling Water Treatment Chemicals Market Volume (K Tons), by Country 2025 & 2033
- Figure 25: North America Cooling Water Treatment Chemicals Market Revenue Share (%), by Country 2025 & 2033
- Figure 26: North America Cooling Water Treatment Chemicals Market Volume Share (%), by Country 2025 & 2033
- Figure 27: Europe Cooling Water Treatment Chemicals Market Revenue (Billion), by Type 2025 & 2033
- Figure 28: Europe Cooling Water Treatment Chemicals Market Volume (K Tons), by Type 2025 & 2033
- Figure 29: Europe Cooling Water Treatment Chemicals Market Revenue Share (%), by Type 2025 & 2033
- Figure 30: Europe Cooling Water Treatment Chemicals Market Volume Share (%), by Type 2025 & 2033
- Figure 31: Europe Cooling Water Treatment Chemicals Market Revenue (Billion), by End-user Industry 2025 & 2033
- Figure 32: Europe Cooling Water Treatment Chemicals Market Volume (K Tons), by End-user Industry 2025 & 2033
- Figure 33: Europe Cooling Water Treatment Chemicals Market Revenue Share (%), by End-user Industry 2025 & 2033
- Figure 34: Europe Cooling Water Treatment Chemicals Market Volume Share (%), by End-user Industry 2025 & 2033
- Figure 35: Europe Cooling Water Treatment Chemicals Market Revenue (Billion), by Country 2025 & 2033
- Figure 36: Europe Cooling Water Treatment Chemicals Market Volume (K Tons), by Country 2025 & 2033
- Figure 37: Europe Cooling Water Treatment Chemicals Market Revenue Share (%), by Country 2025 & 2033
- Figure 38: Europe Cooling Water Treatment Chemicals Market Volume Share (%), by Country 2025 & 2033
- Figure 39: South America Cooling Water Treatment Chemicals Market Revenue (Billion), by Type 2025 & 2033
- Figure 40: South America Cooling Water Treatment Chemicals Market Volume (K Tons), by Type 2025 & 2033
- Figure 41: South America Cooling Water Treatment Chemicals Market Revenue Share (%), by Type 2025 & 2033
- Figure 42: South America Cooling Water Treatment Chemicals Market Volume Share (%), by Type 2025 & 2033
- Figure 43: South America Cooling Water Treatment Chemicals Market Revenue (Billion), by End-user Industry 2025 & 2033
- Figure 44: South America Cooling Water Treatment Chemicals Market Volume (K Tons), by End-user Industry 2025 & 2033
- Figure 45: South America Cooling Water Treatment Chemicals Market Revenue Share (%), by End-user Industry 2025 & 2033
- Figure 46: South America Cooling Water Treatment Chemicals Market Volume Share (%), by End-user Industry 2025 & 2033
- Figure 47: South America Cooling Water Treatment Chemicals Market Revenue (Billion), by Country 2025 & 2033
- Figure 48: South America Cooling Water Treatment Chemicals Market Volume (K Tons), by Country 2025 & 2033
- Figure 49: South America Cooling Water Treatment Chemicals Market Revenue Share (%), by Country 2025 & 2033
- Figure 50: South America Cooling Water Treatment Chemicals Market Volume Share (%), by Country 2025 & 2033
- Figure 51: Middle East Cooling Water Treatment Chemicals Market Revenue (Billion), by Type 2025 & 2033
- Figure 52: Middle East Cooling Water Treatment Chemicals Market Volume (K Tons), by Type 2025 & 2033
- Figure 53: Middle East Cooling Water Treatment Chemicals Market Revenue Share (%), by Type 2025 & 2033
- Figure 54: Middle East Cooling Water Treatment Chemicals Market Volume Share (%), by Type 2025 & 2033
- Figure 55: Middle East Cooling Water Treatment Chemicals Market Revenue (Billion), by End-user Industry 2025 & 2033
- Figure 56: Middle East Cooling Water Treatment Chemicals Market Volume (K Tons), by End-user Industry 2025 & 2033
- Figure 57: Middle East Cooling Water Treatment Chemicals Market Revenue Share (%), by End-user Industry 2025 & 2033
- Figure 58: Middle East Cooling Water Treatment Chemicals Market Volume Share (%), by End-user Industry 2025 & 2033
- Figure 59: Middle East Cooling Water Treatment Chemicals Market Revenue (Billion), by Country 2025 & 2033
- Figure 60: Middle East Cooling Water Treatment Chemicals Market Volume (K Tons), by Country 2025 & 2033
- Figure 61: Middle East Cooling Water Treatment Chemicals Market Revenue Share (%), by Country 2025 & 2033
- Figure 62: Middle East Cooling Water Treatment Chemicals Market Volume Share (%), by Country 2025 & 2033
- Figure 63: Saudi Arabia Cooling Water Treatment Chemicals Market Revenue (Billion), by Type 2025 & 2033
- Figure 64: Saudi Arabia Cooling Water Treatment Chemicals Market Volume (K Tons), by Type 2025 & 2033
- Figure 65: Saudi Arabia Cooling Water Treatment Chemicals Market Revenue Share (%), by Type 2025 & 2033
- Figure 66: Saudi Arabia Cooling Water Treatment Chemicals Market Volume Share (%), by Type 2025 & 2033
- Figure 67: Saudi Arabia Cooling Water Treatment Chemicals Market Revenue (Billion), by End-user Industry 2025 & 2033
- Figure 68: Saudi Arabia Cooling Water Treatment Chemicals Market Volume (K Tons), by End-user Industry 2025 & 2033
- Figure 69: Saudi Arabia Cooling Water Treatment Chemicals Market Revenue Share (%), by End-user Industry 2025 & 2033
- Figure 70: Saudi Arabia Cooling Water Treatment Chemicals Market Volume Share (%), by End-user Industry 2025 & 2033
- Figure 71: Saudi Arabia Cooling Water Treatment Chemicals Market Revenue (Billion), by Country 2025 & 2033
- Figure 72: Saudi Arabia Cooling Water Treatment Chemicals Market Volume (K Tons), by Country 2025 & 2033
- Figure 73: Saudi Arabia Cooling Water Treatment Chemicals Market Revenue Share (%), by Country 2025 & 2033
- Figure 74: Saudi Arabia Cooling Water Treatment Chemicals Market Volume Share (%), by Country 2025 & 2033
List of Tables
- Table 1: Global Cooling Water Treatment Chemicals Market Revenue Billion Forecast, by Type 2020 & 2033
- Table 2: Global Cooling Water Treatment Chemicals Market Volume K Tons Forecast, by Type 2020 & 2033
- Table 3: Global Cooling Water Treatment Chemicals Market Revenue Billion Forecast, by End-user Industry 2020 & 2033
- Table 4: Global Cooling Water Treatment Chemicals Market Volume K Tons Forecast, by End-user Industry 2020 & 2033
- Table 5: Global Cooling Water Treatment Chemicals Market Revenue Billion Forecast, by Region 2020 & 2033
- Table 6: Global Cooling Water Treatment Chemicals Market Volume K Tons Forecast, by Region 2020 & 2033
- Table 7: Global Cooling Water Treatment Chemicals Market Revenue Billion Forecast, by Type 2020 & 2033
- Table 8: Global Cooling Water Treatment Chemicals Market Volume K Tons Forecast, by Type 2020 & 2033
- Table 9: Global Cooling Water Treatment Chemicals Market Revenue Billion Forecast, by End-user Industry 2020 & 2033
- Table 10: Global Cooling Water Treatment Chemicals Market Volume K Tons Forecast, by End-user Industry 2020 & 2033
- Table 11: Global Cooling Water Treatment Chemicals Market Revenue Billion Forecast, by Country 2020 & 2033
- Table 12: Global Cooling Water Treatment Chemicals Market Volume K Tons Forecast, by Country 2020 & 2033
- Table 13: China Cooling Water Treatment Chemicals Market Revenue (Billion) Forecast, by Application 2020 & 2033
- Table 14: China Cooling Water Treatment Chemicals Market Volume (K Tons) Forecast, by Application 2020 & 2033
- Table 15: India Cooling Water Treatment Chemicals Market Revenue (Billion) Forecast, by Application 2020 & 2033
- Table 16: India Cooling Water Treatment Chemicals Market Volume (K Tons) Forecast, by Application 2020 & 2033
- Table 17: Japan Cooling Water Treatment Chemicals Market Revenue (Billion) Forecast, by Application 2020 & 2033
- Table 18: Japan Cooling Water Treatment Chemicals Market Volume (K Tons) Forecast, by Application 2020 & 2033
- Table 19: South Korea Cooling Water Treatment Chemicals Market Revenue (Billion) Forecast, by Application 2020 & 2033
- Table 20: South Korea Cooling Water Treatment Chemicals Market Volume (K Tons) Forecast, by Application 2020 & 2033
- Table 21: Rest of Asia Pacific Cooling Water Treatment Chemicals Market Revenue (Billion) Forecast, by Application 2020 & 2033
- Table 22: Rest of Asia Pacific Cooling Water Treatment Chemicals Market Volume (K Tons) Forecast, by Application 2020 & 2033
- Table 23: Global Cooling Water Treatment Chemicals Market Revenue Billion Forecast, by Type 2020 & 2033
- Table 24: Global Cooling Water Treatment Chemicals Market Volume K Tons Forecast, by Type 2020 & 2033
- Table 25: Global Cooling Water Treatment Chemicals Market Revenue Billion Forecast, by End-user Industry 2020 & 2033
- Table 26: Global Cooling Water Treatment Chemicals Market Volume K Tons Forecast, by End-user Industry 2020 & 2033
- Table 27: Global Cooling Water Treatment Chemicals Market Revenue Billion Forecast, by Country 2020 & 2033
- Table 28: Global Cooling Water Treatment Chemicals Market Volume K Tons Forecast, by Country 2020 & 2033
- Table 29: United States Cooling Water Treatment Chemicals Market Revenue (Billion) Forecast, by Application 2020 & 2033
- Table 30: United States Cooling Water Treatment Chemicals Market Volume (K Tons) Forecast, by Application 2020 & 2033
- Table 31: Canada Cooling Water Treatment Chemicals Market Revenue (Billion) Forecast, by Application 2020 & 2033
- Table 32: Canada Cooling Water Treatment Chemicals Market Volume (K Tons) Forecast, by Application 2020 & 2033
- Table 33: Mexico Cooling Water Treatment Chemicals Market Revenue (Billion) Forecast, by Application 2020 & 2033
- Table 34: Mexico Cooling Water Treatment Chemicals Market Volume (K Tons) Forecast, by Application 2020 & 2033
- Table 35: Global Cooling Water Treatment Chemicals Market Revenue Billion Forecast, by Type 2020 & 2033
- Table 36: Global Cooling Water Treatment Chemicals Market Volume K Tons Forecast, by Type 2020 & 2033
- Table 37: Global Cooling Water Treatment Chemicals Market Revenue Billion Forecast, by End-user Industry 2020 & 2033
- Table 38: Global Cooling Water Treatment Chemicals Market Volume K Tons Forecast, by End-user Industry 2020 & 2033
- Table 39: Global Cooling Water Treatment Chemicals Market Revenue Billion Forecast, by Country 2020 & 2033
- Table 40: Global Cooling Water Treatment Chemicals Market Volume K Tons Forecast, by Country 2020 & 2033
- Table 41: Germany Cooling Water Treatment Chemicals Market Revenue (Billion) Forecast, by Application 2020 & 2033
- Table 42: Germany Cooling Water Treatment Chemicals Market Volume (K Tons) Forecast, by Application 2020 & 2033
- Table 43: United Kingdom Cooling Water Treatment Chemicals Market Revenue (Billion) Forecast, by Application 2020 & 2033
- Table 44: United Kingdom Cooling Water Treatment Chemicals Market Volume (K Tons) Forecast, by Application 2020 & 2033
- Table 45: France Cooling Water Treatment Chemicals Market Revenue (Billion) Forecast, by Application 2020 & 2033
- Table 46: France Cooling Water Treatment Chemicals Market Volume (K Tons) Forecast, by Application 2020 & 2033
- Table 47: Italy Cooling Water Treatment Chemicals Market Revenue (Billion) Forecast, by Application 2020 & 2033
- Table 48: Italy Cooling Water Treatment Chemicals Market Volume (K Tons) Forecast, by Application 2020 & 2033
- Table 49: Rest of Europe Cooling Water Treatment Chemicals Market Revenue (Billion) Forecast, by Application 2020 & 2033
- Table 50: Rest of Europe Cooling Water Treatment Chemicals Market Volume (K Tons) Forecast, by Application 2020 & 2033
- Table 51: Global Cooling Water Treatment Chemicals Market Revenue Billion Forecast, by Type 2020 & 2033
- Table 52: Global Cooling Water Treatment Chemicals Market Volume K Tons Forecast, by Type 2020 & 2033
- Table 53: Global Cooling Water Treatment Chemicals Market Revenue Billion Forecast, by End-user Industry 2020 & 2033
- Table 54: Global Cooling Water Treatment Chemicals Market Volume K Tons Forecast, by End-user Industry 2020 & 2033
- Table 55: Global Cooling Water Treatment Chemicals Market Revenue Billion Forecast, by Country 2020 & 2033
- Table 56: Global Cooling Water Treatment Chemicals Market Volume K Tons Forecast, by Country 2020 & 2033
- Table 57: Brazil Cooling Water Treatment Chemicals Market Revenue (Billion) Forecast, by Application 2020 & 2033
- Table 58: Brazil Cooling Water Treatment Chemicals Market Volume (K Tons) Forecast, by Application 2020 & 2033
- Table 59: Argentina Cooling Water Treatment Chemicals Market Revenue (Billion) Forecast, by Application 2020 & 2033
- Table 60: Argentina Cooling Water Treatment Chemicals Market Volume (K Tons) Forecast, by Application 2020 & 2033
- Table 61: Rest of South America Cooling Water Treatment Chemicals Market Revenue (Billion) Forecast, by Application 2020 & 2033
- Table 62: Rest of South America Cooling Water Treatment Chemicals Market Volume (K Tons) Forecast, by Application 2020 & 2033
- Table 63: Global Cooling Water Treatment Chemicals Market Revenue Billion Forecast, by Type 2020 & 2033
- Table 64: Global Cooling Water Treatment Chemicals Market Volume K Tons Forecast, by Type 2020 & 2033
- Table 65: Global Cooling Water Treatment Chemicals Market Revenue Billion Forecast, by End-user Industry 2020 & 2033
- Table 66: Global Cooling Water Treatment Chemicals Market Volume K Tons Forecast, by End-user Industry 2020 & 2033
- Table 67: Global Cooling Water Treatment Chemicals Market Revenue Billion Forecast, by Country 2020 & 2033
- Table 68: Global Cooling Water Treatment Chemicals Market Volume K Tons Forecast, by Country 2020 & 2033
- Table 69: Global Cooling Water Treatment Chemicals Market Revenue Billion Forecast, by Type 2020 & 2033
- Table 70: Global Cooling Water Treatment Chemicals Market Volume K Tons Forecast, by Type 2020 & 2033
- Table 71: Global Cooling Water Treatment Chemicals Market Revenue Billion Forecast, by End-user Industry 2020 & 2033
- Table 72: Global Cooling Water Treatment Chemicals Market Volume K Tons Forecast, by End-user Industry 2020 & 2033
- Table 73: Global Cooling Water Treatment Chemicals Market Revenue Billion Forecast, by Country 2020 & 2033
- Table 74: Global Cooling Water Treatment Chemicals Market Volume K Tons Forecast, by Country 2020 & 2033
- Table 75: South Africa Cooling Water Treatment Chemicals Market Revenue (Billion) Forecast, by Application 2020 & 2033
- Table 76: South Africa Cooling Water Treatment Chemicals Market Volume (K Tons) Forecast, by Application 2020 & 2033
- Table 77: Rest of Middle East Cooling Water Treatment Chemicals Market Revenue (Billion) Forecast, by Application 2020 & 2033
- Table 78: Rest of Middle East Cooling Water Treatment Chemicals Market Volume (K Tons) Forecast, by Application 2020 & 2033
Frequently Asked Questions
1. What is the projected Compound Annual Growth Rate (CAGR) of the Cooling Water Treatment Chemicals Market?
The projected CAGR is approximately 5.8%.
2. Which companies are prominent players in the Cooling Water Treatment Chemicals Market?
Key companies in the market include Ecolab, Chemtex Speciality Limited, Thermax Limited, Nouryon, Chemtrade Logistics, Buckman, Kemira, DuPont, Solenis, Italmatch Chemicals, Suez, Veolia, Albemarle Corporation, DuBois Chemicals.
3. What are the main segments of the Cooling Water Treatment Chemicals Market?
The market segments include Type, End-user Industry.
4. Can you provide details about the market size?
The market size is estimated to be USD 11.8 Billion as of 2022.
5. What are some drivers contributing to market growth?
Accelerating Growth of the Power Industry; Growing Popularity of Zero-liquid Blowdown.
6. What are the notable trends driving market growth?
Power Industry to Dominate the Market.
7. Are there any restraints impacting market growth?
Lack of Awareness about Cooling Water Treatment; Increasing Popularity of Chlorine Alternatives.
8. Can you provide examples of recent developments in the market?
October 2022: Italmatch Chemicals company introduced a new Smart-Tagged Polymers brand line specialized for Industrial Water Treatment solutions. It is a cutting-edge smart solution for Cooling Tower applications and a significant step forward in digitalizing chemical treatment performance control.
9. What pricing options are available for accessing the report?
Pricing options include single-user, multi-user, and enterprise licenses priced at USD 3,950, USD 4,950, and USD 6,950 respectively.
10. Is the market size provided in terms of value or volume?
The market size is provided in terms of value, measured in Billion and volume, measured in K Tons.
11. Are there any specific market keywords associated with the report?
Yes, the market keyword associated with the report is "Cooling Water Treatment Chemicals Market," which aids in identifying and referencing the specific market segment covered.
12. How do I determine which pricing option suits my needs best?
The pricing options vary based on user requirements and access needs. Individual users may opt for single-user licenses, while businesses requiring broader access may choose multi-user or enterprise licenses for cost-effective access to the report.
13. Are there any additional resources or data provided in the Cooling Water Treatment Chemicals Market report?
While the report offers comprehensive insights, it's advisable to review the specific contents or supplementary materials provided to ascertain if additional resources or data are available.
14. How can I stay updated on further developments or reports in the Cooling Water Treatment Chemicals Market?
To stay informed about further developments, trends, and reports in the Cooling Water Treatment Chemicals Market, consider subscribing to industry newsletters, following relevant companies and organizations, or regularly checking reputable industry news sources and publications.
Methodology
Step 1 - Identification of Relevant Samples Size from Population Database


Step 2 - Approaches for Defining Global Market Size (Value, Volume* & Price*)

Note*: In applicable scenarios
Step 3 - Data Sources
Primary Research
- Web Analytics
- Survey Reports
- Research Institute
- Latest Research Reports
- Opinion Leaders
Secondary Research
- Annual Reports
- White Paper
- Latest Press Release
- Industry Association
- Paid Database
- Investor Presentations

Step 4 - Data Triangulation
Involves using different sources of information in order to increase the validity of a study
These sources are likely to be stakeholders in a program - participants, other researchers, program staff, other community members, and so on.
Then we put all data in single framework & apply various statistical tools to find out the dynamic on the market.
During the analysis stage, feedback from the stakeholder groups would be compared to determine areas of agreement as well as areas of divergence