

Key Insights
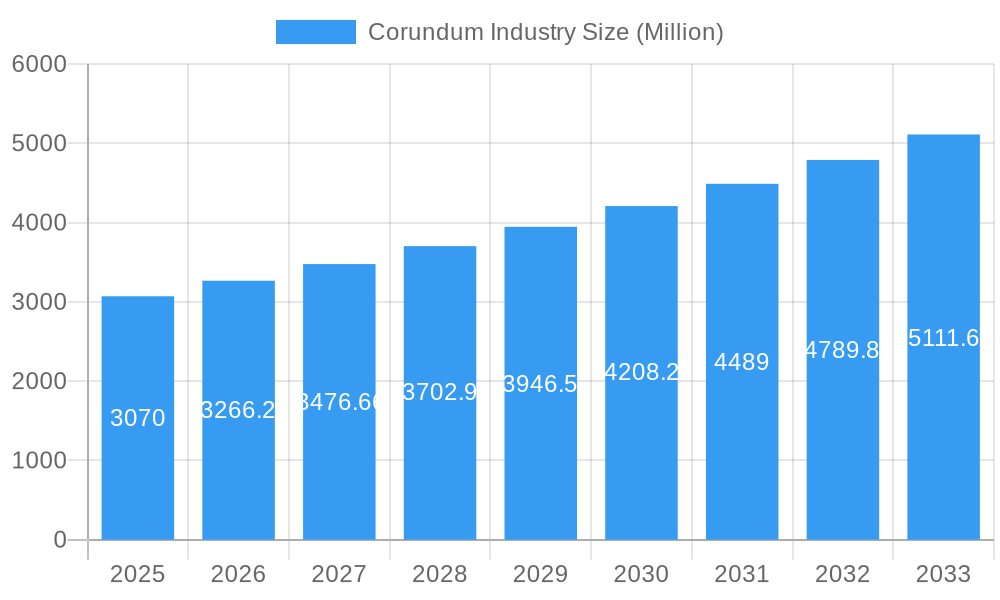
The global corundum market, valued at approximately $3.07 billion in 2025, is projected to experience robust growth, exhibiting a Compound Annual Growth Rate (CAGR) exceeding 6% from 2025 to 2033. This expansion is driven by increasing demand across diverse applications, particularly in the jewelry, abrasive, and refractory sectors. The jewelry industry's preference for ruby and sapphire, key corundum varieties, fuels significant market growth, while the robust construction and industrial sectors contribute to the high demand for corundum in abrasive and refractory applications. Technological advancements in material science are also contributing factors, leading to the development of higher-performance corundum-based products for specialized applications like cutting tools and electronics. Growth is expected to be particularly strong in the Asia-Pacific region, driven by rapid industrialization and expanding consumer markets in countries like China and India. However, fluctuations in raw material prices and the potential for synthetic corundum substitutes to impact market share represent key challenges. The market is segmented by type (emery, ruby, sapphire) and application (jewelry, abrasive, refractory, mineral, electrical & electronics, other applications), reflecting the diverse uses of corundum and contributing to its overall market strength.
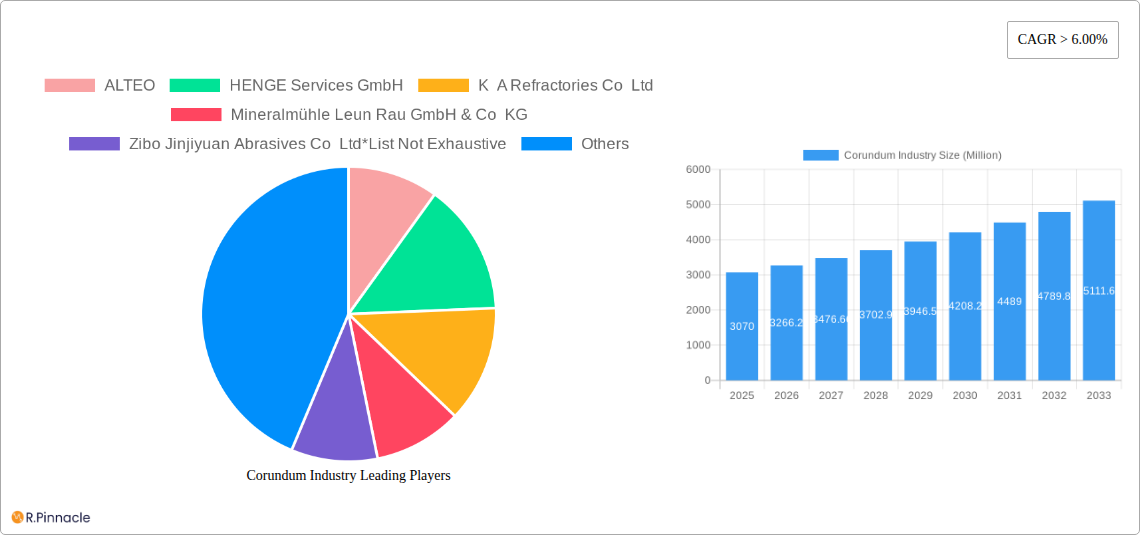
Corundum Industry Market Size (In Billion)
Despite the promising growth trajectory, certain restraints could moderate the market's expansion. Supply chain disruptions, particularly concerning raw material sourcing and geopolitical factors affecting trade routes, could impact production and pricing. Furthermore, environmental regulations related to mining and processing corundum might increase operational costs for manufacturers. Competitive pressures from synthetic corundum producers, offering potentially cost-effective alternatives, present a further challenge. Nevertheless, the ongoing demand from established application segments and the exploration of new applications within emerging sectors like medical and advanced electronics are expected to sustain the overall positive growth outlook for the corundum market throughout the forecast period. The market is geographically diverse, with significant contributions from North America, Europe, and the Asia-Pacific region, each exhibiting unique growth drivers and challenges.
Corundum Industry Company Market Share
Corundum Industry Market Report: 2019-2033
This comprehensive report provides an in-depth analysis of the global corundum industry, offering invaluable insights for industry professionals, investors, and strategic decision-makers. With a detailed examination of market dynamics, competitive landscape, and future growth potential, this report covers the period from 2019 to 2033, with a focus on the 2025 market estimates and a forecast period extending to 2033. The report leverages data from the historical period (2019-2024) to provide a robust foundation for understanding present conditions and predicting future trends.
Corundum Industry Market Structure & Innovation Trends
This section analyzes the competitive landscape of the corundum industry, including market concentration, innovation drivers, regulatory frameworks, product substitutes, end-user demographics, and mergers and acquisitions (M&A) activities. The global corundum market, valued at $XX Million in 2025, exhibits a moderately concentrated structure with key players such as ALTEO, Henge Services GmbH, K A Refractories Co Ltd, Mineralmühle Leun Rau GmbH & Co KG, Zibo Jinjiyuan Abrasives Co Ltd, RIKEN CORUNDUM CO LTD, and RusAL holding significant market share. However, the presence of numerous smaller players indicates a dynamic and competitive environment.
- Market Share Concentration: The top five players account for approximately XX% of the global market share in 2025.
- Innovation Drivers: Research and development focusing on improved material properties, such as enhanced hardness and wear resistance, drives market innovation. Stringent environmental regulations also push innovation towards eco-friendly production processes.
- M&A Activity: The past five years have witnessed XX M&A deals in the corundum industry, with a total deal value estimated at $XX Million, indicating significant consolidation efforts within the sector. These deals primarily aimed at expanding market reach and product portfolios.
- Regulatory Frameworks: Varying environmental regulations across different regions significantly impact production costs and market access for corundum producers.
- Product Substitutes: The emergence of alternative materials, like cubic boron nitride, presents a competitive challenge to corundum's dominance in specific applications.
Corundum Industry Market Dynamics & Trends
This section explores the key factors shaping the growth trajectory of the corundum market, including market growth drivers, technological disruptions, consumer preferences, and competitive dynamics. The global corundum market is projected to experience a CAGR of XX% during the forecast period (2025-2033), driven by rising demand across various applications. Technological advancements in manufacturing processes, particularly in the abrasive and refractory segments, contribute to improved product quality and efficiency, fueling market expansion. Growing consumer preference for high-performance materials in jewelry and industrial applications is another key factor bolstering market growth. Intensifying competition among existing players leads to innovative product development and strategic partnerships. Market penetration in emerging economies is expected to significantly contribute to the overall market expansion during the forecast period.
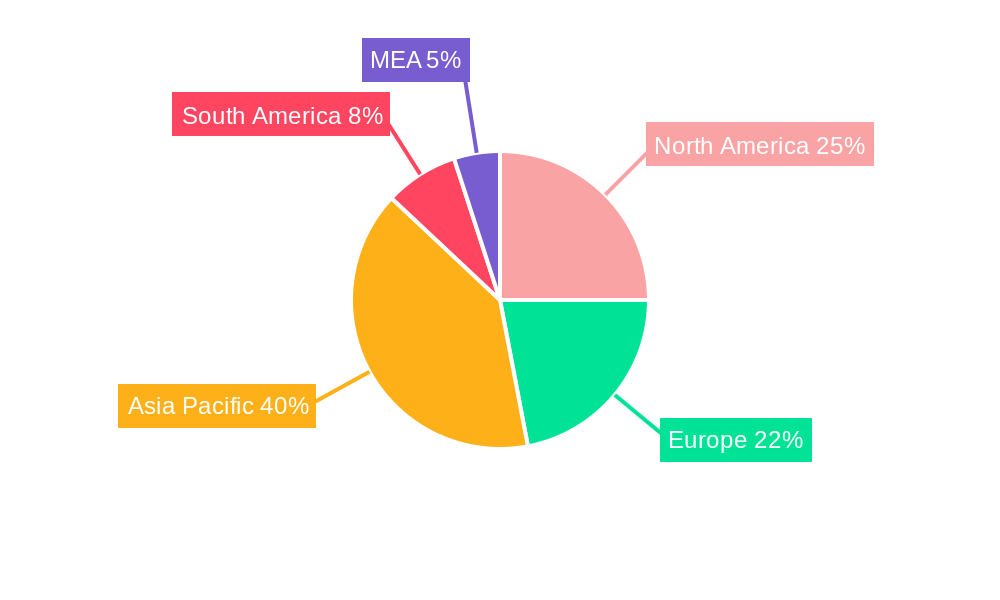
Dominant Regions & Segments in Corundum Industry
This section identifies the leading regions and segments within the corundum market. The analysis encompasses both by type (Emery, Ruby, Sapphire) and by application (Jewelry, Abrasive, Refractory, Mineral, Electrical and Electronics, Other Applications).
Leading Region: Asia Pacific is currently the dominant region, accounting for approximately XX% of the global market share in 2025.
Key Drivers for Asia Pacific Dominance:
- Rapid industrialization and infrastructure development.
- Growing demand from various end-use sectors.
- Favorable government policies supporting industrial growth.
Dominant Segments by Type: The abrasive segment holds the largest market share due to the extensive use of corundum in grinding, polishing, and cutting applications.
Dominant Segments by Application: The abrasive segment commands a significant market share, followed by the refractory segment, which benefits from the material's high melting point and resistance to wear and corrosion.
Corundum Industry Product Innovations
Recent innovations in corundum production focus on enhancing material properties such as hardness, purity, and crystal structure. This involves advanced synthesis techniques and surface modifications. The integration of nanotechnology enhances the performance and efficiency of corundum in high-precision applications. These innovations improve market fit by addressing the specific needs of diverse sectors, leading to increased market penetration and a competitive advantage for manufacturers.
Report Scope & Segmentation Analysis
This report provides a comprehensive segmentation analysis of the corundum market based on type and application.
By Type: Emery, Ruby, and Sapphire segments are analyzed based on their production methods, properties, and market demand. Growth projections and competitive dynamics are discussed for each type. The market size of each type segment is estimated to be $XX Million in 2025.
By Application: The Jewelry, Abrasive, Refractory, Mineral, Electrical and Electronics, and Other Applications (Cutting Tools, Medical, and Others) segments are evaluated based on their growth potential, market size, and competitive landscape. Each application segment’s market size is estimated to be $XX Million in 2025. For instance, the abrasive segment accounts for a major portion of the market due to its use in various industrial processes.
Key Drivers of Corundum Industry Growth
Several factors propel the growth of the corundum industry. Firstly, the increasing demand from the construction and automotive industries fuels market expansion. Secondly, technological advancements leading to enhanced material properties improve its suitability for diverse applications. Finally, supportive government policies and investments in infrastructure projects in developing economies stimulate demand.
Challenges in the Corundum Industry Sector
The corundum industry faces challenges including fluctuations in raw material prices, stringent environmental regulations increasing production costs, and intense competition from alternative materials. Supply chain disruptions also pose a risk to consistent production and market stability. These factors collectively impact market dynamics and profitability.
Emerging Opportunities in Corundum Industry
Emerging opportunities arise from the expansion of high-growth sectors like electronics and renewable energy, driving demand for high-performance corundum materials. The development of novel applications in medical devices and advanced manufacturing also presents potential growth areas. Focus on sustainable production methods and eco-friendly alternatives offers a significant opportunity for market expansion.
Leading Players in the Corundum Industry Market
- ALTEO
- Henge Services GmbH
- K A Refractories Co Ltd
- Mineralmühle Leun Rau GmbH & Co KG
- Zibo Jinjiyuan Abrasives Co Ltd
- RIKEN CORUNDUM CO LTD
- RusAL
Key Developments in Corundum Industry
- 2022 Q3: ALTEO announced a significant investment in expanding its corundum production capacity.
- 2023 Q1: A new technology for enhancing corundum hardness was patented by a leading research institute.
- 2024 Q2: A major merger between two corundum manufacturers reshaped the market landscape. (Further details are available within the full report).
Future Outlook for Corundum Industry Market
The corundum industry is poised for robust growth, driven by sustained demand from diverse applications. Continued technological advancements, particularly in materials science and nanotechnology, will further improve corundum's properties and expand its applications. Strategic partnerships and investments in sustainable production processes will shape the industry's future.
Corundum Industry Segmentation
-
1. Type
- 1.1. Emery
- 1.2. Ruby
- 1.3. Sapphire
-
2. Application
- 2.1. Jewelry
- 2.2. Abrasive
- 2.3. Refractory
- 2.4. Mineral
- 2.5. Electrical and Electronics
- 2.6. Other Ap
Corundum Industry Segmentation By Geography
-
1. Asia Pacific
- 1.1. China
- 1.2. India
- 1.3. Japan
- 1.4. South Korea
- 1.5. Malaysia
- 1.6. Thailand
- 1.7. Indonesia
- 1.8. Vietnam
- 1.9. Rest of Asia Pacific
-
2. North America
- 2.1. United States
- 2.2. Canada
- 2.3. Mexico
-
3. Europe
- 3.1. Germany
- 3.2. United Kingdom
- 3.3. France
- 3.4. Italy
- 3.5. Spain
- 3.6. Nordic Countries
- 3.7. Turkey
- 3.8. Russia
- 3.9. Rest of Europe
-
4. South America
- 4.1. Brazil
- 4.2. Argentina
- 4.3. Colombia
- 4.4. Rest of South America
-
5. Middle East and Africa
- 5.1. Saudi Arabia
- 5.2. South Africa
- 5.3. Nigeria
- 5.4. Qatar
- 5.5. Egypt
- 5.6. United Arab Emirates
- 5.7. Rest of Middle East and Africa
Corundum Industry Regional Market Share
Geographic Coverage of Corundum Industry
Corundum Industry REPORT HIGHLIGHTS
| Aspects | Details |
|---|---|
| Study Period | 2020-2034 |
| Base Year | 2025 |
| Estimated Year | 2026 |
| Forecast Period | 2026-2034 |
| Historical Period | 2020-2025 |
| Growth Rate | CAGR of > 6.00% from 2020-2034 |
| Segmentation |
|
Table of Contents
- 1. Introduction
- 1.1. Research Scope
- 1.2. Market Segmentation
- 1.3. Research Objective
- 1.4. Definitions and Assumptions
- 2. Executive Summary
- 2.1. Market Snapshot
- 3. Market Dynamics
- 3.1. Market Drivers
- 3.2. Market Restrains
- 3.3. Market Trends
- 3.4. Market Opportunities
- 4. Market Factor Analysis
- 4.1. Porters Five Forces
- 4.1.1. Bargaining Power of Suppliers
- 4.1.2. Bargaining Power of Buyers
- 4.1.3. Threat of New Entrants
- 4.1.4. Threat of Substitutes
- 4.1.5. Competitive Rivalry
- 4.2. PESTEL analysis
- 4.3. BCG Analysis
- 4.3.1. Stars (High Growth, High Market Share)
- 4.3.2. Cash Cows (Low Growth, High Market Share)
- 4.3.3. Question Mark (High Growth, Low Market Share)
- 4.3.4. Dogs (Low Growth, Low Market Share)
- 4.4. Ansoff Matrix Analysis
- 4.5. Supply Chain Analysis
- 4.6. Regulatory Landscape
- 4.7. Current Market Potential and Opportunity Assessment (TAM–SAM–SOM Framework)
- 4.8. PRI Analyst Note
- 4.1. Porters Five Forces
- 5. Market Analysis, Insights and Forecast 2021-2033
- 5.1. Market Analysis, Insights and Forecast - by Type
- 5.1.1. Emery
- 5.1.2. Ruby
- 5.1.3. Sapphire
- 5.2. Market Analysis, Insights and Forecast - by Application
- 5.2.1. Jewelry
- 5.2.2. Abrasive
- 5.2.3. Refractory
- 5.2.4. Mineral
- 5.2.5. Electrical and Electronics
- 5.2.6. Other Ap
- 5.3. Market Analysis, Insights and Forecast - by Region
- 5.3.1. Asia Pacific
- 5.3.2. North America
- 5.3.3. Europe
- 5.3.4. South America
- 5.3.5. Middle East and Africa
- 5.1. Market Analysis, Insights and Forecast - by Type
- 6. Global Corundum Industry Analysis, Insights and Forecast, 2021-2033
- 6.1. Market Analysis, Insights and Forecast - by Type
- 6.1.1. Emery
- 6.1.2. Ruby
- 6.1.3. Sapphire
- 6.2. Market Analysis, Insights and Forecast - by Application
- 6.2.1. Jewelry
- 6.2.2. Abrasive
- 6.2.3. Refractory
- 6.2.4. Mineral
- 6.2.5. Electrical and Electronics
- 6.2.6. Other Ap
- 6.1. Market Analysis, Insights and Forecast - by Type
- 7. Asia Pacific Corundum Industry Analysis, Insights and Forecast, 2020-2032
- 7.1. Market Analysis, Insights and Forecast - by Type
- 7.1.1. Emery
- 7.1.2. Ruby
- 7.1.3. Sapphire
- 7.2. Market Analysis, Insights and Forecast - by Application
- 7.2.1. Jewelry
- 7.2.2. Abrasive
- 7.2.3. Refractory
- 7.2.4. Mineral
- 7.2.5. Electrical and Electronics
- 7.2.6. Other Ap
- 7.1. Market Analysis, Insights and Forecast - by Type
- 8. North America Corundum Industry Analysis, Insights and Forecast, 2020-2032
- 8.1. Market Analysis, Insights and Forecast - by Type
- 8.1.1. Emery
- 8.1.2. Ruby
- 8.1.3. Sapphire
- 8.2. Market Analysis, Insights and Forecast - by Application
- 8.2.1. Jewelry
- 8.2.2. Abrasive
- 8.2.3. Refractory
- 8.2.4. Mineral
- 8.2.5. Electrical and Electronics
- 8.2.6. Other Ap
- 8.1. Market Analysis, Insights and Forecast - by Type
- 9. Europe Corundum Industry Analysis, Insights and Forecast, 2020-2032
- 9.1. Market Analysis, Insights and Forecast - by Type
- 9.1.1. Emery
- 9.1.2. Ruby
- 9.1.3. Sapphire
- 9.2. Market Analysis, Insights and Forecast - by Application
- 9.2.1. Jewelry
- 9.2.2. Abrasive
- 9.2.3. Refractory
- 9.2.4. Mineral
- 9.2.5. Electrical and Electronics
- 9.2.6. Other Ap
- 9.1. Market Analysis, Insights and Forecast - by Type
- 10. South America Corundum Industry Analysis, Insights and Forecast, 2020-2032
- 10.1. Market Analysis, Insights and Forecast - by Type
- 10.1.1. Emery
- 10.1.2. Ruby
- 10.1.3. Sapphire
- 10.2. Market Analysis, Insights and Forecast - by Application
- 10.2.1. Jewelry
- 10.2.2. Abrasive
- 10.2.3. Refractory
- 10.2.4. Mineral
- 10.2.5. Electrical and Electronics
- 10.2.6. Other Ap
- 10.1. Market Analysis, Insights and Forecast - by Type
- 11. Middle East and Africa Corundum Industry Analysis, Insights and Forecast, 2020-2032
- 11.1. Market Analysis, Insights and Forecast - by Type
- 11.1.1. Emery
- 11.1.2. Ruby
- 11.1.3. Sapphire
- 11.2. Market Analysis, Insights and Forecast - by Application
- 11.2.1. Jewelry
- 11.2.2. Abrasive
- 11.2.3. Refractory
- 11.2.4. Mineral
- 11.2.5. Electrical and Electronics
- 11.2.6. Other Ap
- 11.1. Market Analysis, Insights and Forecast - by Type
- 12. Competitive Analysis
- 12.1. Company Profiles
- 12.1.1 ALTEO
- 12.1.1.1. Company Overview
- 12.1.1.2. Products
- 12.1.1.3. Company Financials
- 12.1.1.4. SWOT Analysis
- 12.1.2 HENGE Services GmbH
- 12.1.2.1. Company Overview
- 12.1.2.2. Products
- 12.1.2.3. Company Financials
- 12.1.2.4. SWOT Analysis
- 12.1.3 K A Refractories Co Ltd
- 12.1.3.1. Company Overview
- 12.1.3.2. Products
- 12.1.3.3. Company Financials
- 12.1.3.4. SWOT Analysis
- 12.1.4 Mineralmühle Leun Rau GmbH & Co KG
- 12.1.4.1. Company Overview
- 12.1.4.2. Products
- 12.1.4.3. Company Financials
- 12.1.4.4. SWOT Analysis
- 12.1.5 Zibo Jinjiyuan Abrasives Co Ltd*List Not Exhaustive
- 12.1.5.1. Company Overview
- 12.1.5.2. Products
- 12.1.5.3. Company Financials
- 12.1.5.4. SWOT Analysis
- 12.1.6 RIKEN CORUNDUM CO LTD
- 12.1.6.1. Company Overview
- 12.1.6.2. Products
- 12.1.6.3. Company Financials
- 12.1.6.4. SWOT Analysis
- 12.1.7 RusAL
- 12.1.7.1. Company Overview
- 12.1.7.2. Products
- 12.1.7.3. Company Financials
- 12.1.7.4. SWOT Analysis
- 12.1.1 ALTEO
- 12.2. Market Entropy
- 12.2.1 Company's Key Areas Served
- 12.2.2 Recent Developments
- 12.3. Company Market Share Analysis 2025
- 12.3.1 Top 5 Companies Market Share Analysis
- 12.3.2 Top 3 Companies Market Share Analysis
- 12.4. List of Potential Customers
- 13. Research Methodology
List of Figures
- Figure 1: Global Corundum Industry Revenue Breakdown (Million, %) by Region 2025 & 2033
- Figure 2: Asia Pacific Corundum Industry Revenue (Million), by Type 2025 & 2033
- Figure 3: Asia Pacific Corundum Industry Revenue Share (%), by Type 2025 & 2033
- Figure 4: Asia Pacific Corundum Industry Revenue (Million), by Application 2025 & 2033
- Figure 5: Asia Pacific Corundum Industry Revenue Share (%), by Application 2025 & 2033
- Figure 6: Asia Pacific Corundum Industry Revenue (Million), by Country 2025 & 2033
- Figure 7: Asia Pacific Corundum Industry Revenue Share (%), by Country 2025 & 2033
- Figure 8: North America Corundum Industry Revenue (Million), by Type 2025 & 2033
- Figure 9: North America Corundum Industry Revenue Share (%), by Type 2025 & 2033
- Figure 10: North America Corundum Industry Revenue (Million), by Application 2025 & 2033
- Figure 11: North America Corundum Industry Revenue Share (%), by Application 2025 & 2033
- Figure 12: North America Corundum Industry Revenue (Million), by Country 2025 & 2033
- Figure 13: North America Corundum Industry Revenue Share (%), by Country 2025 & 2033
- Figure 14: Europe Corundum Industry Revenue (Million), by Type 2025 & 2033
- Figure 15: Europe Corundum Industry Revenue Share (%), by Type 2025 & 2033
- Figure 16: Europe Corundum Industry Revenue (Million), by Application 2025 & 2033
- Figure 17: Europe Corundum Industry Revenue Share (%), by Application 2025 & 2033
- Figure 18: Europe Corundum Industry Revenue (Million), by Country 2025 & 2033
- Figure 19: Europe Corundum Industry Revenue Share (%), by Country 2025 & 2033
- Figure 20: South America Corundum Industry Revenue (Million), by Type 2025 & 2033
- Figure 21: South America Corundum Industry Revenue Share (%), by Type 2025 & 2033
- Figure 22: South America Corundum Industry Revenue (Million), by Application 2025 & 2033
- Figure 23: South America Corundum Industry Revenue Share (%), by Application 2025 & 2033
- Figure 24: South America Corundum Industry Revenue (Million), by Country 2025 & 2033
- Figure 25: South America Corundum Industry Revenue Share (%), by Country 2025 & 2033
- Figure 26: Middle East and Africa Corundum Industry Revenue (Million), by Type 2025 & 2033
- Figure 27: Middle East and Africa Corundum Industry Revenue Share (%), by Type 2025 & 2033
- Figure 28: Middle East and Africa Corundum Industry Revenue (Million), by Application 2025 & 2033
- Figure 29: Middle East and Africa Corundum Industry Revenue Share (%), by Application 2025 & 2033
- Figure 30: Middle East and Africa Corundum Industry Revenue (Million), by Country 2025 & 2033
- Figure 31: Middle East and Africa Corundum Industry Revenue Share (%), by Country 2025 & 2033
List of Tables
- Table 1: Global Corundum Industry Revenue Million Forecast, by Type 2020 & 2033
- Table 2: Global Corundum Industry Revenue Million Forecast, by Application 2020 & 2033
- Table 3: Global Corundum Industry Revenue Million Forecast, by Region 2020 & 2033
- Table 4: Global Corundum Industry Revenue Million Forecast, by Type 2020 & 2033
- Table 5: Global Corundum Industry Revenue Million Forecast, by Application 2020 & 2033
- Table 6: Global Corundum Industry Revenue Million Forecast, by Country 2020 & 2033
- Table 7: China Corundum Industry Revenue (Million) Forecast, by Application 2020 & 2033
- Table 8: India Corundum Industry Revenue (Million) Forecast, by Application 2020 & 2033
- Table 9: Japan Corundum Industry Revenue (Million) Forecast, by Application 2020 & 2033
- Table 10: South Korea Corundum Industry Revenue (Million) Forecast, by Application 2020 & 2033
- Table 11: Malaysia Corundum Industry Revenue (Million) Forecast, by Application 2020 & 2033
- Table 12: Thailand Corundum Industry Revenue (Million) Forecast, by Application 2020 & 2033
- Table 13: Indonesia Corundum Industry Revenue (Million) Forecast, by Application 2020 & 2033
- Table 14: Vietnam Corundum Industry Revenue (Million) Forecast, by Application 2020 & 2033
- Table 15: Rest of Asia Pacific Corundum Industry Revenue (Million) Forecast, by Application 2020 & 2033
- Table 16: Global Corundum Industry Revenue Million Forecast, by Type 2020 & 2033
- Table 17: Global Corundum Industry Revenue Million Forecast, by Application 2020 & 2033
- Table 18: Global Corundum Industry Revenue Million Forecast, by Country 2020 & 2033
- Table 19: United States Corundum Industry Revenue (Million) Forecast, by Application 2020 & 2033
- Table 20: Canada Corundum Industry Revenue (Million) Forecast, by Application 2020 & 2033
- Table 21: Mexico Corundum Industry Revenue (Million) Forecast, by Application 2020 & 2033
- Table 22: Global Corundum Industry Revenue Million Forecast, by Type 2020 & 2033
- Table 23: Global Corundum Industry Revenue Million Forecast, by Application 2020 & 2033
- Table 24: Global Corundum Industry Revenue Million Forecast, by Country 2020 & 2033
- Table 25: Germany Corundum Industry Revenue (Million) Forecast, by Application 2020 & 2033
- Table 26: United Kingdom Corundum Industry Revenue (Million) Forecast, by Application 2020 & 2033
- Table 27: France Corundum Industry Revenue (Million) Forecast, by Application 2020 & 2033
- Table 28: Italy Corundum Industry Revenue (Million) Forecast, by Application 2020 & 2033
- Table 29: Spain Corundum Industry Revenue (Million) Forecast, by Application 2020 & 2033
- Table 30: Nordic Countries Corundum Industry Revenue (Million) Forecast, by Application 2020 & 2033
- Table 31: Turkey Corundum Industry Revenue (Million) Forecast, by Application 2020 & 2033
- Table 32: Russia Corundum Industry Revenue (Million) Forecast, by Application 2020 & 2033
- Table 33: Rest of Europe Corundum Industry Revenue (Million) Forecast, by Application 2020 & 2033
- Table 34: Global Corundum Industry Revenue Million Forecast, by Type 2020 & 2033
- Table 35: Global Corundum Industry Revenue Million Forecast, by Application 2020 & 2033
- Table 36: Global Corundum Industry Revenue Million Forecast, by Country 2020 & 2033
- Table 37: Brazil Corundum Industry Revenue (Million) Forecast, by Application 2020 & 2033
- Table 38: Argentina Corundum Industry Revenue (Million) Forecast, by Application 2020 & 2033
- Table 39: Colombia Corundum Industry Revenue (Million) Forecast, by Application 2020 & 2033
- Table 40: Rest of South America Corundum Industry Revenue (Million) Forecast, by Application 2020 & 2033
- Table 41: Global Corundum Industry Revenue Million Forecast, by Type 2020 & 2033
- Table 42: Global Corundum Industry Revenue Million Forecast, by Application 2020 & 2033
- Table 43: Global Corundum Industry Revenue Million Forecast, by Country 2020 & 2033
- Table 44: Saudi Arabia Corundum Industry Revenue (Million) Forecast, by Application 2020 & 2033
- Table 45: South Africa Corundum Industry Revenue (Million) Forecast, by Application 2020 & 2033
- Table 46: Nigeria Corundum Industry Revenue (Million) Forecast, by Application 2020 & 2033
- Table 47: Qatar Corundum Industry Revenue (Million) Forecast, by Application 2020 & 2033
- Table 48: Egypt Corundum Industry Revenue (Million) Forecast, by Application 2020 & 2033
- Table 49: United Arab Emirates Corundum Industry Revenue (Million) Forecast, by Application 2020 & 2033
- Table 50: Rest of Middle East and Africa Corundum Industry Revenue (Million) Forecast, by Application 2020 & 2033
Frequently Asked Questions
1. What is the projected Compound Annual Growth Rate (CAGR) of the Corundum Industry?
The projected CAGR is approximately > 6.00%.
2. Which companies are prominent players in the Corundum Industry?
Key companies in the market include ALTEO, HENGE Services GmbH, K A Refractories Co Ltd, Mineralmühle Leun Rau GmbH & Co KG, Zibo Jinjiyuan Abrasives Co Ltd*List Not Exhaustive, RIKEN CORUNDUM CO LTD, RusAL.
3. What are the main segments of the Corundum Industry?
The market segments include Type, Application.
4. Can you provide details about the market size?
The market size is estimated to be USD 3.07 Million as of 2022.
5. What are some drivers contributing to market growth?
High Demand for Synthetic Corundum in Abrasion Applications; Growing Demand of Artificial Corundum in Jewelry Sector; Others.
6. What are the notable trends driving market growth?
Jewelry Segment to Dominate the Market.
7. Are there any restraints impacting market growth?
Competition from Fused Alumina and Silicon Carbide; Others.
8. Can you provide examples of recent developments in the market?
N/A
9. What pricing options are available for accessing the report?
Pricing options include single-user, multi-user, and enterprise licenses priced at USD 4750, USD 5250, and USD 8750 respectively.
10. Is the market size provided in terms of value or volume?
The market size is provided in terms of value, measured in Million.
11. Are there any specific market keywords associated with the report?
Yes, the market keyword associated with the report is "Corundum Industry," which aids in identifying and referencing the specific market segment covered.
12. How do I determine which pricing option suits my needs best?
The pricing options vary based on user requirements and access needs. Individual users may opt for single-user licenses, while businesses requiring broader access may choose multi-user or enterprise licenses for cost-effective access to the report.
13. Are there any additional resources or data provided in the Corundum Industry report?
While the report offers comprehensive insights, it's advisable to review the specific contents or supplementary materials provided to ascertain if additional resources or data are available.
14. How can I stay updated on further developments or reports in the Corundum Industry?
To stay informed about further developments, trends, and reports in the Corundum Industry, consider subscribing to industry newsletters, following relevant companies and organizations, or regularly checking reputable industry news sources and publications.
Methodology
Step 1 - Identification of Relevant Samples Size from Population Database


Step 2 - Approaches for Defining Global Market Size (Value, Volume* & Price*)

Note*: In applicable scenarios
Step 3 - Data Sources
Primary Research
- Web Analytics
- Survey Reports
- Research Institute
- Latest Research Reports
- Opinion Leaders
Secondary Research
- Annual Reports
- White Paper
- Latest Press Release
- Industry Association
- Paid Database
- Investor Presentations

Step 4 - Data Triangulation
Involves using different sources of information in order to increase the validity of a study
These sources are likely to be stakeholders in a program - participants, other researchers, program staff, other community members, and so on.
Then we put all data in single framework & apply various statistical tools to find out the dynamic on the market.
During the analysis stage, feedback from the stakeholder groups would be compared to determine areas of agreement as well as areas of divergence