

Key Insights
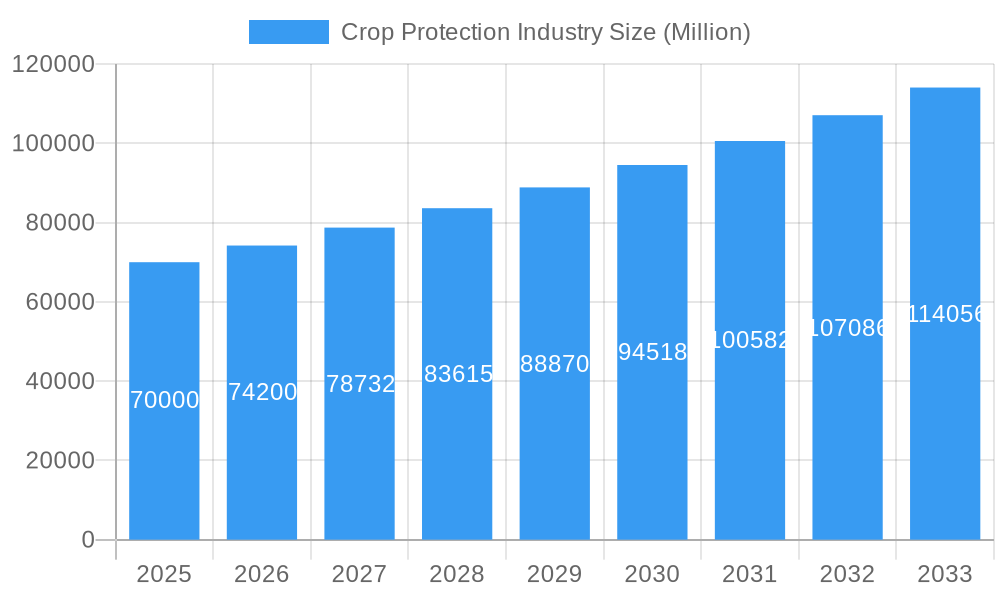
The global crop protection market, valued at approximately $70 billion in 2025, is projected to experience robust growth, exhibiting a Compound Annual Growth Rate (CAGR) of 5.60% from 2025 to 2033. This expansion is driven by several key factors. Rising global population necessitates increased food production, fueling demand for effective crop protection solutions to combat pests, diseases, and weeds. Furthermore, the increasing adoption of advanced agricultural technologies, such as precision farming and drone technology for targeted pesticide application, is enhancing efficiency and minimizing environmental impact, thereby boosting market growth. The shift towards sustainable agricultural practices, including integrated pest management (IPM) strategies, is also influencing market dynamics, fostering demand for biopesticides and other eco-friendly solutions alongside conventional chemical products. However, stringent government regulations regarding pesticide use and growing concerns regarding the environmental and health implications of certain chemicals pose significant challenges to the industry. Market segmentation reveals substantial contributions from various crop types, with commercial crops, fruits & vegetables, and grains & cereals representing the largest segments. Application methods like foliar spraying and seed treatment remain dominant, while chemigation and soil treatment are showing promising growth due to their efficiency. Key players like FMC Corporation, Sumitomo Chemical, Adama, Bayer, UPL, Syngenta, and BASF are continuously investing in research and development to introduce innovative crop protection products, further stimulating market growth.
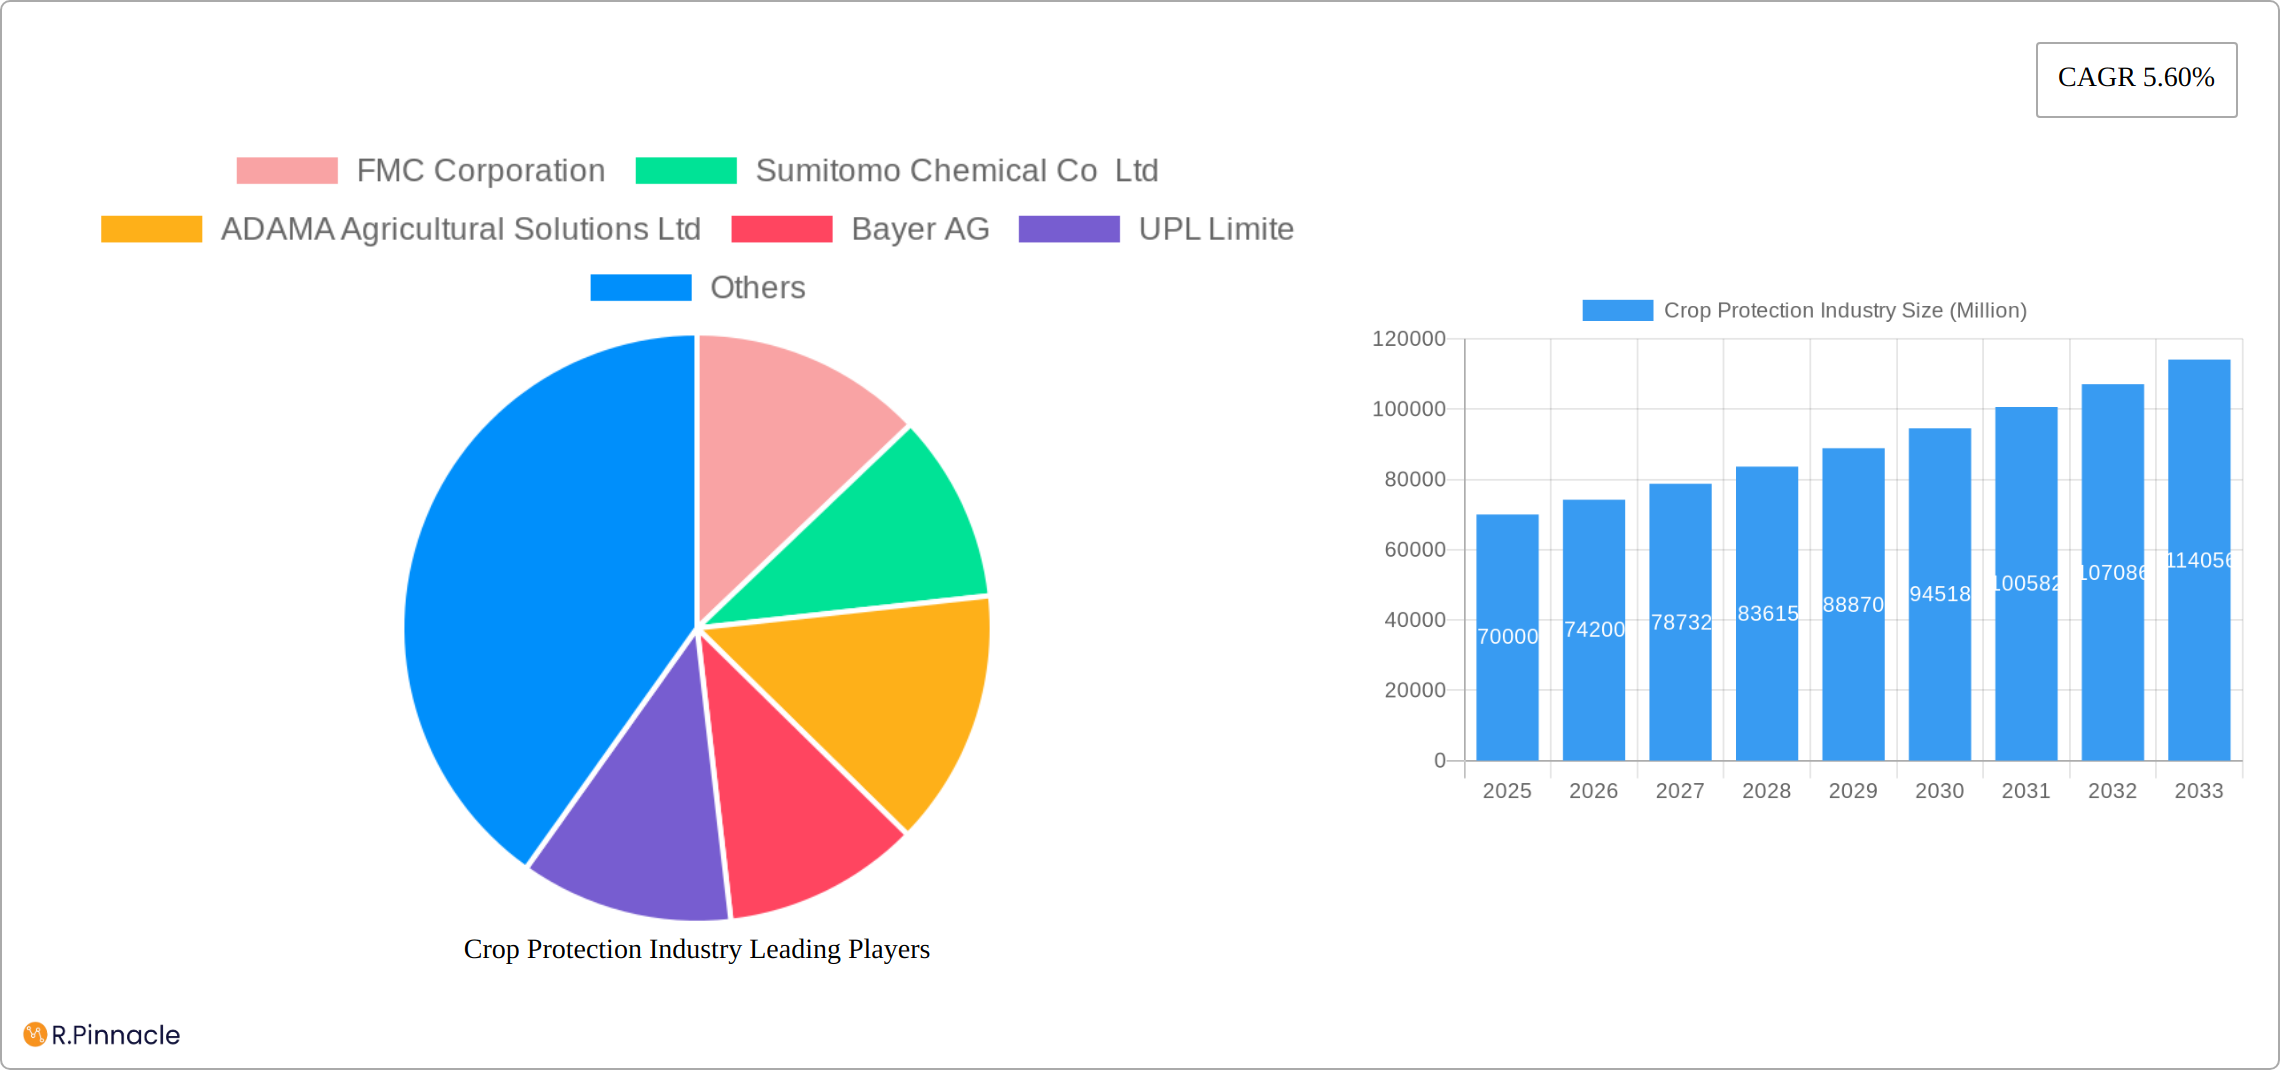
Crop Protection Industry Market Size (In Billion)
The market's competitive landscape is characterized by both established multinational corporations and regional players. These companies are engaged in intense competition, focusing on product innovation, strategic partnerships, and mergers and acquisitions to strengthen their market position. The geographical distribution of the market reflects varying levels of agricultural development and regulatory landscapes across different regions. While North America and Europe are currently major markets, significant growth opportunities exist in emerging economies in Asia and Latin America, driven by rising agricultural production and increasing awareness of crop protection's importance. Future growth will likely be influenced by advancements in biotechnology, the development of novel pest-resistant crop varieties, and ongoing efforts to mitigate the environmental impact of crop protection practices. The market will continue to evolve, shaped by the delicate balance between the need for increased food security and the growing emphasis on environmental sustainability.
Crop Protection Industry Company Market Share
This comprehensive report provides an in-depth analysis of the Crop Protection Industry, offering invaluable insights for industry professionals, investors, and stakeholders. With a study period spanning 2019-2033, a base year of 2025, and a forecast period of 2025-2033, this report leverages extensive data analysis to present a clear picture of the market's current state and future trajectory. The global market size is estimated at $XX Million in 2025, showcasing substantial growth potential.
Crop Protection Industry Market Structure & Innovation Trends
The crop protection industry is characterized by a concentrated market structure, with several multinational corporations holding significant market share. Companies like Bayer AG, Syngenta Group, and BASF SE consistently rank among the top players, commanding a combined market share of approximately xx%. However, regional players and smaller specialized firms are also present, particularly in emerging markets. Innovation is driven by the need for more effective and environmentally sustainable crop protection solutions, coupled with evolving regulatory frameworks that favor reduced chemical usage. Key innovation drivers include advancements in biotechnology, nanotechnology, and AI-driven precision agriculture. Significant M&A activity is also observed, with deal values exceeding $XX Million in recent years, further consolidating the industry landscape. For example, the merger of Company A and Company B in 2022 resulted in a combined market share of xx%, reshaping competitive dynamics.
- Market Concentration: High, with top players controlling a significant portion.
- Innovation Drivers: Biotechnology, Nanotechnology, AI-driven precision agriculture, regulatory pressure for sustainable solutions.
- Regulatory Frameworks: Stringent regulations driving innovation towards environmentally friendly products.
- Product Substitutes: Biological control agents, integrated pest management strategies.
- M&A Activity: High levels of mergers and acquisitions, shaping market structure. Deal values exceeding $XX Million annually.
Crop Protection Industry Market Dynamics & Trends
The crop protection market is experiencing robust growth, fueled by a confluence of factors. Global food demand continues to rise, placing increasing pressure on agricultural production. Simultaneously, climate change is exacerbating pest and disease outbreaks, necessitating more robust crop protection strategies. The expansion of high-value commercial crops further contributes to market expansion. This market is projected to achieve a Compound Annual Growth Rate (CAGR) of xx% between 2025 and 2033. Technological advancements are revolutionizing the industry. Drones enable precise pesticide application, minimizing environmental impact and optimizing resource allocation. The development and adoption of biopesticides offer environmentally friendly alternatives, responding to the growing consumer preference for sustainable agricultural practices. The competitive landscape is dynamic, characterized by ongoing innovation, strategic mergers and acquisitions (M&A), and collaborative partnerships aimed at securing market leadership. Biopesticide market penetration is steadily rising, with an estimated xx% market share projected for 2025.
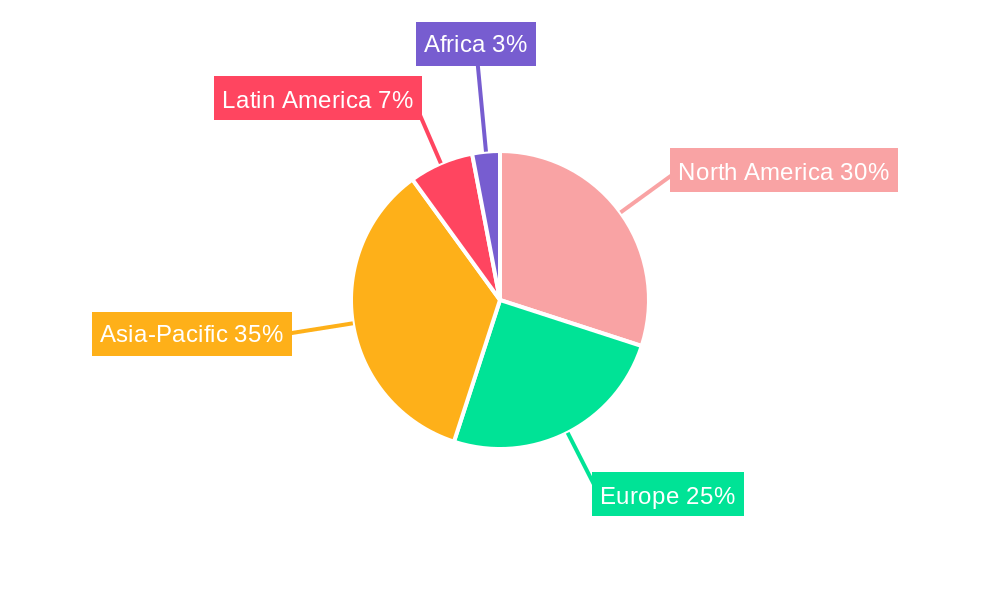
Dominant Regions & Segments in Crop Protection Industry
The North American and European regions currently dominate the crop protection market due to advanced agricultural practices, high adoption rates of modern technologies, and stringent regulatory frameworks. However, Asia-Pacific is witnessing the fastest growth, fueled by expanding agricultural land, increasing food demand, and rising disposable incomes.
- Leading Region: North America (xx% market share in 2025)
- Key Drivers for North America: High adoption of advanced technologies, stringent regulations pushing innovation, and large commercial crop area.
- Key Drivers for Asia-Pacific: Rapid agricultural expansion, increasing food demand, rising disposable incomes, government support for agriculture.
Dominant Segments:
- Function: Herbicides currently hold the largest market share, followed by insecticides and fungicides. The demand for herbicides is driven by the need for weed control in various crops.
- Application Mode: Foliar application dominates due to its ease of use and effectiveness. However, seed treatment is gaining traction due to its targeted approach.
- Crop Type: Grains & Cereals and Fruits & Vegetables represent the largest segments due to high production volume and susceptibility to pests and diseases.
Crop Protection Industry Product Innovations
Recent product innovations highlight a strong trend toward targeted and sustainable solutions. Companies are focusing on developing products with improved efficacy, reduced environmental impact, and enhanced safety profiles. This includes advancements in biopesticides, formulations with reduced chemical load, and precise application technologies. For example, the launch of Nufarm’s Tourney EZ liquid formulation fungicide specifically for turf and ornamental crops demonstrates this focus on niche market needs and customer demand.
Report Scope & Segmentation Analysis
This report provides a comprehensive segmentation of the crop protection market, analyzing key aspects:
- Function: Fungicides, herbicides, insecticides, molluscicides, and nematicides. The report details the market size and growth projections for each segment.
- Application Mode: Chemigation, foliar application, fumigation, seed treatment, and soil treatment. Each segment's market size and growth projections are analyzed in detail within the full report.
- Crop Type: Commercial crops, fruits & vegetables, grains & cereals, pulses & oilseeds, and turf & ornamentals. The report provides a detailed breakdown of market size and growth projections for each crop type.
Competitive dynamics within each segment are influenced by factors such as specific product characteristics, application methods, and target crop types. The report examines these nuances to provide a complete picture of the market landscape.
Key Drivers of Crop Protection Industry Growth
The crop protection industry's growth is propelled by several key factors:
- Increasing Global Food Demand: A growing global population necessitates higher agricultural output.
- Climate Change Impacts: Changing weather patterns increase pest and disease pressure.
- Technological Advancements: Innovations in biopesticides and precision agriculture enhance crop protection.
- Government Support: Policies and subsidies aimed at boosting agricultural productivity.
Challenges in the Crop Protection Industry Sector
The crop protection industry faces significant challenges:
- Stringent Regulations: Increasingly strict environmental regulations globally are limiting the use of certain chemical pesticides, driving innovation towards safer alternatives.
- Supply Chain Disruptions: Geopolitical instability and unforeseen events can severely disrupt supply chains, impacting the availability of both raw materials and finished products.
- Competitive Pressure: The intense competition requires continuous innovation, cost optimization strategies, and a focus on differentiated product offerings.
- Resistance Development: The development of pest and disease resistance to existing crop protection solutions necessitates the ongoing development of new and effective products.
- Consumer Pressure for Sustainability: Growing consumer awareness of environmental issues and demand for sustainable agricultural practices puts pressure on the industry to develop eco-friendly solutions.
Emerging Opportunities in Crop Protection Industry
Significant opportunities exist for growth in:
- Biopesticides: Growing demand for sustainable and environmentally friendly solutions.
- Precision Agriculture: Technologies enabling targeted application of crop protection products.
- Digital Agriculture: Data analytics and AI-driven solutions for improved pest and disease management.
- Emerging Markets: Expanding agricultural sectors in developing countries present significant growth potential.
Leading Players in the Crop Protection Industry Market
- FMC Corporation
- Sumitomo Chemical Co Ltd
- ADAMA Agricultural Solutions Ltd
- Bayer AG
- UPL Limited
- Syngenta Group
- Jiangsu Yangnong Chemical Co Ltd
- Corteva Agriscience
- Nufarm Ltd
- BASF SE
Key Developments in Crop Protection Industry
- December 2023: ADAMA launched Kampai, a cross-spectrum herbicide for grain crops, expanding application windows for weed control.
- July 2023: ADAMA introduced Davai A Plus and Clearfield Broad-Spectrum Herbicide Solutions for imidazolinone-tolerant legumes.
- April 2023: Nufarm launched Tourney EZ, a liquid fungicide for turf and ornamental crops, strengthening its market position.
Future Outlook for Crop Protection Industry Market
The crop protection market is poised for continued, strong growth, driven by several key factors. Technological advancements, such as precision application technologies and the development of novel biopesticides, will play a crucial role. The relentless increase in global food demand and the growing consumer focus on sustainable agriculture practices will also continue to drive market expansion. Strategic partnerships, mergers and acquisitions, and a concentrated focus on innovation will shape the future competitive landscape. The market is projected to reach $XX Million by 2033, representing a significant growth opportunity for established players and new entrants alike. The industry will increasingly focus on developing integrated pest management (IPM) strategies and offering tailored solutions for specific crop types and regional challenges.
Crop Protection Industry Segmentation
-
1. Function
- 1.1. Fungicide
- 1.2. Herbicide
- 1.3. Insecticide
- 1.4. Molluscicide
- 1.5. Nematicide
-
2. Application Mode
- 2.1. Chemigation
- 2.2. Foliar
- 2.3. Fumigation
- 2.4. Seed Treatment
- 2.5. Soil Treatment
-
3. Crop Type
- 3.1. Commercial Crops
- 3.2. Fruits & Vegetables
- 3.3. Grains & Cereals
- 3.4. Pulses & Oilseeds
- 3.5. Turf & Ornamental
-
4. Function
- 4.1. Fungicide
- 4.2. Herbicide
- 4.3. Insecticide
- 4.4. Molluscicide
- 4.5. Nematicide
-
5. Application Mode
- 5.1. Chemigation
- 5.2. Foliar
- 5.3. Fumigation
- 5.4. Seed Treatment
- 5.5. Soil Treatment
-
6. Crop Type
- 6.1. Commercial Crops
- 6.2. Fruits & Vegetables
- 6.3. Grains & Cereals
- 6.4. Pulses & Oilseeds
- 6.5. Turf & Ornamental
Crop Protection Industry Segmentation By Geography
-
1. North America
- 1.1. United States
- 1.2. Canada
- 1.3. Mexico
-
2. South America
- 2.1. Brazil
- 2.2. Argentina
- 2.3. Rest of South America
-
3. Europe
- 3.1. United Kingdom
- 3.2. Germany
- 3.3. France
- 3.4. Italy
- 3.5. Spain
- 3.6. Russia
- 3.7. Benelux
- 3.8. Nordics
- 3.9. Rest of Europe
-
4. Middle East & Africa
- 4.1. Turkey
- 4.2. Israel
- 4.3. GCC
- 4.4. North Africa
- 4.5. South Africa
- 4.6. Rest of Middle East & Africa
-
5. Asia Pacific
- 5.1. China
- 5.2. India
- 5.3. Japan
- 5.4. South Korea
- 5.5. ASEAN
- 5.6. Oceania
- 5.7. Rest of Asia Pacific
Crop Protection Industry Regional Market Share
Geographic Coverage of Crop Protection Industry
Crop Protection Industry REPORT HIGHLIGHTS
| Aspects | Details |
|---|---|
| Study Period | 2020-2034 |
| Base Year | 2025 |
| Estimated Year | 2026 |
| Forecast Period | 2026-2034 |
| Historical Period | 2020-2025 |
| Growth Rate | CAGR of 5.60% from 2020-2034 |
| Segmentation |
|
Table of Contents
- 1. Introduction
- 1.1. Research Scope
- 1.2. Market Segmentation
- 1.3. Research Methodology
- 1.4. Definitions and Assumptions
- 2. Executive Summary
- 2.1. Introduction
- 3. Market Dynamics
- 3.1. Introduction
- 3.2. Market Drivers
- 3.2.1. Seed Treatment As A Solution To Enhance Yield; Growing Awareness For Seed Treatment Among The Farmers; Rising Trend Of Organic Farming
- 3.3. Market Restrains
- 3.3.1. Limitations Across Farm-Level Seed Treatment; Rising Environmental Concerns
- 3.4. Market Trends
- 3.4.1. OTHER KEY INDUSTRY TRENDS COVERED IN THE REPORT
- 4. Market Factor Analysis
- 4.1. Porters Five Forces
- 4.2. Supply/Value Chain
- 4.3. PESTEL analysis
- 4.4. Market Entropy
- 4.5. Patent/Trademark Analysis
- 5. Global Crop Protection Industry Analysis, Insights and Forecast, 2020-2032
- 5.1. Market Analysis, Insights and Forecast - by Function
- 5.1.1. Fungicide
- 5.1.2. Herbicide
- 5.1.3. Insecticide
- 5.1.4. Molluscicide
- 5.1.5. Nematicide
- 5.2. Market Analysis, Insights and Forecast - by Application Mode
- 5.2.1. Chemigation
- 5.2.2. Foliar
- 5.2.3. Fumigation
- 5.2.4. Seed Treatment
- 5.2.5. Soil Treatment
- 5.3. Market Analysis, Insights and Forecast - by Crop Type
- 5.3.1. Commercial Crops
- 5.3.2. Fruits & Vegetables
- 5.3.3. Grains & Cereals
- 5.3.4. Pulses & Oilseeds
- 5.3.5. Turf & Ornamental
- 5.4. Market Analysis, Insights and Forecast - by Function
- 5.4.1. Fungicide
- 5.4.2. Herbicide
- 5.4.3. Insecticide
- 5.4.4. Molluscicide
- 5.4.5. Nematicide
- 5.5. Market Analysis, Insights and Forecast - by Application Mode
- 5.5.1. Chemigation
- 5.5.2. Foliar
- 5.5.3. Fumigation
- 5.5.4. Seed Treatment
- 5.5.5. Soil Treatment
- 5.6. Market Analysis, Insights and Forecast - by Crop Type
- 5.6.1. Commercial Crops
- 5.6.2. Fruits & Vegetables
- 5.6.3. Grains & Cereals
- 5.6.4. Pulses & Oilseeds
- 5.6.5. Turf & Ornamental
- 5.7. Market Analysis, Insights and Forecast - by Region
- 5.7.1. North America
- 5.7.2. South America
- 5.7.3. Europe
- 5.7.4. Middle East & Africa
- 5.7.5. Asia Pacific
- 5.1. Market Analysis, Insights and Forecast - by Function
- 6. North America Crop Protection Industry Analysis, Insights and Forecast, 2020-2032
- 6.1. Market Analysis, Insights and Forecast - by Function
- 6.1.1. Fungicide
- 6.1.2. Herbicide
- 6.1.3. Insecticide
- 6.1.4. Molluscicide
- 6.1.5. Nematicide
- 6.2. Market Analysis, Insights and Forecast - by Application Mode
- 6.2.1. Chemigation
- 6.2.2. Foliar
- 6.2.3. Fumigation
- 6.2.4. Seed Treatment
- 6.2.5. Soil Treatment
- 6.3. Market Analysis, Insights and Forecast - by Crop Type
- 6.3.1. Commercial Crops
- 6.3.2. Fruits & Vegetables
- 6.3.3. Grains & Cereals
- 6.3.4. Pulses & Oilseeds
- 6.3.5. Turf & Ornamental
- 6.4. Market Analysis, Insights and Forecast - by Function
- 6.4.1. Fungicide
- 6.4.2. Herbicide
- 6.4.3. Insecticide
- 6.4.4. Molluscicide
- 6.4.5. Nematicide
- 6.5. Market Analysis, Insights and Forecast - by Application Mode
- 6.5.1. Chemigation
- 6.5.2. Foliar
- 6.5.3. Fumigation
- 6.5.4. Seed Treatment
- 6.5.5. Soil Treatment
- 6.6. Market Analysis, Insights and Forecast - by Crop Type
- 6.6.1. Commercial Crops
- 6.6.2. Fruits & Vegetables
- 6.6.3. Grains & Cereals
- 6.6.4. Pulses & Oilseeds
- 6.6.5. Turf & Ornamental
- 6.1. Market Analysis, Insights and Forecast - by Function
- 7. South America Crop Protection Industry Analysis, Insights and Forecast, 2020-2032
- 7.1. Market Analysis, Insights and Forecast - by Function
- 7.1.1. Fungicide
- 7.1.2. Herbicide
- 7.1.3. Insecticide
- 7.1.4. Molluscicide
- 7.1.5. Nematicide
- 7.2. Market Analysis, Insights and Forecast - by Application Mode
- 7.2.1. Chemigation
- 7.2.2. Foliar
- 7.2.3. Fumigation
- 7.2.4. Seed Treatment
- 7.2.5. Soil Treatment
- 7.3. Market Analysis, Insights and Forecast - by Crop Type
- 7.3.1. Commercial Crops
- 7.3.2. Fruits & Vegetables
- 7.3.3. Grains & Cereals
- 7.3.4. Pulses & Oilseeds
- 7.3.5. Turf & Ornamental
- 7.4. Market Analysis, Insights and Forecast - by Function
- 7.4.1. Fungicide
- 7.4.2. Herbicide
- 7.4.3. Insecticide
- 7.4.4. Molluscicide
- 7.4.5. Nematicide
- 7.5. Market Analysis, Insights and Forecast - by Application Mode
- 7.5.1. Chemigation
- 7.5.2. Foliar
- 7.5.3. Fumigation
- 7.5.4. Seed Treatment
- 7.5.5. Soil Treatment
- 7.6. Market Analysis, Insights and Forecast - by Crop Type
- 7.6.1. Commercial Crops
- 7.6.2. Fruits & Vegetables
- 7.6.3. Grains & Cereals
- 7.6.4. Pulses & Oilseeds
- 7.6.5. Turf & Ornamental
- 7.1. Market Analysis, Insights and Forecast - by Function
- 8. Europe Crop Protection Industry Analysis, Insights and Forecast, 2020-2032
- 8.1. Market Analysis, Insights and Forecast - by Function
- 8.1.1. Fungicide
- 8.1.2. Herbicide
- 8.1.3. Insecticide
- 8.1.4. Molluscicide
- 8.1.5. Nematicide
- 8.2. Market Analysis, Insights and Forecast - by Application Mode
- 8.2.1. Chemigation
- 8.2.2. Foliar
- 8.2.3. Fumigation
- 8.2.4. Seed Treatment
- 8.2.5. Soil Treatment
- 8.3. Market Analysis, Insights and Forecast - by Crop Type
- 8.3.1. Commercial Crops
- 8.3.2. Fruits & Vegetables
- 8.3.3. Grains & Cereals
- 8.3.4. Pulses & Oilseeds
- 8.3.5. Turf & Ornamental
- 8.4. Market Analysis, Insights and Forecast - by Function
- 8.4.1. Fungicide
- 8.4.2. Herbicide
- 8.4.3. Insecticide
- 8.4.4. Molluscicide
- 8.4.5. Nematicide
- 8.5. Market Analysis, Insights and Forecast - by Application Mode
- 8.5.1. Chemigation
- 8.5.2. Foliar
- 8.5.3. Fumigation
- 8.5.4. Seed Treatment
- 8.5.5. Soil Treatment
- 8.6. Market Analysis, Insights and Forecast - by Crop Type
- 8.6.1. Commercial Crops
- 8.6.2. Fruits & Vegetables
- 8.6.3. Grains & Cereals
- 8.6.4. Pulses & Oilseeds
- 8.6.5. Turf & Ornamental
- 8.1. Market Analysis, Insights and Forecast - by Function
- 9. Middle East & Africa Crop Protection Industry Analysis, Insights and Forecast, 2020-2032
- 9.1. Market Analysis, Insights and Forecast - by Function
- 9.1.1. Fungicide
- 9.1.2. Herbicide
- 9.1.3. Insecticide
- 9.1.4. Molluscicide
- 9.1.5. Nematicide
- 9.2. Market Analysis, Insights and Forecast - by Application Mode
- 9.2.1. Chemigation
- 9.2.2. Foliar
- 9.2.3. Fumigation
- 9.2.4. Seed Treatment
- 9.2.5. Soil Treatment
- 9.3. Market Analysis, Insights and Forecast - by Crop Type
- 9.3.1. Commercial Crops
- 9.3.2. Fruits & Vegetables
- 9.3.3. Grains & Cereals
- 9.3.4. Pulses & Oilseeds
- 9.3.5. Turf & Ornamental
- 9.4. Market Analysis, Insights and Forecast - by Function
- 9.4.1. Fungicide
- 9.4.2. Herbicide
- 9.4.3. Insecticide
- 9.4.4. Molluscicide
- 9.4.5. Nematicide
- 9.5. Market Analysis, Insights and Forecast - by Application Mode
- 9.5.1. Chemigation
- 9.5.2. Foliar
- 9.5.3. Fumigation
- 9.5.4. Seed Treatment
- 9.5.5. Soil Treatment
- 9.6. Market Analysis, Insights and Forecast - by Crop Type
- 9.6.1. Commercial Crops
- 9.6.2. Fruits & Vegetables
- 9.6.3. Grains & Cereals
- 9.6.4. Pulses & Oilseeds
- 9.6.5. Turf & Ornamental
- 9.1. Market Analysis, Insights and Forecast - by Function
- 10. Asia Pacific Crop Protection Industry Analysis, Insights and Forecast, 2020-2032
- 10.1. Market Analysis, Insights and Forecast - by Function
- 10.1.1. Fungicide
- 10.1.2. Herbicide
- 10.1.3. Insecticide
- 10.1.4. Molluscicide
- 10.1.5. Nematicide
- 10.2. Market Analysis, Insights and Forecast - by Application Mode
- 10.2.1. Chemigation
- 10.2.2. Foliar
- 10.2.3. Fumigation
- 10.2.4. Seed Treatment
- 10.2.5. Soil Treatment
- 10.3. Market Analysis, Insights and Forecast - by Crop Type
- 10.3.1. Commercial Crops
- 10.3.2. Fruits & Vegetables
- 10.3.3. Grains & Cereals
- 10.3.4. Pulses & Oilseeds
- 10.3.5. Turf & Ornamental
- 10.4. Market Analysis, Insights and Forecast - by Function
- 10.4.1. Fungicide
- 10.4.2. Herbicide
- 10.4.3. Insecticide
- 10.4.4. Molluscicide
- 10.4.5. Nematicide
- 10.5. Market Analysis, Insights and Forecast - by Application Mode
- 10.5.1. Chemigation
- 10.5.2. Foliar
- 10.5.3. Fumigation
- 10.5.4. Seed Treatment
- 10.5.5. Soil Treatment
- 10.6. Market Analysis, Insights and Forecast - by Crop Type
- 10.6.1. Commercial Crops
- 10.6.2. Fruits & Vegetables
- 10.6.3. Grains & Cereals
- 10.6.4. Pulses & Oilseeds
- 10.6.5. Turf & Ornamental
- 10.1. Market Analysis, Insights and Forecast - by Function
- 11. Competitive Analysis
- 11.1. Global Market Share Analysis 2025
- 11.2. Company Profiles
- 11.2.1 FMC Corporation
- 11.2.1.1. Overview
- 11.2.1.2. Products
- 11.2.1.3. SWOT Analysis
- 11.2.1.4. Recent Developments
- 11.2.1.5. Financials (Based on Availability)
- 11.2.2 Sumitomo Chemical Co Ltd
- 11.2.2.1. Overview
- 11.2.2.2. Products
- 11.2.2.3. SWOT Analysis
- 11.2.2.4. Recent Developments
- 11.2.2.5. Financials (Based on Availability)
- 11.2.3 ADAMA Agricultural Solutions Ltd
- 11.2.3.1. Overview
- 11.2.3.2. Products
- 11.2.3.3. SWOT Analysis
- 11.2.3.4. Recent Developments
- 11.2.3.5. Financials (Based on Availability)
- 11.2.4 Bayer AG
- 11.2.4.1. Overview
- 11.2.4.2. Products
- 11.2.4.3. SWOT Analysis
- 11.2.4.4. Recent Developments
- 11.2.4.5. Financials (Based on Availability)
- 11.2.5 UPL Limite
- 11.2.5.1. Overview
- 11.2.5.2. Products
- 11.2.5.3. SWOT Analysis
- 11.2.5.4. Recent Developments
- 11.2.5.5. Financials (Based on Availability)
- 11.2.6 Syngenta Group
- 11.2.6.1. Overview
- 11.2.6.2. Products
- 11.2.6.3. SWOT Analysis
- 11.2.6.4. Recent Developments
- 11.2.6.5. Financials (Based on Availability)
- 11.2.7 Jiangsu Yangnong Chemical Co Ltd
- 11.2.7.1. Overview
- 11.2.7.2. Products
- 11.2.7.3. SWOT Analysis
- 11.2.7.4. Recent Developments
- 11.2.7.5. Financials (Based on Availability)
- 11.2.8 Corteva Agriscience
- 11.2.8.1. Overview
- 11.2.8.2. Products
- 11.2.8.3. SWOT Analysis
- 11.2.8.4. Recent Developments
- 11.2.8.5. Financials (Based on Availability)
- 11.2.9 Nufarm Ltd
- 11.2.9.1. Overview
- 11.2.9.2. Products
- 11.2.9.3. SWOT Analysis
- 11.2.9.4. Recent Developments
- 11.2.9.5. Financials (Based on Availability)
- 11.2.10 BASF SE
- 11.2.10.1. Overview
- 11.2.10.2. Products
- 11.2.10.3. SWOT Analysis
- 11.2.10.4. Recent Developments
- 11.2.10.5. Financials (Based on Availability)
- 11.2.1 FMC Corporation
List of Figures
- Figure 1: Global Crop Protection Industry Revenue Breakdown (Million, %) by Region 2025 & 2033
- Figure 2: Global Crop Protection Industry Volume Breakdown (kilotons, %) by Region 2025 & 2033
- Figure 3: North America Crop Protection Industry Revenue (Million), by Function 2025 & 2033
- Figure 4: North America Crop Protection Industry Volume (kilotons), by Function 2025 & 2033
- Figure 5: North America Crop Protection Industry Revenue Share (%), by Function 2025 & 2033
- Figure 6: North America Crop Protection Industry Volume Share (%), by Function 2025 & 2033
- Figure 7: North America Crop Protection Industry Revenue (Million), by Application Mode 2025 & 2033
- Figure 8: North America Crop Protection Industry Volume (kilotons), by Application Mode 2025 & 2033
- Figure 9: North America Crop Protection Industry Revenue Share (%), by Application Mode 2025 & 2033
- Figure 10: North America Crop Protection Industry Volume Share (%), by Application Mode 2025 & 2033
- Figure 11: North America Crop Protection Industry Revenue (Million), by Crop Type 2025 & 2033
- Figure 12: North America Crop Protection Industry Volume (kilotons), by Crop Type 2025 & 2033
- Figure 13: North America Crop Protection Industry Revenue Share (%), by Crop Type 2025 & 2033
- Figure 14: North America Crop Protection Industry Volume Share (%), by Crop Type 2025 & 2033
- Figure 15: North America Crop Protection Industry Revenue (Million), by Function 2025 & 2033
- Figure 16: North America Crop Protection Industry Volume (kilotons), by Function 2025 & 2033
- Figure 17: North America Crop Protection Industry Revenue Share (%), by Function 2025 & 2033
- Figure 18: North America Crop Protection Industry Volume Share (%), by Function 2025 & 2033
- Figure 19: North America Crop Protection Industry Revenue (Million), by Application Mode 2025 & 2033
- Figure 20: North America Crop Protection Industry Volume (kilotons), by Application Mode 2025 & 2033
- Figure 21: North America Crop Protection Industry Revenue Share (%), by Application Mode 2025 & 2033
- Figure 22: North America Crop Protection Industry Volume Share (%), by Application Mode 2025 & 2033
- Figure 23: North America Crop Protection Industry Revenue (Million), by Crop Type 2025 & 2033
- Figure 24: North America Crop Protection Industry Volume (kilotons), by Crop Type 2025 & 2033
- Figure 25: North America Crop Protection Industry Revenue Share (%), by Crop Type 2025 & 2033
- Figure 26: North America Crop Protection Industry Volume Share (%), by Crop Type 2025 & 2033
- Figure 27: North America Crop Protection Industry Revenue (Million), by Country 2025 & 2033
- Figure 28: North America Crop Protection Industry Volume (kilotons), by Country 2025 & 2033
- Figure 29: North America Crop Protection Industry Revenue Share (%), by Country 2025 & 2033
- Figure 30: North America Crop Protection Industry Volume Share (%), by Country 2025 & 2033
- Figure 31: South America Crop Protection Industry Revenue (Million), by Function 2025 & 2033
- Figure 32: South America Crop Protection Industry Volume (kilotons), by Function 2025 & 2033
- Figure 33: South America Crop Protection Industry Revenue Share (%), by Function 2025 & 2033
- Figure 34: South America Crop Protection Industry Volume Share (%), by Function 2025 & 2033
- Figure 35: South America Crop Protection Industry Revenue (Million), by Application Mode 2025 & 2033
- Figure 36: South America Crop Protection Industry Volume (kilotons), by Application Mode 2025 & 2033
- Figure 37: South America Crop Protection Industry Revenue Share (%), by Application Mode 2025 & 2033
- Figure 38: South America Crop Protection Industry Volume Share (%), by Application Mode 2025 & 2033
- Figure 39: South America Crop Protection Industry Revenue (Million), by Crop Type 2025 & 2033
- Figure 40: South America Crop Protection Industry Volume (kilotons), by Crop Type 2025 & 2033
- Figure 41: South America Crop Protection Industry Revenue Share (%), by Crop Type 2025 & 2033
- Figure 42: South America Crop Protection Industry Volume Share (%), by Crop Type 2025 & 2033
- Figure 43: South America Crop Protection Industry Revenue (Million), by Function 2025 & 2033
- Figure 44: South America Crop Protection Industry Volume (kilotons), by Function 2025 & 2033
- Figure 45: South America Crop Protection Industry Revenue Share (%), by Function 2025 & 2033
- Figure 46: South America Crop Protection Industry Volume Share (%), by Function 2025 & 2033
- Figure 47: South America Crop Protection Industry Revenue (Million), by Application Mode 2025 & 2033
- Figure 48: South America Crop Protection Industry Volume (kilotons), by Application Mode 2025 & 2033
- Figure 49: South America Crop Protection Industry Revenue Share (%), by Application Mode 2025 & 2033
- Figure 50: South America Crop Protection Industry Volume Share (%), by Application Mode 2025 & 2033
- Figure 51: South America Crop Protection Industry Revenue (Million), by Crop Type 2025 & 2033
- Figure 52: South America Crop Protection Industry Volume (kilotons), by Crop Type 2025 & 2033
- Figure 53: South America Crop Protection Industry Revenue Share (%), by Crop Type 2025 & 2033
- Figure 54: South America Crop Protection Industry Volume Share (%), by Crop Type 2025 & 2033
- Figure 55: South America Crop Protection Industry Revenue (Million), by Country 2025 & 2033
- Figure 56: South America Crop Protection Industry Volume (kilotons), by Country 2025 & 2033
- Figure 57: South America Crop Protection Industry Revenue Share (%), by Country 2025 & 2033
- Figure 58: South America Crop Protection Industry Volume Share (%), by Country 2025 & 2033
- Figure 59: Europe Crop Protection Industry Revenue (Million), by Function 2025 & 2033
- Figure 60: Europe Crop Protection Industry Volume (kilotons), by Function 2025 & 2033
- Figure 61: Europe Crop Protection Industry Revenue Share (%), by Function 2025 & 2033
- Figure 62: Europe Crop Protection Industry Volume Share (%), by Function 2025 & 2033
- Figure 63: Europe Crop Protection Industry Revenue (Million), by Application Mode 2025 & 2033
- Figure 64: Europe Crop Protection Industry Volume (kilotons), by Application Mode 2025 & 2033
- Figure 65: Europe Crop Protection Industry Revenue Share (%), by Application Mode 2025 & 2033
- Figure 66: Europe Crop Protection Industry Volume Share (%), by Application Mode 2025 & 2033
- Figure 67: Europe Crop Protection Industry Revenue (Million), by Crop Type 2025 & 2033
- Figure 68: Europe Crop Protection Industry Volume (kilotons), by Crop Type 2025 & 2033
- Figure 69: Europe Crop Protection Industry Revenue Share (%), by Crop Type 2025 & 2033
- Figure 70: Europe Crop Protection Industry Volume Share (%), by Crop Type 2025 & 2033
- Figure 71: Europe Crop Protection Industry Revenue (Million), by Function 2025 & 2033
- Figure 72: Europe Crop Protection Industry Volume (kilotons), by Function 2025 & 2033
- Figure 73: Europe Crop Protection Industry Revenue Share (%), by Function 2025 & 2033
- Figure 74: Europe Crop Protection Industry Volume Share (%), by Function 2025 & 2033
- Figure 75: Europe Crop Protection Industry Revenue (Million), by Application Mode 2025 & 2033
- Figure 76: Europe Crop Protection Industry Volume (kilotons), by Application Mode 2025 & 2033
- Figure 77: Europe Crop Protection Industry Revenue Share (%), by Application Mode 2025 & 2033
- Figure 78: Europe Crop Protection Industry Volume Share (%), by Application Mode 2025 & 2033
- Figure 79: Europe Crop Protection Industry Revenue (Million), by Crop Type 2025 & 2033
- Figure 80: Europe Crop Protection Industry Volume (kilotons), by Crop Type 2025 & 2033
- Figure 81: Europe Crop Protection Industry Revenue Share (%), by Crop Type 2025 & 2033
- Figure 82: Europe Crop Protection Industry Volume Share (%), by Crop Type 2025 & 2033
- Figure 83: Europe Crop Protection Industry Revenue (Million), by Country 2025 & 2033
- Figure 84: Europe Crop Protection Industry Volume (kilotons), by Country 2025 & 2033
- Figure 85: Europe Crop Protection Industry Revenue Share (%), by Country 2025 & 2033
- Figure 86: Europe Crop Protection Industry Volume Share (%), by Country 2025 & 2033
- Figure 87: Middle East & Africa Crop Protection Industry Revenue (Million), by Function 2025 & 2033
- Figure 88: Middle East & Africa Crop Protection Industry Volume (kilotons), by Function 2025 & 2033
- Figure 89: Middle East & Africa Crop Protection Industry Revenue Share (%), by Function 2025 & 2033
- Figure 90: Middle East & Africa Crop Protection Industry Volume Share (%), by Function 2025 & 2033
- Figure 91: Middle East & Africa Crop Protection Industry Revenue (Million), by Application Mode 2025 & 2033
- Figure 92: Middle East & Africa Crop Protection Industry Volume (kilotons), by Application Mode 2025 & 2033
- Figure 93: Middle East & Africa Crop Protection Industry Revenue Share (%), by Application Mode 2025 & 2033
- Figure 94: Middle East & Africa Crop Protection Industry Volume Share (%), by Application Mode 2025 & 2033
- Figure 95: Middle East & Africa Crop Protection Industry Revenue (Million), by Crop Type 2025 & 2033
- Figure 96: Middle East & Africa Crop Protection Industry Volume (kilotons), by Crop Type 2025 & 2033
- Figure 97: Middle East & Africa Crop Protection Industry Revenue Share (%), by Crop Type 2025 & 2033
- Figure 98: Middle East & Africa Crop Protection Industry Volume Share (%), by Crop Type 2025 & 2033
- Figure 99: Middle East & Africa Crop Protection Industry Revenue (Million), by Function 2025 & 2033
- Figure 100: Middle East & Africa Crop Protection Industry Volume (kilotons), by Function 2025 & 2033
- Figure 101: Middle East & Africa Crop Protection Industry Revenue Share (%), by Function 2025 & 2033
- Figure 102: Middle East & Africa Crop Protection Industry Volume Share (%), by Function 2025 & 2033
- Figure 103: Middle East & Africa Crop Protection Industry Revenue (Million), by Application Mode 2025 & 2033
- Figure 104: Middle East & Africa Crop Protection Industry Volume (kilotons), by Application Mode 2025 & 2033
- Figure 105: Middle East & Africa Crop Protection Industry Revenue Share (%), by Application Mode 2025 & 2033
- Figure 106: Middle East & Africa Crop Protection Industry Volume Share (%), by Application Mode 2025 & 2033
- Figure 107: Middle East & Africa Crop Protection Industry Revenue (Million), by Crop Type 2025 & 2033
- Figure 108: Middle East & Africa Crop Protection Industry Volume (kilotons), by Crop Type 2025 & 2033
- Figure 109: Middle East & Africa Crop Protection Industry Revenue Share (%), by Crop Type 2025 & 2033
- Figure 110: Middle East & Africa Crop Protection Industry Volume Share (%), by Crop Type 2025 & 2033
- Figure 111: Middle East & Africa Crop Protection Industry Revenue (Million), by Country 2025 & 2033
- Figure 112: Middle East & Africa Crop Protection Industry Volume (kilotons), by Country 2025 & 2033
- Figure 113: Middle East & Africa Crop Protection Industry Revenue Share (%), by Country 2025 & 2033
- Figure 114: Middle East & Africa Crop Protection Industry Volume Share (%), by Country 2025 & 2033
- Figure 115: Asia Pacific Crop Protection Industry Revenue (Million), by Function 2025 & 2033
- Figure 116: Asia Pacific Crop Protection Industry Volume (kilotons), by Function 2025 & 2033
- Figure 117: Asia Pacific Crop Protection Industry Revenue Share (%), by Function 2025 & 2033
- Figure 118: Asia Pacific Crop Protection Industry Volume Share (%), by Function 2025 & 2033
- Figure 119: Asia Pacific Crop Protection Industry Revenue (Million), by Application Mode 2025 & 2033
- Figure 120: Asia Pacific Crop Protection Industry Volume (kilotons), by Application Mode 2025 & 2033
- Figure 121: Asia Pacific Crop Protection Industry Revenue Share (%), by Application Mode 2025 & 2033
- Figure 122: Asia Pacific Crop Protection Industry Volume Share (%), by Application Mode 2025 & 2033
- Figure 123: Asia Pacific Crop Protection Industry Revenue (Million), by Crop Type 2025 & 2033
- Figure 124: Asia Pacific Crop Protection Industry Volume (kilotons), by Crop Type 2025 & 2033
- Figure 125: Asia Pacific Crop Protection Industry Revenue Share (%), by Crop Type 2025 & 2033
- Figure 126: Asia Pacific Crop Protection Industry Volume Share (%), by Crop Type 2025 & 2033
- Figure 127: Asia Pacific Crop Protection Industry Revenue (Million), by Function 2025 & 2033
- Figure 128: Asia Pacific Crop Protection Industry Volume (kilotons), by Function 2025 & 2033
- Figure 129: Asia Pacific Crop Protection Industry Revenue Share (%), by Function 2025 & 2033
- Figure 130: Asia Pacific Crop Protection Industry Volume Share (%), by Function 2025 & 2033
- Figure 131: Asia Pacific Crop Protection Industry Revenue (Million), by Application Mode 2025 & 2033
- Figure 132: Asia Pacific Crop Protection Industry Volume (kilotons), by Application Mode 2025 & 2033
- Figure 133: Asia Pacific Crop Protection Industry Revenue Share (%), by Application Mode 2025 & 2033
- Figure 134: Asia Pacific Crop Protection Industry Volume Share (%), by Application Mode 2025 & 2033
- Figure 135: Asia Pacific Crop Protection Industry Revenue (Million), by Crop Type 2025 & 2033
- Figure 136: Asia Pacific Crop Protection Industry Volume (kilotons), by Crop Type 2025 & 2033
- Figure 137: Asia Pacific Crop Protection Industry Revenue Share (%), by Crop Type 2025 & 2033
- Figure 138: Asia Pacific Crop Protection Industry Volume Share (%), by Crop Type 2025 & 2033
- Figure 139: Asia Pacific Crop Protection Industry Revenue (Million), by Country 2025 & 2033
- Figure 140: Asia Pacific Crop Protection Industry Volume (kilotons), by Country 2025 & 2033
- Figure 141: Asia Pacific Crop Protection Industry Revenue Share (%), by Country 2025 & 2033
- Figure 142: Asia Pacific Crop Protection Industry Volume Share (%), by Country 2025 & 2033
List of Tables
- Table 1: Global Crop Protection Industry Revenue Million Forecast, by Function 2020 & 2033
- Table 2: Global Crop Protection Industry Volume kilotons Forecast, by Function 2020 & 2033
- Table 3: Global Crop Protection Industry Revenue Million Forecast, by Application Mode 2020 & 2033
- Table 4: Global Crop Protection Industry Volume kilotons Forecast, by Application Mode 2020 & 2033
- Table 5: Global Crop Protection Industry Revenue Million Forecast, by Crop Type 2020 & 2033
- Table 6: Global Crop Protection Industry Volume kilotons Forecast, by Crop Type 2020 & 2033
- Table 7: Global Crop Protection Industry Revenue Million Forecast, by Function 2020 & 2033
- Table 8: Global Crop Protection Industry Volume kilotons Forecast, by Function 2020 & 2033
- Table 9: Global Crop Protection Industry Revenue Million Forecast, by Application Mode 2020 & 2033
- Table 10: Global Crop Protection Industry Volume kilotons Forecast, by Application Mode 2020 & 2033
- Table 11: Global Crop Protection Industry Revenue Million Forecast, by Crop Type 2020 & 2033
- Table 12: Global Crop Protection Industry Volume kilotons Forecast, by Crop Type 2020 & 2033
- Table 13: Global Crop Protection Industry Revenue Million Forecast, by Region 2020 & 2033
- Table 14: Global Crop Protection Industry Volume kilotons Forecast, by Region 2020 & 2033
- Table 15: Global Crop Protection Industry Revenue Million Forecast, by Function 2020 & 2033
- Table 16: Global Crop Protection Industry Volume kilotons Forecast, by Function 2020 & 2033
- Table 17: Global Crop Protection Industry Revenue Million Forecast, by Application Mode 2020 & 2033
- Table 18: Global Crop Protection Industry Volume kilotons Forecast, by Application Mode 2020 & 2033
- Table 19: Global Crop Protection Industry Revenue Million Forecast, by Crop Type 2020 & 2033
- Table 20: Global Crop Protection Industry Volume kilotons Forecast, by Crop Type 2020 & 2033
- Table 21: Global Crop Protection Industry Revenue Million Forecast, by Function 2020 & 2033
- Table 22: Global Crop Protection Industry Volume kilotons Forecast, by Function 2020 & 2033
- Table 23: Global Crop Protection Industry Revenue Million Forecast, by Application Mode 2020 & 2033
- Table 24: Global Crop Protection Industry Volume kilotons Forecast, by Application Mode 2020 & 2033
- Table 25: Global Crop Protection Industry Revenue Million Forecast, by Crop Type 2020 & 2033
- Table 26: Global Crop Protection Industry Volume kilotons Forecast, by Crop Type 2020 & 2033
- Table 27: Global Crop Protection Industry Revenue Million Forecast, by Country 2020 & 2033
- Table 28: Global Crop Protection Industry Volume kilotons Forecast, by Country 2020 & 2033
- Table 29: United States Crop Protection Industry Revenue (Million) Forecast, by Application 2020 & 2033
- Table 30: United States Crop Protection Industry Volume (kilotons) Forecast, by Application 2020 & 2033
- Table 31: Canada Crop Protection Industry Revenue (Million) Forecast, by Application 2020 & 2033
- Table 32: Canada Crop Protection Industry Volume (kilotons) Forecast, by Application 2020 & 2033
- Table 33: Mexico Crop Protection Industry Revenue (Million) Forecast, by Application 2020 & 2033
- Table 34: Mexico Crop Protection Industry Volume (kilotons) Forecast, by Application 2020 & 2033
- Table 35: Global Crop Protection Industry Revenue Million Forecast, by Function 2020 & 2033
- Table 36: Global Crop Protection Industry Volume kilotons Forecast, by Function 2020 & 2033
- Table 37: Global Crop Protection Industry Revenue Million Forecast, by Application Mode 2020 & 2033
- Table 38: Global Crop Protection Industry Volume kilotons Forecast, by Application Mode 2020 & 2033
- Table 39: Global Crop Protection Industry Revenue Million Forecast, by Crop Type 2020 & 2033
- Table 40: Global Crop Protection Industry Volume kilotons Forecast, by Crop Type 2020 & 2033
- Table 41: Global Crop Protection Industry Revenue Million Forecast, by Function 2020 & 2033
- Table 42: Global Crop Protection Industry Volume kilotons Forecast, by Function 2020 & 2033
- Table 43: Global Crop Protection Industry Revenue Million Forecast, by Application Mode 2020 & 2033
- Table 44: Global Crop Protection Industry Volume kilotons Forecast, by Application Mode 2020 & 2033
- Table 45: Global Crop Protection Industry Revenue Million Forecast, by Crop Type 2020 & 2033
- Table 46: Global Crop Protection Industry Volume kilotons Forecast, by Crop Type 2020 & 2033
- Table 47: Global Crop Protection Industry Revenue Million Forecast, by Country 2020 & 2033
- Table 48: Global Crop Protection Industry Volume kilotons Forecast, by Country 2020 & 2033
- Table 49: Brazil Crop Protection Industry Revenue (Million) Forecast, by Application 2020 & 2033
- Table 50: Brazil Crop Protection Industry Volume (kilotons) Forecast, by Application 2020 & 2033
- Table 51: Argentina Crop Protection Industry Revenue (Million) Forecast, by Application 2020 & 2033
- Table 52: Argentina Crop Protection Industry Volume (kilotons) Forecast, by Application 2020 & 2033
- Table 53: Rest of South America Crop Protection Industry Revenue (Million) Forecast, by Application 2020 & 2033
- Table 54: Rest of South America Crop Protection Industry Volume (kilotons) Forecast, by Application 2020 & 2033
- Table 55: Global Crop Protection Industry Revenue Million Forecast, by Function 2020 & 2033
- Table 56: Global Crop Protection Industry Volume kilotons Forecast, by Function 2020 & 2033
- Table 57: Global Crop Protection Industry Revenue Million Forecast, by Application Mode 2020 & 2033
- Table 58: Global Crop Protection Industry Volume kilotons Forecast, by Application Mode 2020 & 2033
- Table 59: Global Crop Protection Industry Revenue Million Forecast, by Crop Type 2020 & 2033
- Table 60: Global Crop Protection Industry Volume kilotons Forecast, by Crop Type 2020 & 2033
- Table 61: Global Crop Protection Industry Revenue Million Forecast, by Function 2020 & 2033
- Table 62: Global Crop Protection Industry Volume kilotons Forecast, by Function 2020 & 2033
- Table 63: Global Crop Protection Industry Revenue Million Forecast, by Application Mode 2020 & 2033
- Table 64: Global Crop Protection Industry Volume kilotons Forecast, by Application Mode 2020 & 2033
- Table 65: Global Crop Protection Industry Revenue Million Forecast, by Crop Type 2020 & 2033
- Table 66: Global Crop Protection Industry Volume kilotons Forecast, by Crop Type 2020 & 2033
- Table 67: Global Crop Protection Industry Revenue Million Forecast, by Country 2020 & 2033
- Table 68: Global Crop Protection Industry Volume kilotons Forecast, by Country 2020 & 2033
- Table 69: United Kingdom Crop Protection Industry Revenue (Million) Forecast, by Application 2020 & 2033
- Table 70: United Kingdom Crop Protection Industry Volume (kilotons) Forecast, by Application 2020 & 2033
- Table 71: Germany Crop Protection Industry Revenue (Million) Forecast, by Application 2020 & 2033
- Table 72: Germany Crop Protection Industry Volume (kilotons) Forecast, by Application 2020 & 2033
- Table 73: France Crop Protection Industry Revenue (Million) Forecast, by Application 2020 & 2033
- Table 74: France Crop Protection Industry Volume (kilotons) Forecast, by Application 2020 & 2033
- Table 75: Italy Crop Protection Industry Revenue (Million) Forecast, by Application 2020 & 2033
- Table 76: Italy Crop Protection Industry Volume (kilotons) Forecast, by Application 2020 & 2033
- Table 77: Spain Crop Protection Industry Revenue (Million) Forecast, by Application 2020 & 2033
- Table 78: Spain Crop Protection Industry Volume (kilotons) Forecast, by Application 2020 & 2033
- Table 79: Russia Crop Protection Industry Revenue (Million) Forecast, by Application 2020 & 2033
- Table 80: Russia Crop Protection Industry Volume (kilotons) Forecast, by Application 2020 & 2033
- Table 81: Benelux Crop Protection Industry Revenue (Million) Forecast, by Application 2020 & 2033
- Table 82: Benelux Crop Protection Industry Volume (kilotons) Forecast, by Application 2020 & 2033
- Table 83: Nordics Crop Protection Industry Revenue (Million) Forecast, by Application 2020 & 2033
- Table 84: Nordics Crop Protection Industry Volume (kilotons) Forecast, by Application 2020 & 2033
- Table 85: Rest of Europe Crop Protection Industry Revenue (Million) Forecast, by Application 2020 & 2033
- Table 86: Rest of Europe Crop Protection Industry Volume (kilotons) Forecast, by Application 2020 & 2033
- Table 87: Global Crop Protection Industry Revenue Million Forecast, by Function 2020 & 2033
- Table 88: Global Crop Protection Industry Volume kilotons Forecast, by Function 2020 & 2033
- Table 89: Global Crop Protection Industry Revenue Million Forecast, by Application Mode 2020 & 2033
- Table 90: Global Crop Protection Industry Volume kilotons Forecast, by Application Mode 2020 & 2033
- Table 91: Global Crop Protection Industry Revenue Million Forecast, by Crop Type 2020 & 2033
- Table 92: Global Crop Protection Industry Volume kilotons Forecast, by Crop Type 2020 & 2033
- Table 93: Global Crop Protection Industry Revenue Million Forecast, by Function 2020 & 2033
- Table 94: Global Crop Protection Industry Volume kilotons Forecast, by Function 2020 & 2033
- Table 95: Global Crop Protection Industry Revenue Million Forecast, by Application Mode 2020 & 2033
- Table 96: Global Crop Protection Industry Volume kilotons Forecast, by Application Mode 2020 & 2033
- Table 97: Global Crop Protection Industry Revenue Million Forecast, by Crop Type 2020 & 2033
- Table 98: Global Crop Protection Industry Volume kilotons Forecast, by Crop Type 2020 & 2033
- Table 99: Global Crop Protection Industry Revenue Million Forecast, by Country 2020 & 2033
- Table 100: Global Crop Protection Industry Volume kilotons Forecast, by Country 2020 & 2033
- Table 101: Turkey Crop Protection Industry Revenue (Million) Forecast, by Application 2020 & 2033
- Table 102: Turkey Crop Protection Industry Volume (kilotons) Forecast, by Application 2020 & 2033
- Table 103: Israel Crop Protection Industry Revenue (Million) Forecast, by Application 2020 & 2033
- Table 104: Israel Crop Protection Industry Volume (kilotons) Forecast, by Application 2020 & 2033
- Table 105: GCC Crop Protection Industry Revenue (Million) Forecast, by Application 2020 & 2033
- Table 106: GCC Crop Protection Industry Volume (kilotons) Forecast, by Application 2020 & 2033
- Table 107: North Africa Crop Protection Industry Revenue (Million) Forecast, by Application 2020 & 2033
- Table 108: North Africa Crop Protection Industry Volume (kilotons) Forecast, by Application 2020 & 2033
- Table 109: South Africa Crop Protection Industry Revenue (Million) Forecast, by Application 2020 & 2033
- Table 110: South Africa Crop Protection Industry Volume (kilotons) Forecast, by Application 2020 & 2033
- Table 111: Rest of Middle East & Africa Crop Protection Industry Revenue (Million) Forecast, by Application 2020 & 2033
- Table 112: Rest of Middle East & Africa Crop Protection Industry Volume (kilotons) Forecast, by Application 2020 & 2033
- Table 113: Global Crop Protection Industry Revenue Million Forecast, by Function 2020 & 2033
- Table 114: Global Crop Protection Industry Volume kilotons Forecast, by Function 2020 & 2033
- Table 115: Global Crop Protection Industry Revenue Million Forecast, by Application Mode 2020 & 2033
- Table 116: Global Crop Protection Industry Volume kilotons Forecast, by Application Mode 2020 & 2033
- Table 117: Global Crop Protection Industry Revenue Million Forecast, by Crop Type 2020 & 2033
- Table 118: Global Crop Protection Industry Volume kilotons Forecast, by Crop Type 2020 & 2033
- Table 119: Global Crop Protection Industry Revenue Million Forecast, by Function 2020 & 2033
- Table 120: Global Crop Protection Industry Volume kilotons Forecast, by Function 2020 & 2033
- Table 121: Global Crop Protection Industry Revenue Million Forecast, by Application Mode 2020 & 2033
- Table 122: Global Crop Protection Industry Volume kilotons Forecast, by Application Mode 2020 & 2033
- Table 123: Global Crop Protection Industry Revenue Million Forecast, by Crop Type 2020 & 2033
- Table 124: Global Crop Protection Industry Volume kilotons Forecast, by Crop Type 2020 & 2033
- Table 125: Global Crop Protection Industry Revenue Million Forecast, by Country 2020 & 2033
- Table 126: Global Crop Protection Industry Volume kilotons Forecast, by Country 2020 & 2033
- Table 127: China Crop Protection Industry Revenue (Million) Forecast, by Application 2020 & 2033
- Table 128: China Crop Protection Industry Volume (kilotons) Forecast, by Application 2020 & 2033
- Table 129: India Crop Protection Industry Revenue (Million) Forecast, by Application 2020 & 2033
- Table 130: India Crop Protection Industry Volume (kilotons) Forecast, by Application 2020 & 2033
- Table 131: Japan Crop Protection Industry Revenue (Million) Forecast, by Application 2020 & 2033
- Table 132: Japan Crop Protection Industry Volume (kilotons) Forecast, by Application 2020 & 2033
- Table 133: South Korea Crop Protection Industry Revenue (Million) Forecast, by Application 2020 & 2033
- Table 134: South Korea Crop Protection Industry Volume (kilotons) Forecast, by Application 2020 & 2033
- Table 135: ASEAN Crop Protection Industry Revenue (Million) Forecast, by Application 2020 & 2033
- Table 136: ASEAN Crop Protection Industry Volume (kilotons) Forecast, by Application 2020 & 2033
- Table 137: Oceania Crop Protection Industry Revenue (Million) Forecast, by Application 2020 & 2033
- Table 138: Oceania Crop Protection Industry Volume (kilotons) Forecast, by Application 2020 & 2033
- Table 139: Rest of Asia Pacific Crop Protection Industry Revenue (Million) Forecast, by Application 2020 & 2033
- Table 140: Rest of Asia Pacific Crop Protection Industry Volume (kilotons) Forecast, by Application 2020 & 2033
Frequently Asked Questions
1. What is the projected Compound Annual Growth Rate (CAGR) of the Crop Protection Industry?
The projected CAGR is approximately 5.60%.
2. Which companies are prominent players in the Crop Protection Industry?
Key companies in the market include FMC Corporation, Sumitomo Chemical Co Ltd, ADAMA Agricultural Solutions Ltd, Bayer AG, UPL Limite, Syngenta Group, Jiangsu Yangnong Chemical Co Ltd, Corteva Agriscience, Nufarm Ltd, BASF SE.
3. What are the main segments of the Crop Protection Industry?
The market segments include Function, Application Mode, Crop Type, Function, Application Mode, Crop Type.
4. Can you provide details about the market size?
The market size is estimated to be USD XX Million as of 2022.
5. What are some drivers contributing to market growth?
Seed Treatment As A Solution To Enhance Yield; Growing Awareness For Seed Treatment Among The Farmers; Rising Trend Of Organic Farming.
6. What are the notable trends driving market growth?
OTHER KEY INDUSTRY TRENDS COVERED IN THE REPORT.
7. Are there any restraints impacting market growth?
Limitations Across Farm-Level Seed Treatment; Rising Environmental Concerns.
8. Can you provide examples of recent developments in the market?
December 2023: ADAMA introduced its most advanced cross-spectrum herbicide called Kampai for the grain business. The new product provides the broadest application window for broadleaf and narrow-leaf weed control for cereal crops.July 2023: ADAMA introduced new products, Davai A Plus and Clearfield Broad-Spectrum Herbicide Solutions, for imidazolinone-tolerant legumes like lentils, peas, and soybeans.April 2023: Nufarm launched a new liquid formulation fungicide, Tourney EZ, exclusively for turf and ornamental crops based on customer demand, which further strengthens the company's role in turf and ornamental crop protection.
9. What pricing options are available for accessing the report?
Pricing options include single-user, multi-user, and enterprise licenses priced at USD 3800, USD 4500, and USD 5800 respectively.
10. Is the market size provided in terms of value or volume?
The market size is provided in terms of value, measured in Million and volume, measured in kilotons.
11. Are there any specific market keywords associated with the report?
Yes, the market keyword associated with the report is "Crop Protection Industry," which aids in identifying and referencing the specific market segment covered.
12. How do I determine which pricing option suits my needs best?
The pricing options vary based on user requirements and access needs. Individual users may opt for single-user licenses, while businesses requiring broader access may choose multi-user or enterprise licenses for cost-effective access to the report.
13. Are there any additional resources or data provided in the Crop Protection Industry report?
While the report offers comprehensive insights, it's advisable to review the specific contents or supplementary materials provided to ascertain if additional resources or data are available.
14. How can I stay updated on further developments or reports in the Crop Protection Industry?
To stay informed about further developments, trends, and reports in the Crop Protection Industry, consider subscribing to industry newsletters, following relevant companies and organizations, or regularly checking reputable industry news sources and publications.
Methodology
Step 1 - Identification of Relevant Samples Size from Population Database


Step 2 - Approaches for Defining Global Market Size (Value, Volume* & Price*)

Note*: In applicable scenarios
Step 3 - Data Sources
Primary Research
- Web Analytics
- Survey Reports
- Research Institute
- Latest Research Reports
- Opinion Leaders
Secondary Research
- Annual Reports
- White Paper
- Latest Press Release
- Industry Association
- Paid Database
- Investor Presentations

Step 4 - Data Triangulation
Involves using different sources of information in order to increase the validity of a study
These sources are likely to be stakeholders in a program - participants, other researchers, program staff, other community members, and so on.
Then we put all data in single framework & apply various statistical tools to find out the dynamic on the market.
During the analysis stage, feedback from the stakeholder groups would be compared to determine areas of agreement as well as areas of divergence